New Lows Ahead For Bitcoin?
Ethereum Likely To Follow Suit?

Welcome to the Rekt Capital Newsletter!
Monday editions are dedicated to my macro research on Bitcoin and the Crypto market.
I share complex, cutting-edge research insights about the crypto market in a simple, easy to understand format.
Whether that’s insights about Bitcoin’s historically recurring price tendencies or Market Cycle analysis on Ethereum - the goal is to offer you a unique perspective and incredible value.
If you like the newsletter, it would mean a lot if you spread the word and tell your friends about it:

I'm excited to announce my partnership with Bitget crypto exchange! 🔥
Bitget is the world's largest crypto copy trading platform, official partner of Juventus Football Club and top 5 crypto derivatives exchange in volume as listed on CoinMarketCap!
To celebrate, Bitget has been very kind to arrange another special promo for valued readers of the Rekt Capital Newsletter.
Sign up using my link to Bitget and you will get:
• Up to $8000 sign up bonus 🔥
• 15% discount on ALL futures trading fees 🔥
• 0 fees on ALL spot market pairs 🔥
Sign up to Bitget using my link and make the most of this special promo:
Bitcoin - The Current Range

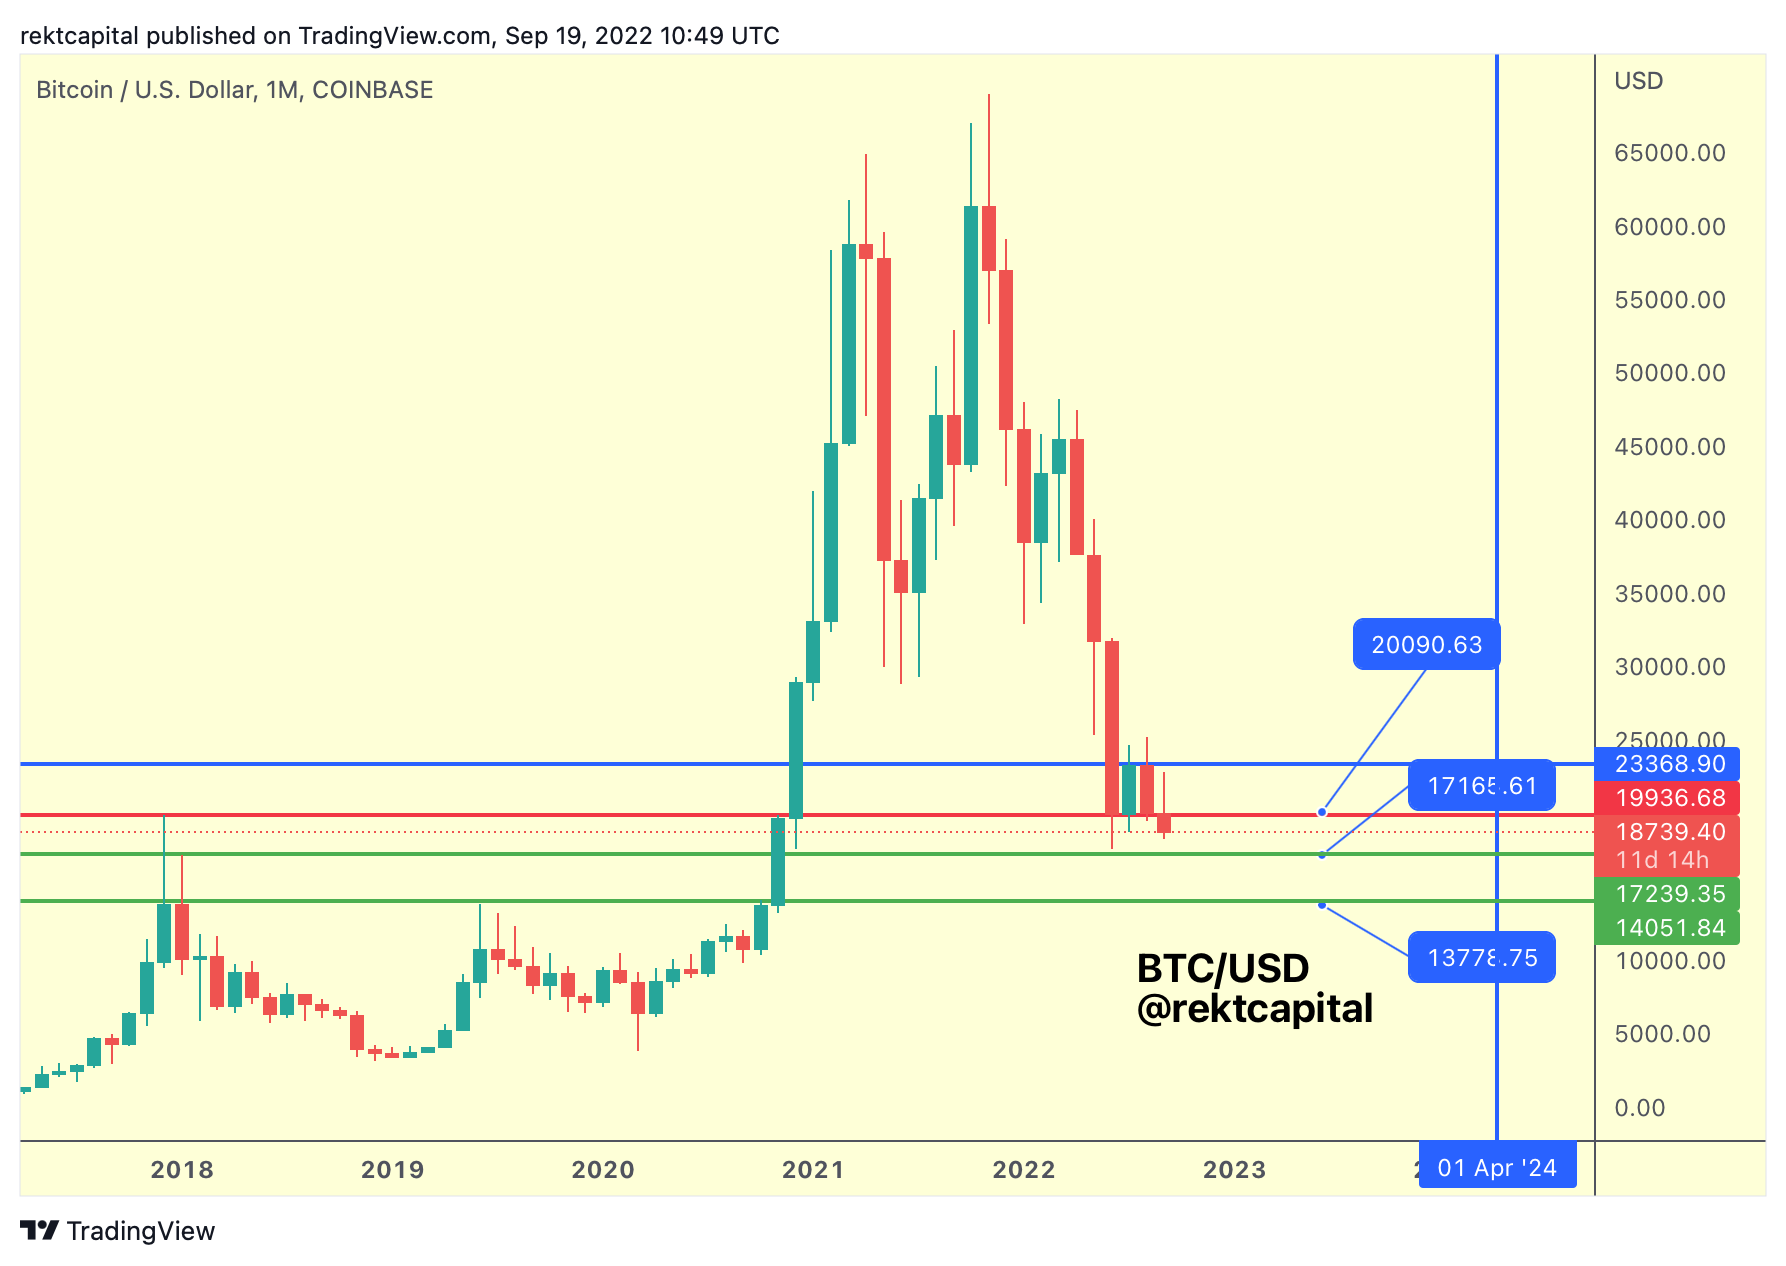
The most important thing to note at this time is the $20000-$23350 range (red-blue) and how the $20K support is showcasing weakness.
Just by comparing the reaction from $20K this month vs the reaction from July for example, there is a notable difference in the buy-side pressure within the $20K support.
In fact, the rebound from the $20K support this month has been so weak that it actually looks like the upside wick reaching into the range is price’s way of suggesting that $20K may be flipping into a resistance (i.e. resisting a return into the range, trapping FOMO buyers in this upside wick.)
Much can still change throughout the month of course, but at the moment the price action is telling a story which suggest that $20K may be flipping into new resistance on the Monthly timeframe, setting up for a confirmed breakdown from the range.
In the instance that $20K indeed sees downside continuation from the $20K support, the next immediate supports are $17165 and ~$13900.
Bitcoin - Historical Death Cross Downside

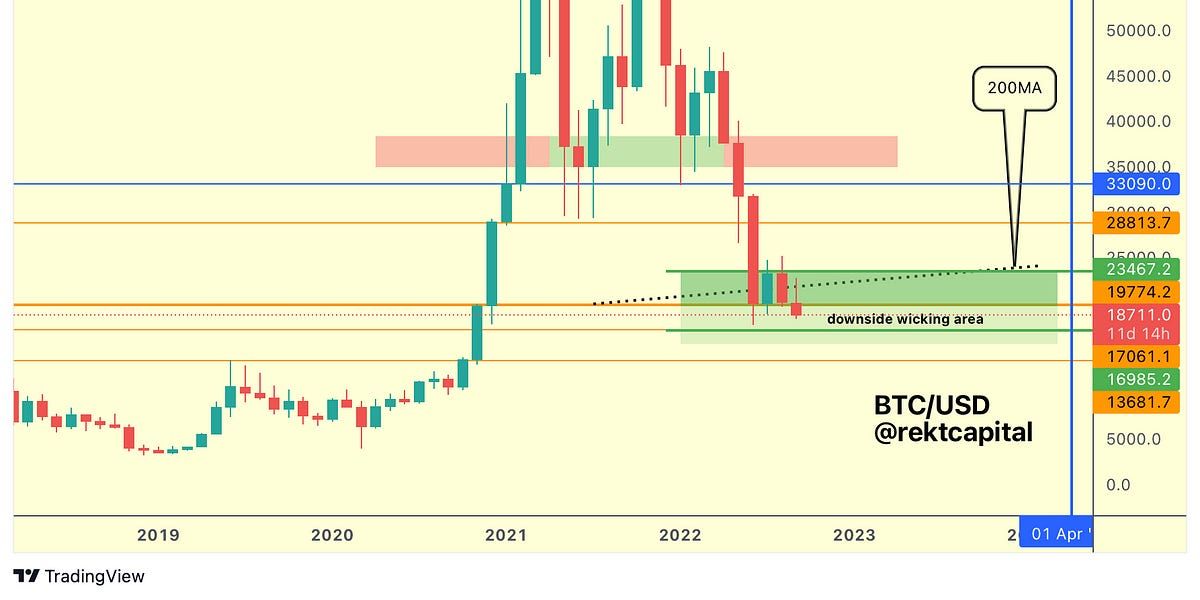
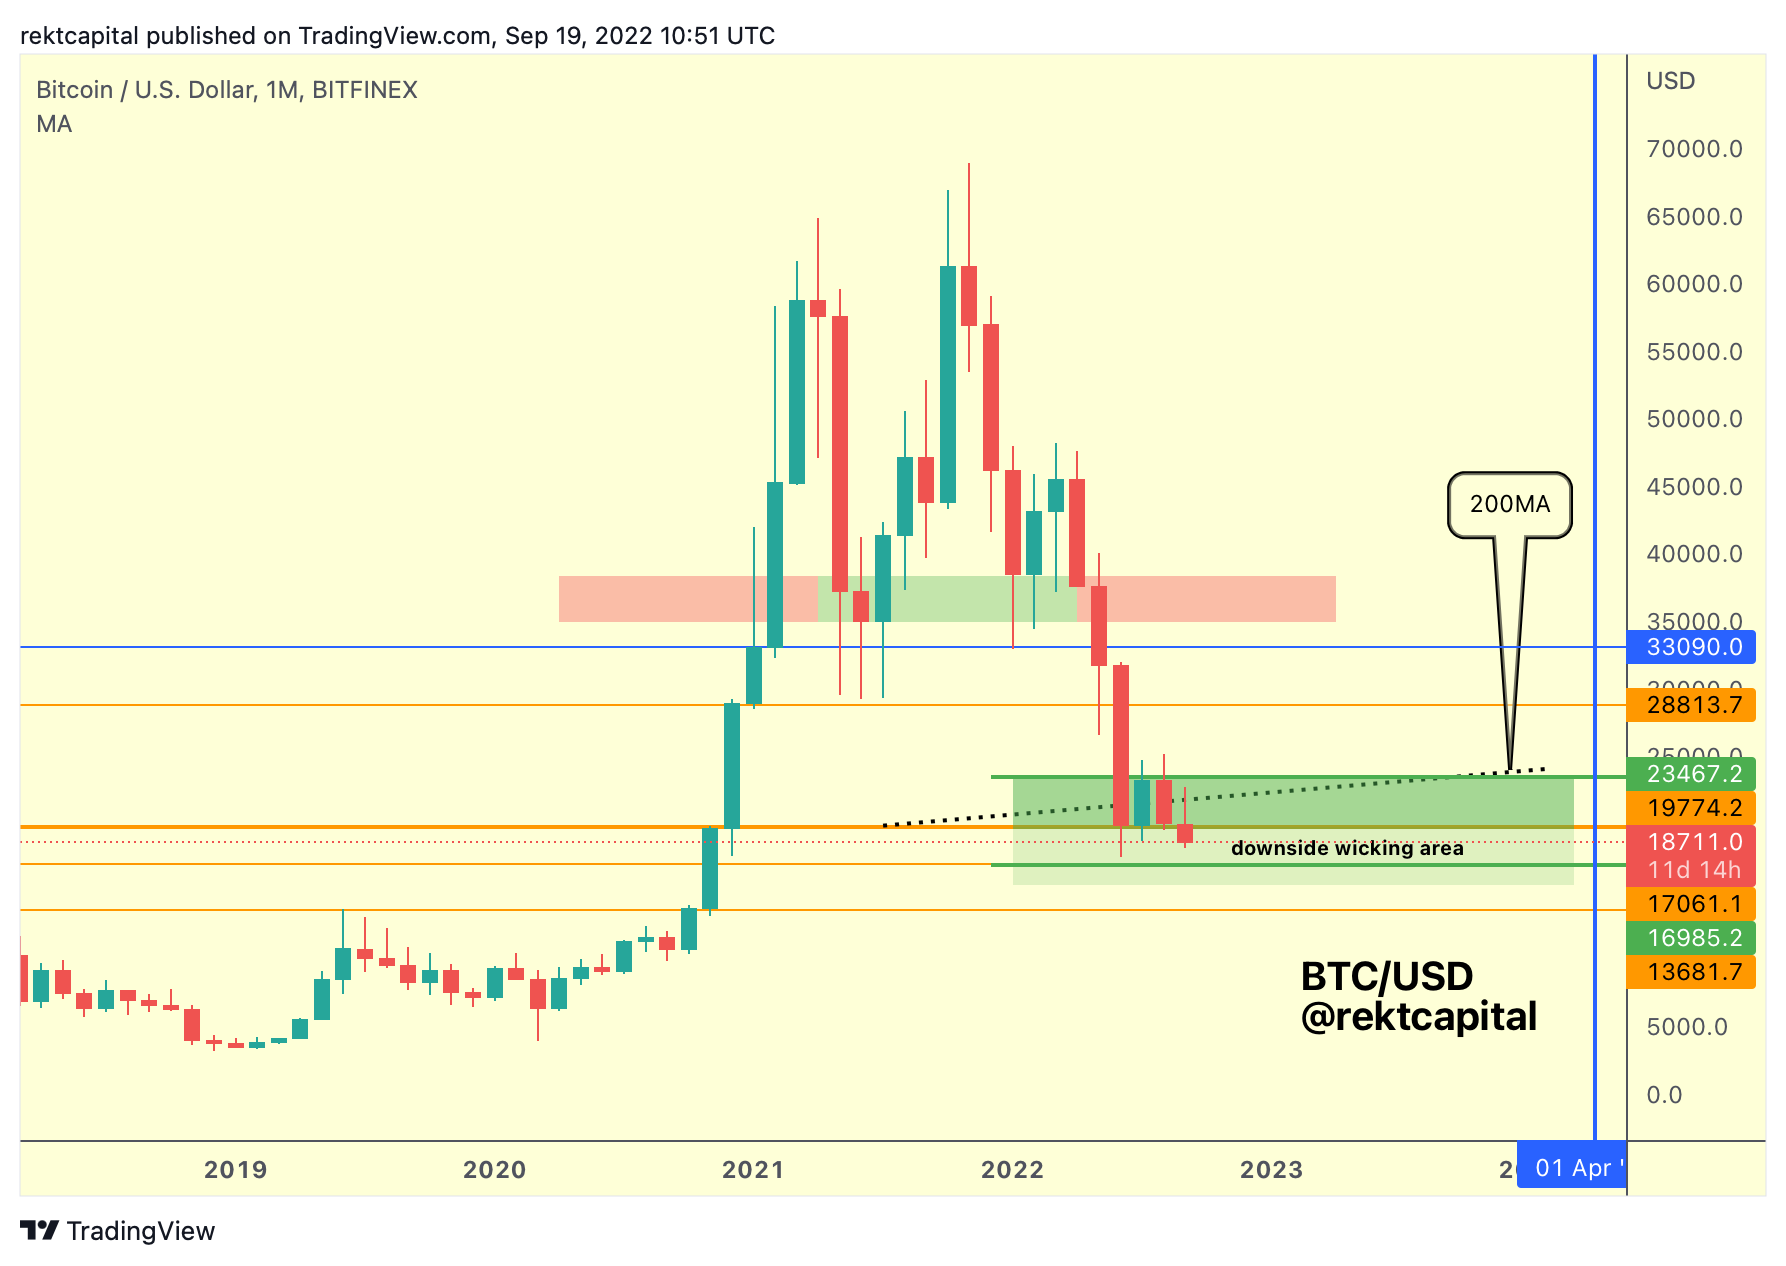
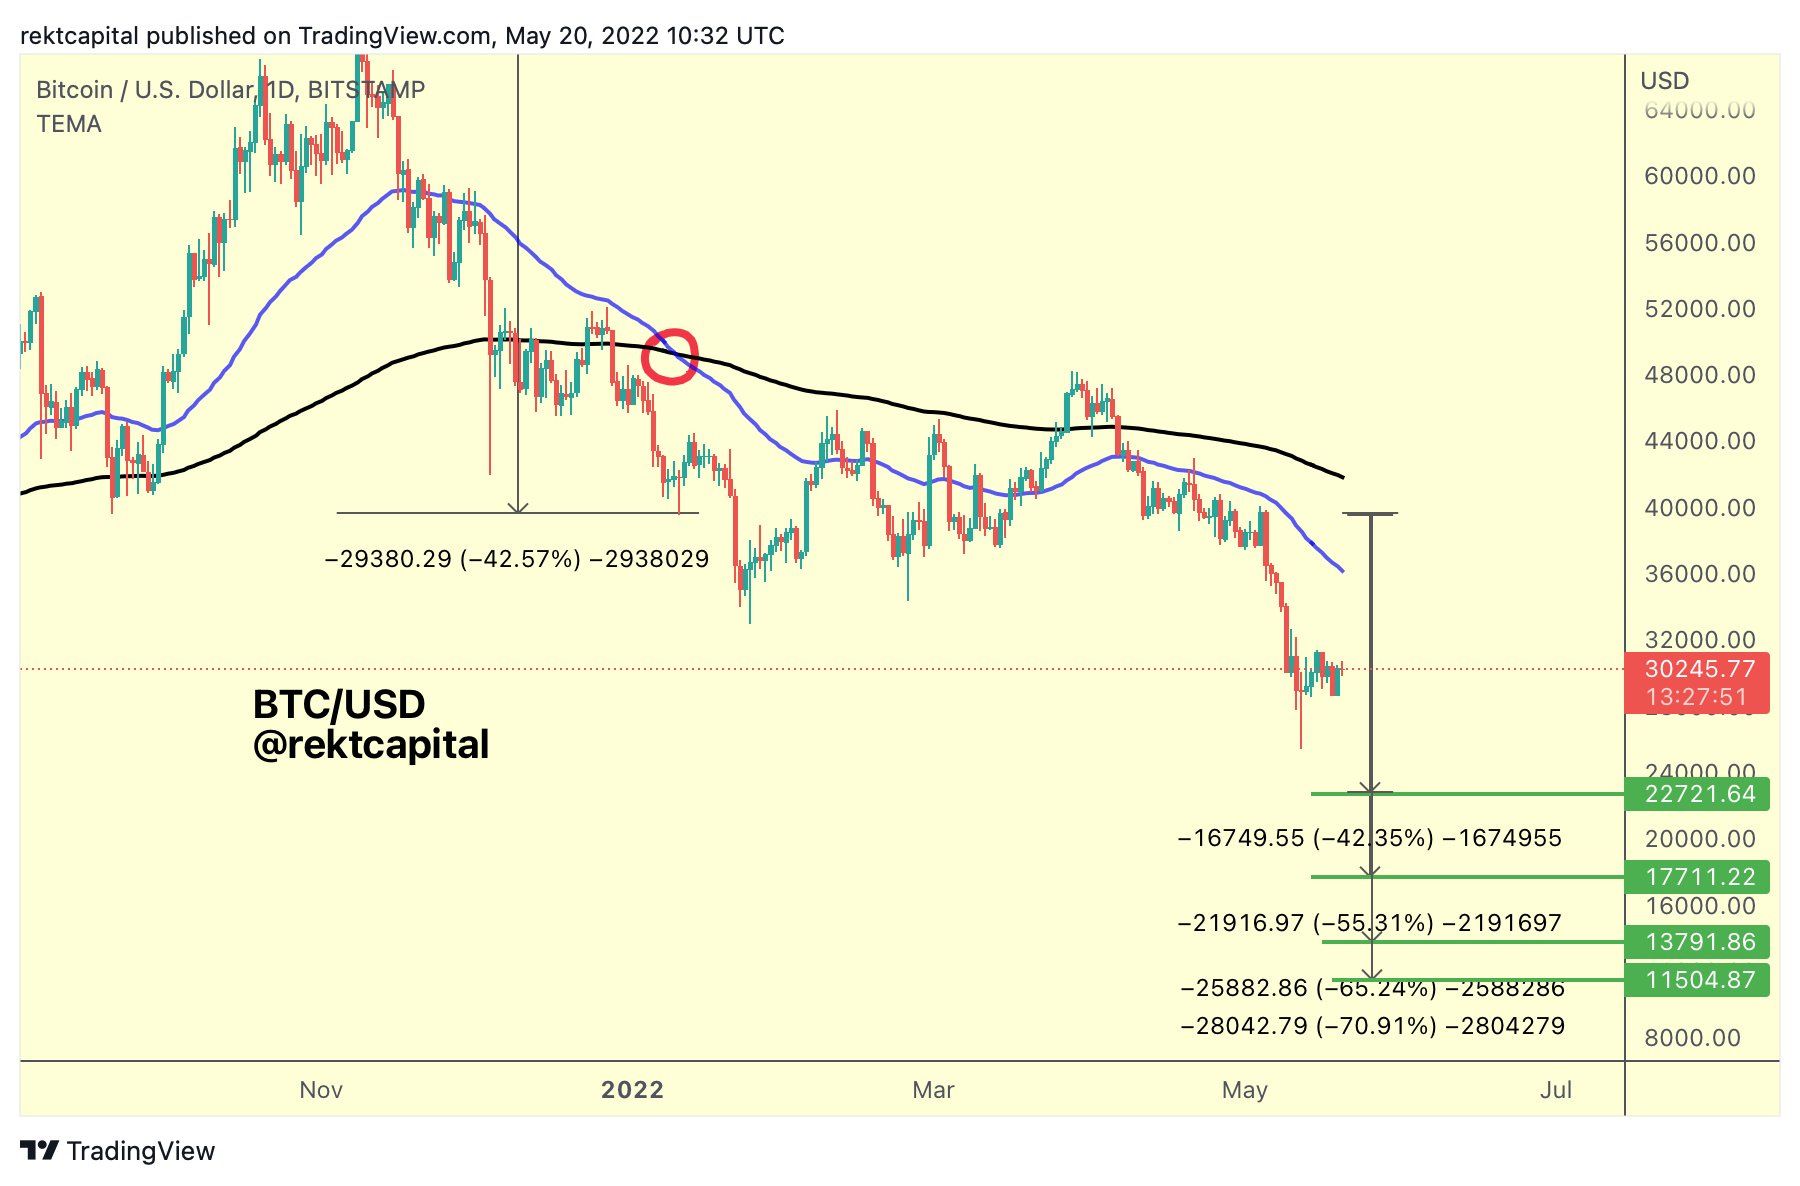
Historical Death Cross analysis suggests that BTC will form a bottom within this green area.
Of course, price is flipping the 200-week MA into new resistance and doing so with the psychological round level of $20K as well, then we’ll see price go deeper inside the box, where the most extreme scenario for downside could take price to as low as $11500, which would imply tremendous downside wicking below the $13900 Monthly support:

After all, historically post-Death Cross retracements have seen retracements range from -42% to -73%.
The -73% retrace occurred in 2013/2014, which of course raises questions regarding market cap size, liquidity, differences in institutional interest in those times compared to now; that is, could BTC retrace that deeply post-Death Cross just like in 2013?
The point isn’t to answer that question with a definitive yes or no, but rather consider historical scenarios and try to understand how they would impact price should history repeat and they play out again.