Time To Be Bearish On Bitcoin?
Full analysis
Welcome to the Rekt Capital newsletter, a place for people who want to better navigate the crypto markets with the help of cutting-edge crypto research and unbiased market analysis.
Bitcoin - Failed Retest Attempt
Bitcoin truly had an opportunity to flip macro bullish.
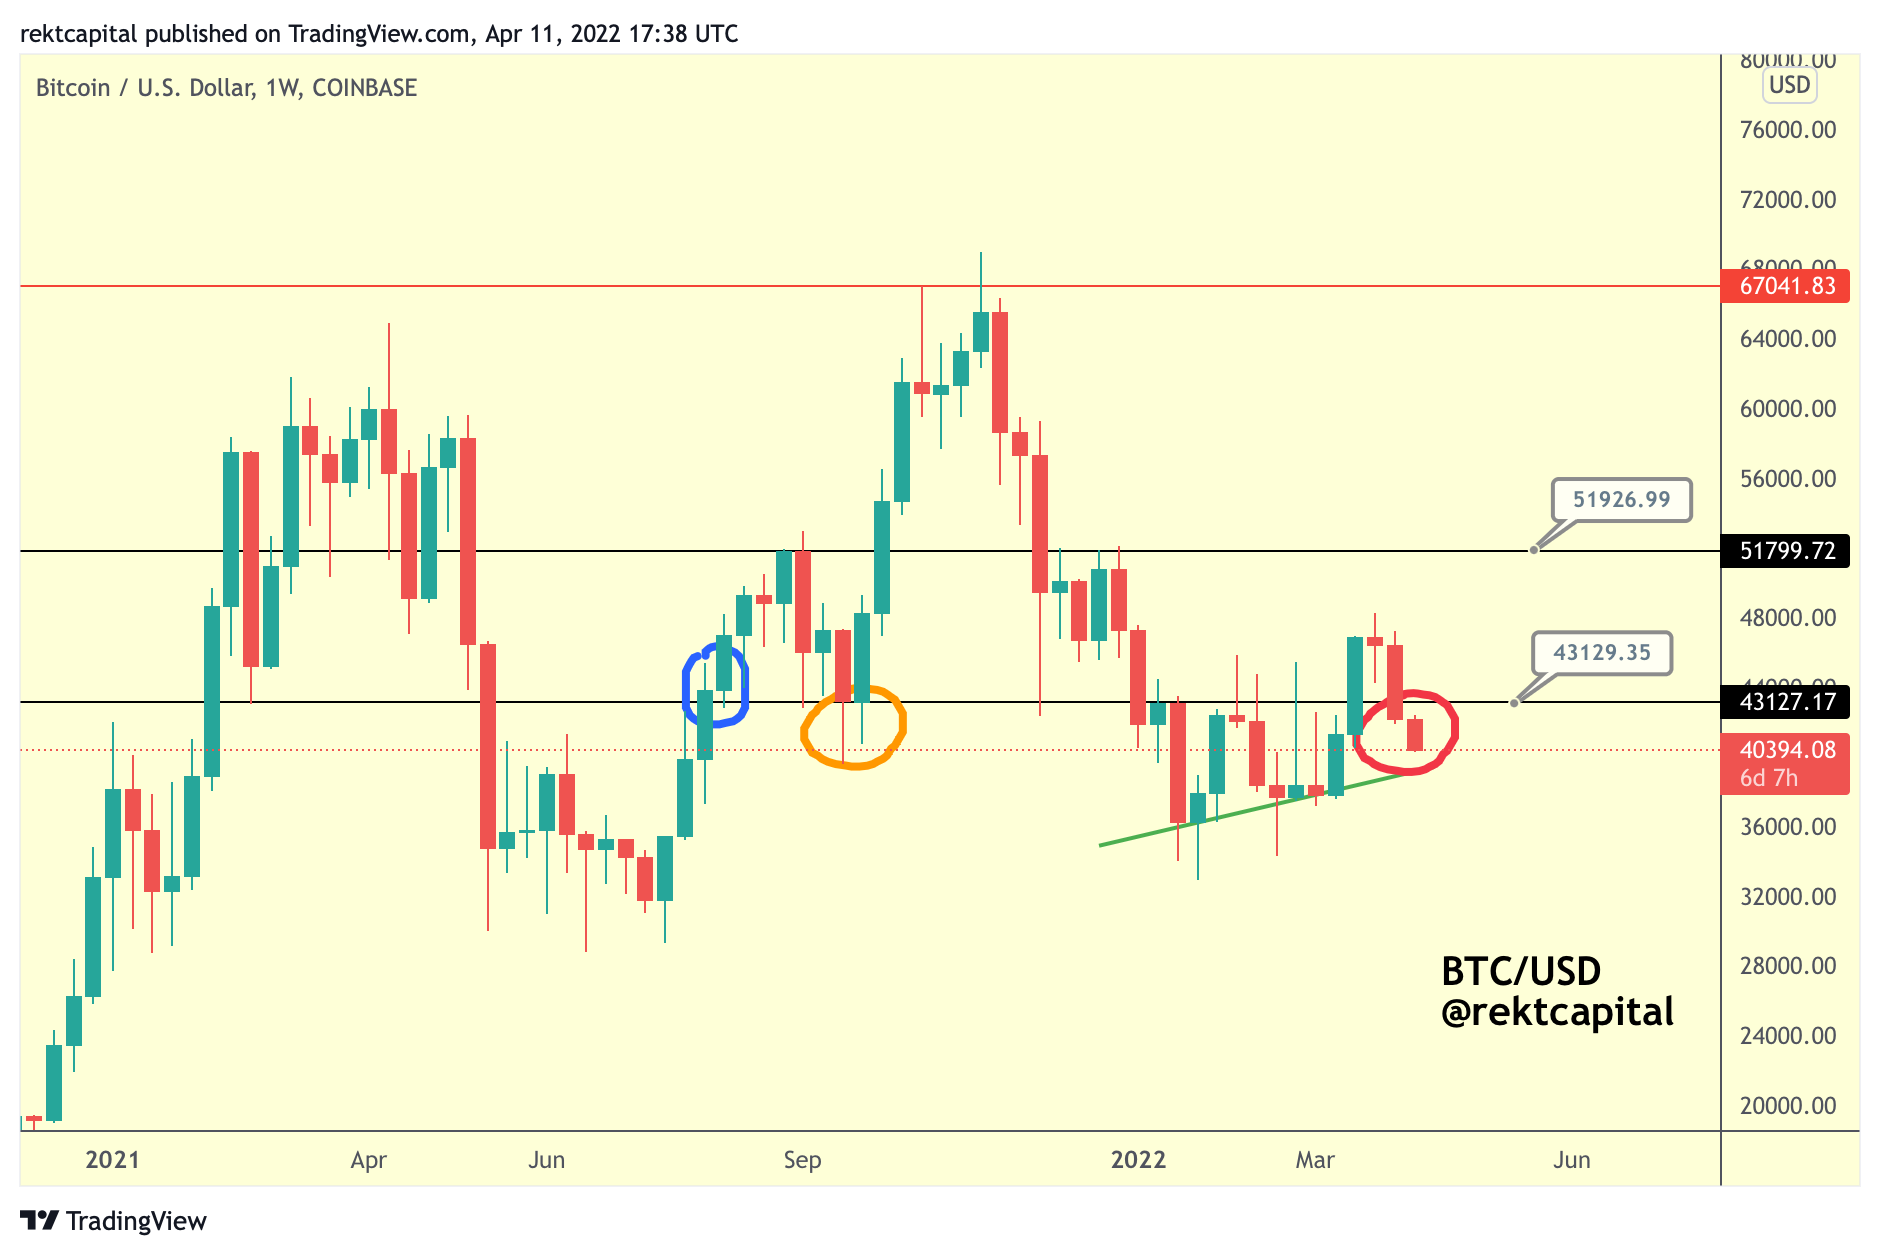
BTC broke out from the $38000-$43100 range, rallied to the mid-$40000s and pulled back into the $43100 for an apparent retest attempt.
However, BTC failed to retest this previous resistance of $43100 into new support because BTC Weekly Candle Closed sub $43100.
Since this Weekly Close, BTC has been declining.
Price has re-established itself inside the $38000-$43100 that BTC had broken out from just weeks prior.
The failed retest also means that price had failed to retest the Ascending Triangle price had broken out from:

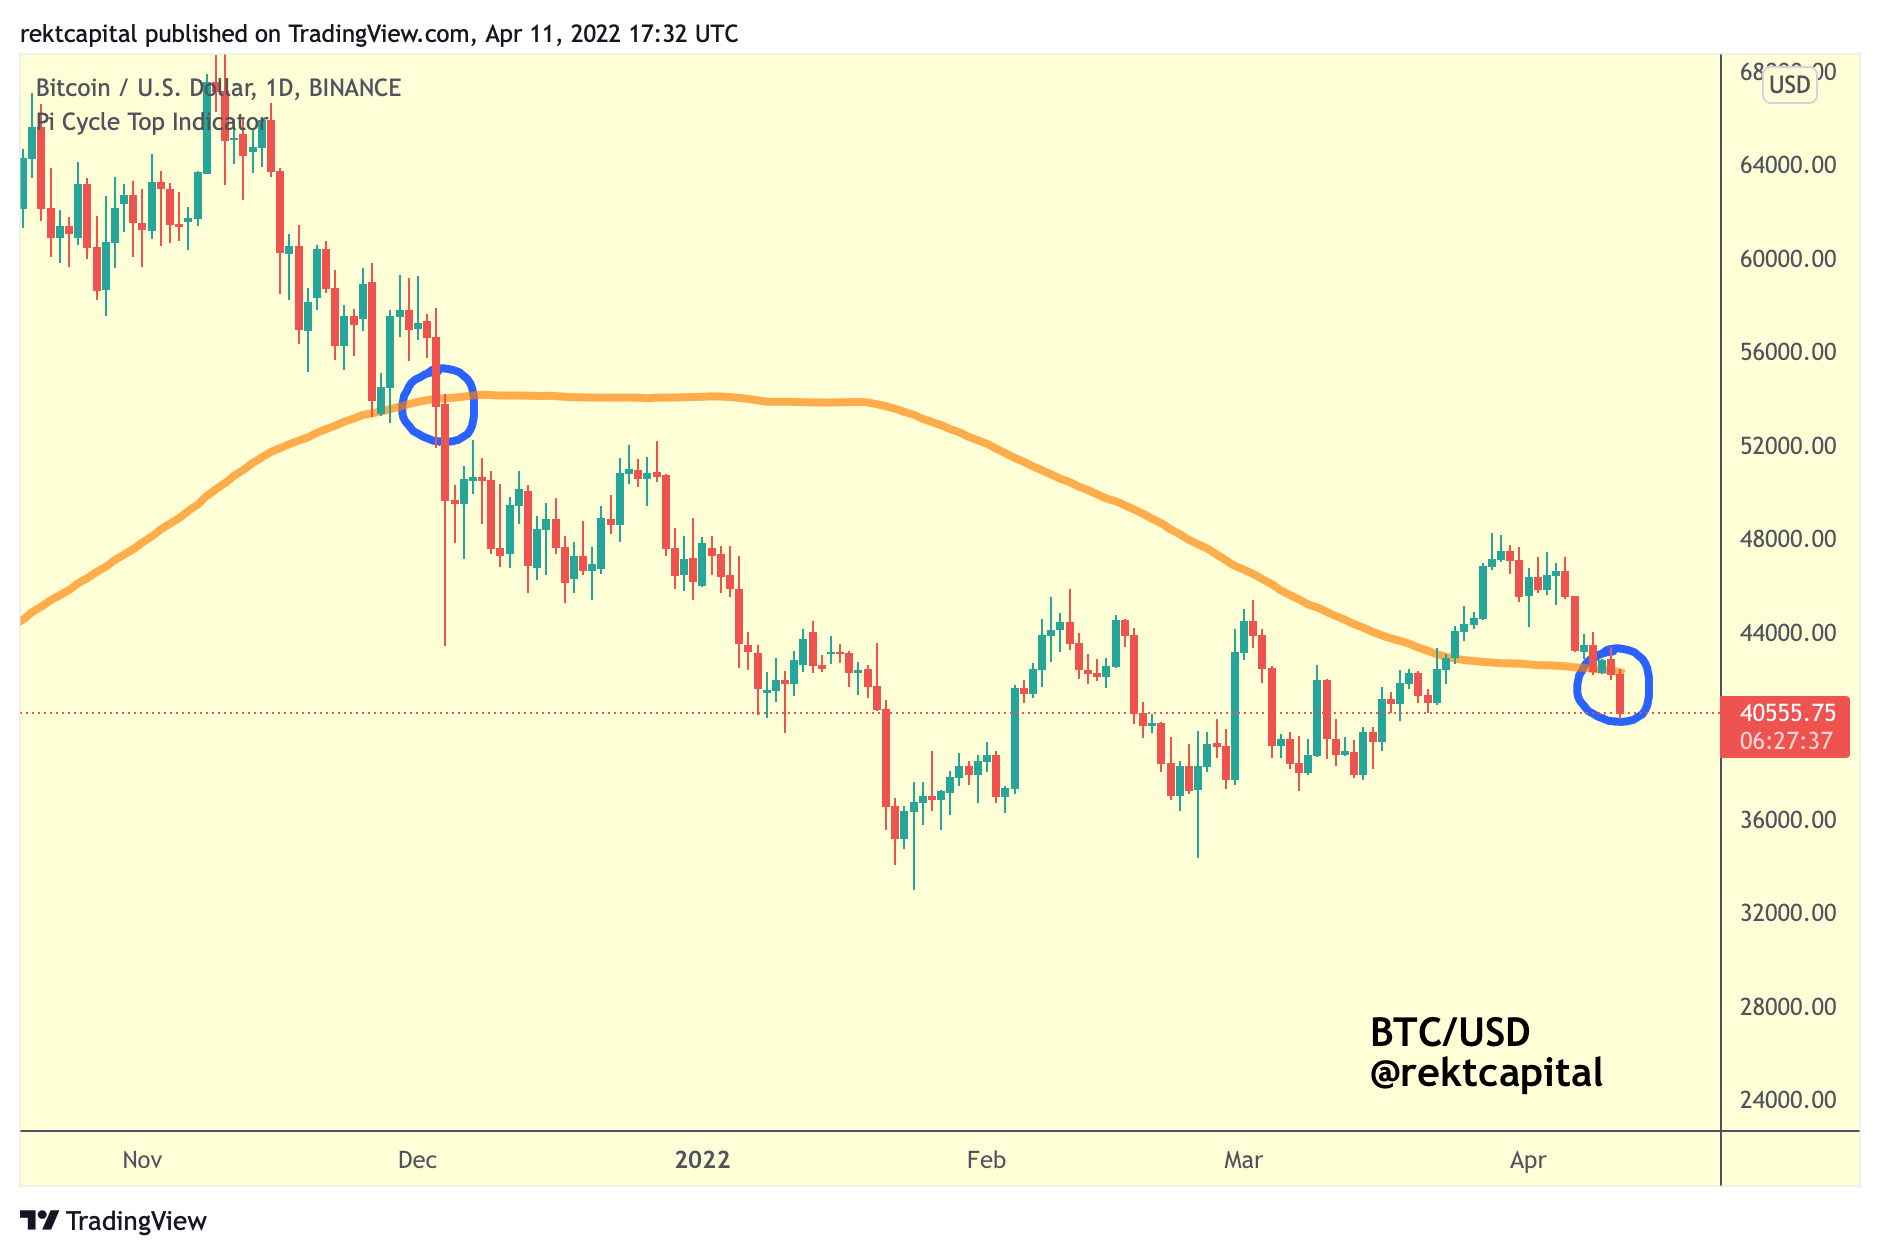
BTC also failed to retest the 111-day Pi Cycle MA as support:
And lastly - price failed to reclaim two key Bull Market EMAs as support, the green 21-week and blue 50-week EMAs:

All of these indicators were pointing to a confluent area for Bitcoin and price wasn’t able to flip this region into one of new support.
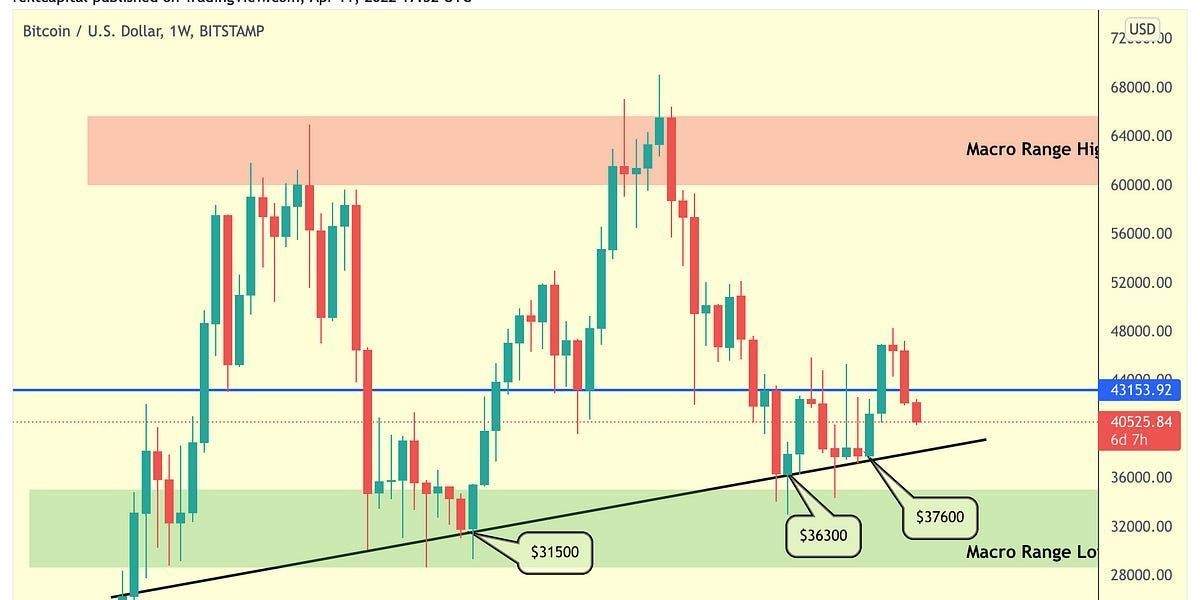
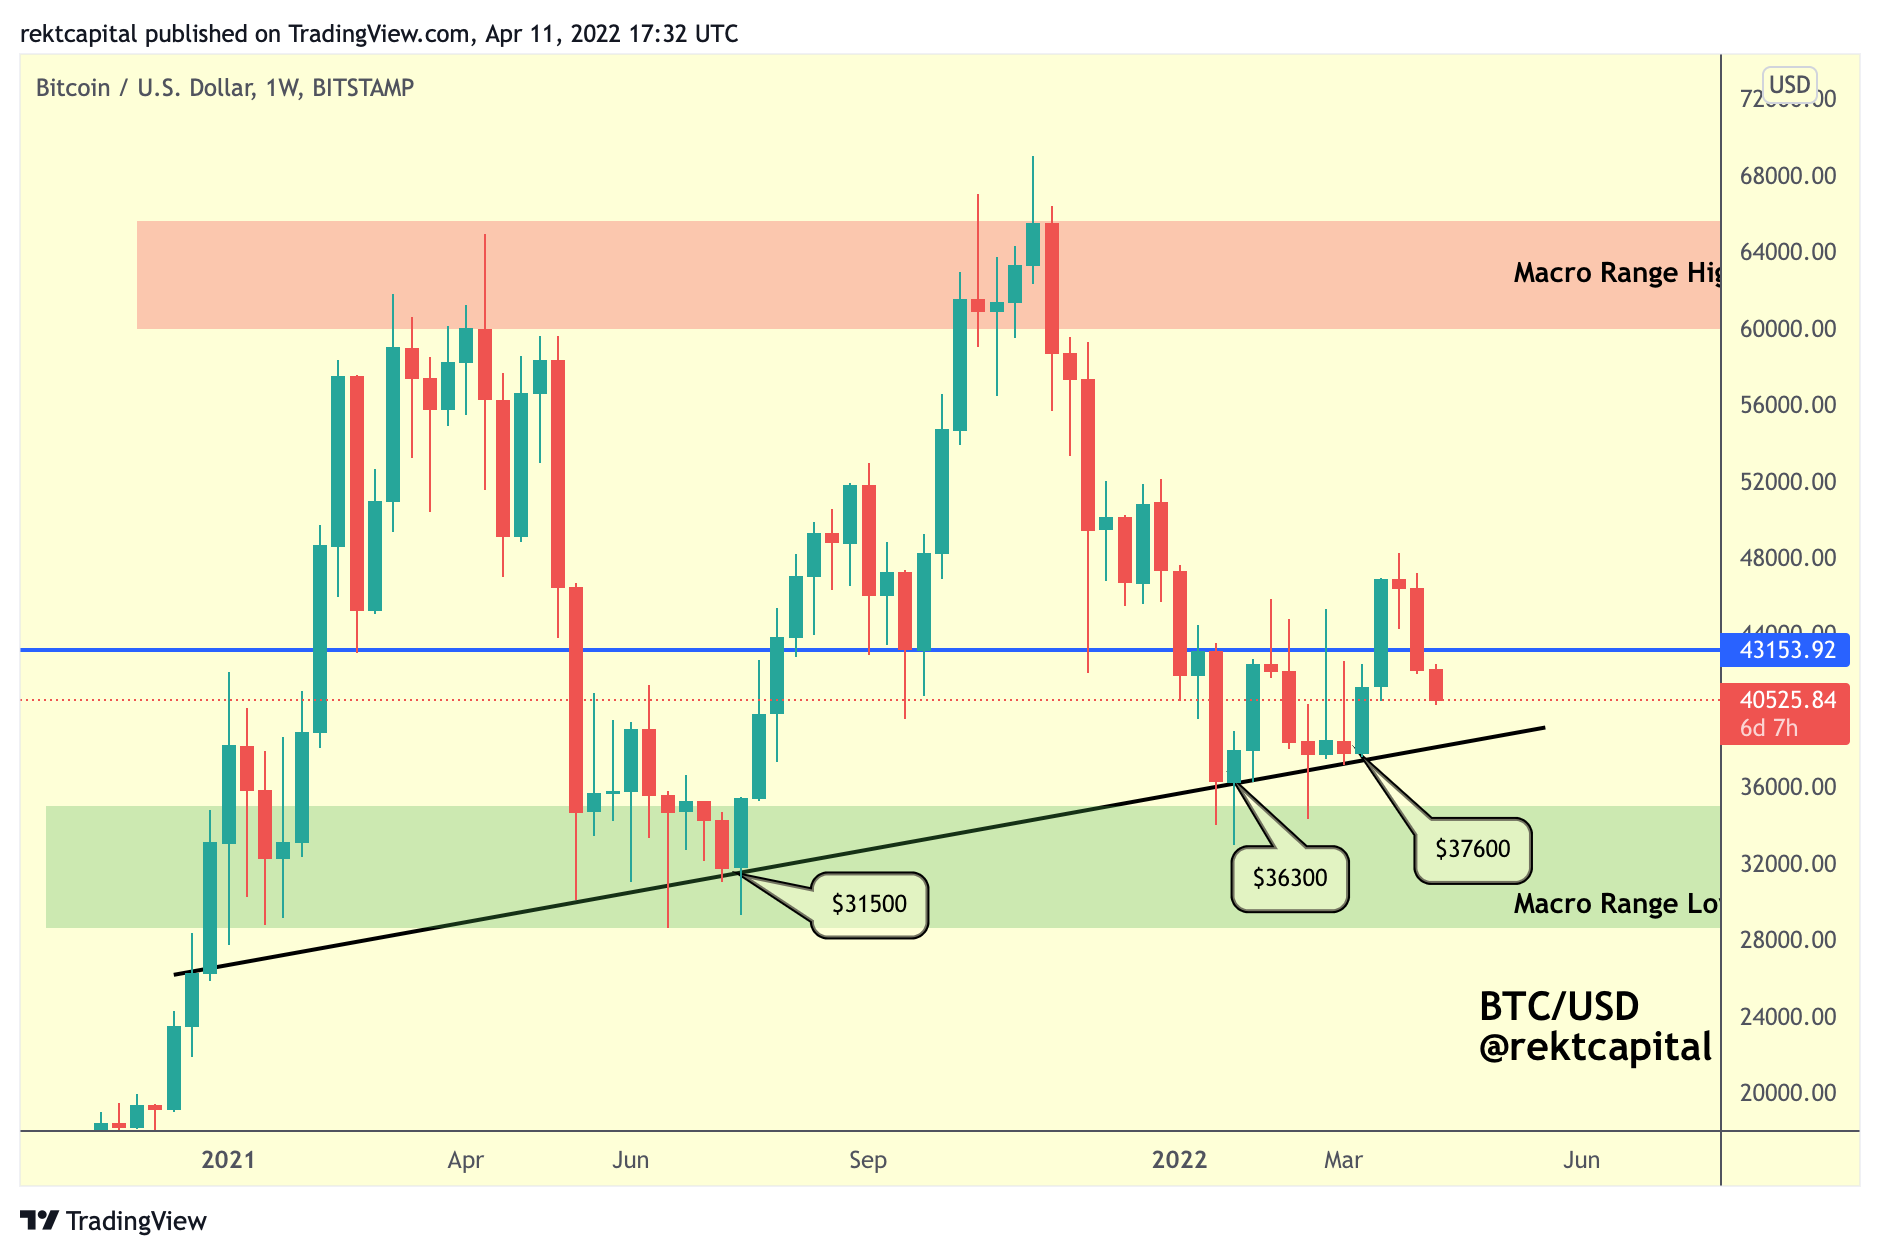
Now because BTC lost the $43100 level - the ~$38000 region could be revisited, mainly because that is where the price point denoting the macro black Higher Low resides:
Would losing this Higher Low signal the end of the Bull Market?
Technically, price is still inside a $28000-$69000 range.
And while the Higher Low is a valuable indicator of bull-side momentum, the main region to signal the end of a Bull Market would be the loss of the green macro Range Low at $28000.
Because at this time, it can be argued that price is in a Re-Accumulation Range but losing the green Range Low area would actually speak more to a Distribution Range.