The Bitcoin Retrace
Where could Bitcoin go on this retrace?
Welcome to the Rekt Capital newsletter, a resource for investors who want to better navigate the crypto markets with the help of cutting-edge crypto research and unbiased market analysis.
This free edition of the Rekt Capital newsletter is brought to you by… Ember Fund

There has been an explosion of powerful decentralized finance (DeFi) products but investing, managing, and understanding them continues to be difficult.
Ember changes this.
Ember aims to be the easiest place to invest, learn, and participate in the upside of DeFi, NFTs and the broader crypto space through institutional grade strategies.
Invest in a portfolio and join the 60,000 investors around the world who have transacted over $500M on their platform.
Sign up today and earn Bitcoin by learning about crypto daily:
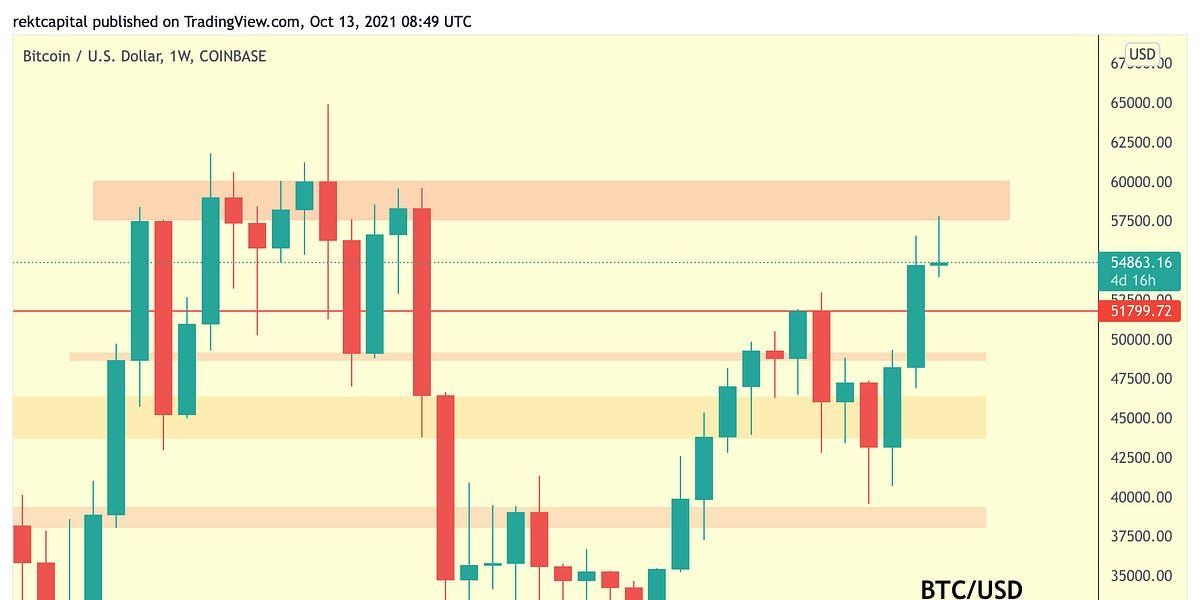
Bitcoin Rejects From Major Resistance
Most recently, Bitcoin rejected from its major Weekly resistance.
This is the fifth time in history that Bitcoin has rejected here.
That being said, how many more times can a resistance continue to reject price when revisited?
An argument can be made about this supply area potentially weakening.
And the way to spot this weakness would be to observe how this pullback unfolds.
Specifically - will Bitcoin retrace less after this latest rejection compared to how it had rejected before?
To answer this question, we need to take a look at the retracements that were kickstarted by this major resistance area:
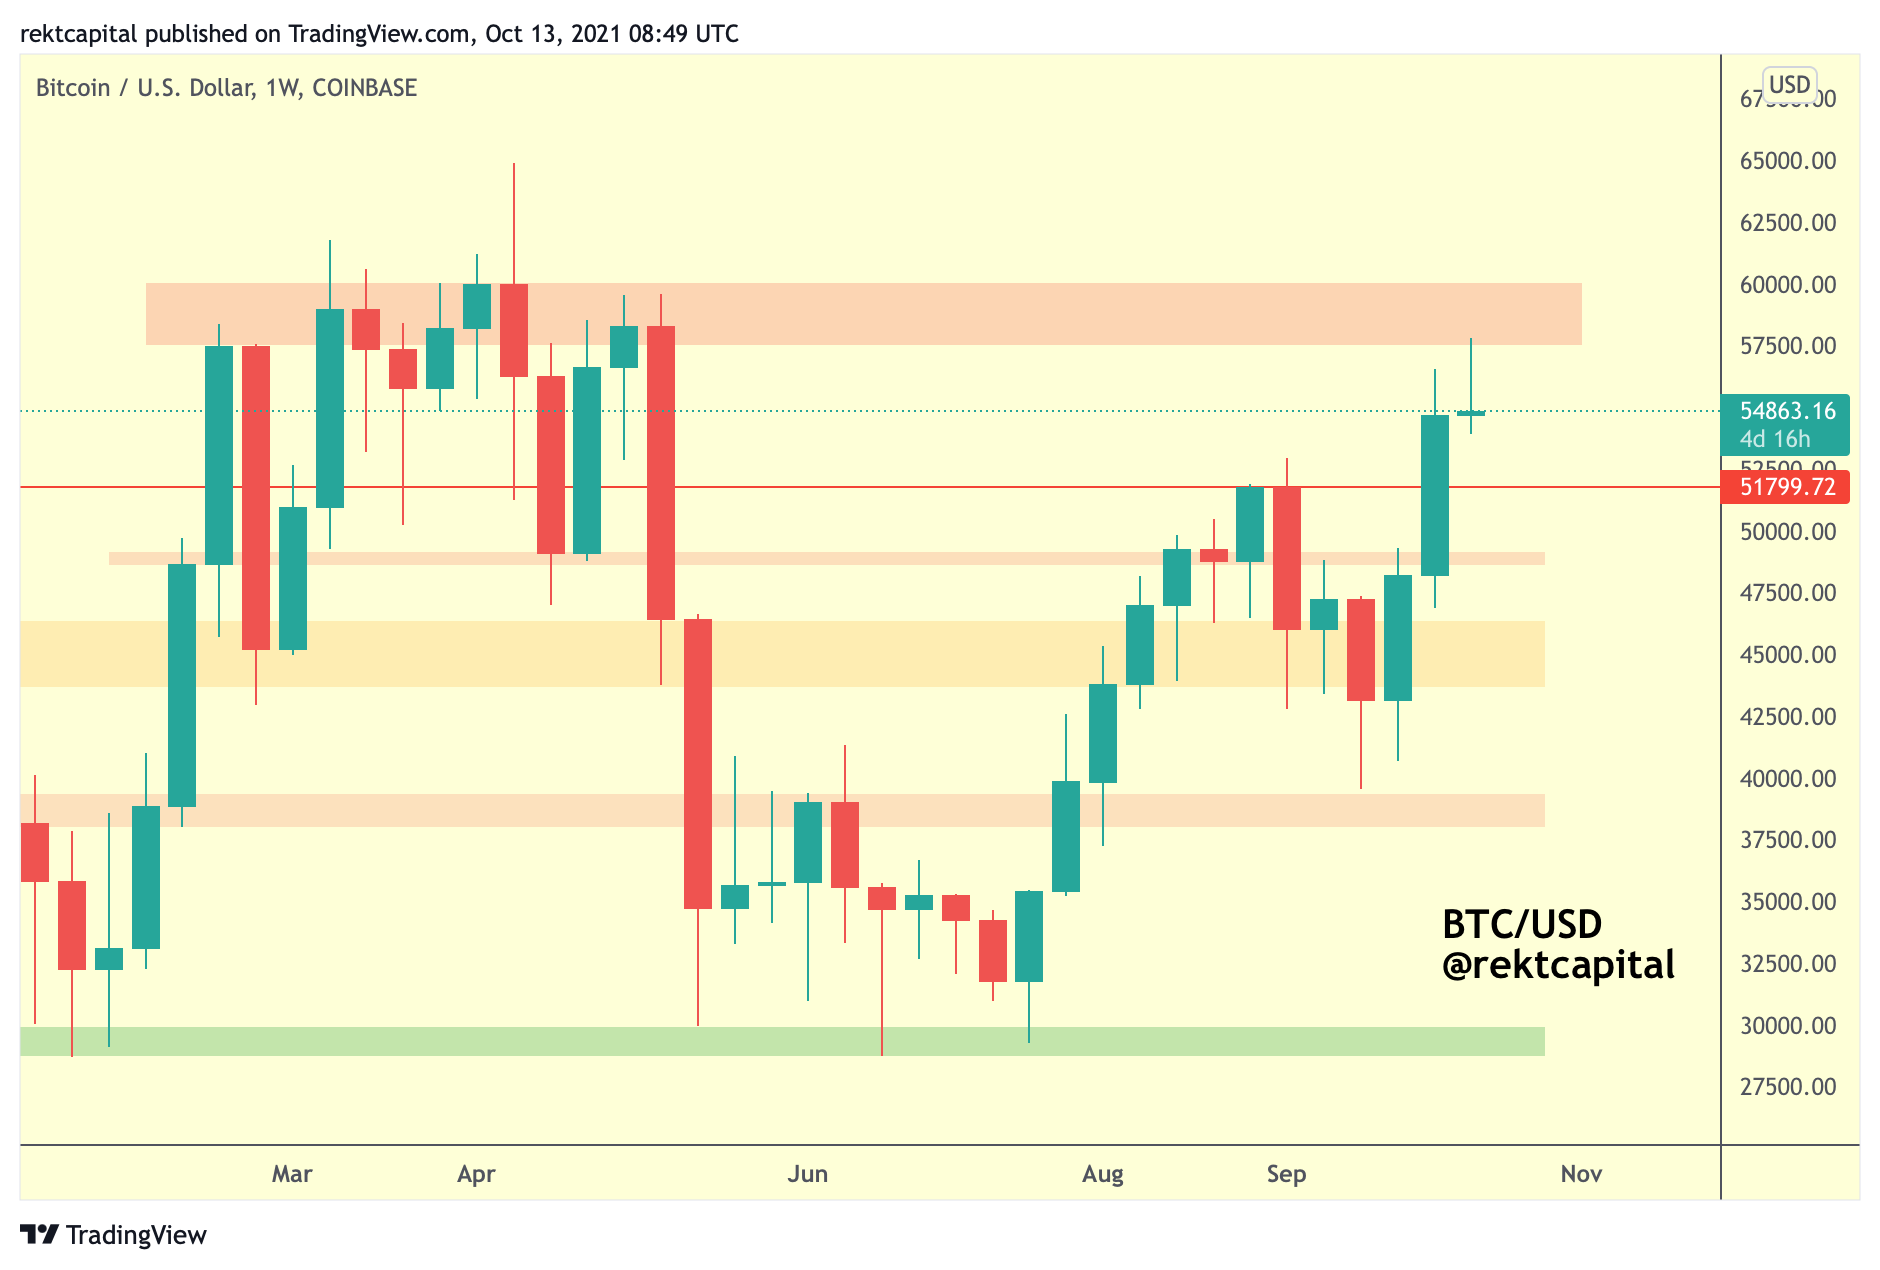
Historical Rejections From Major Resistance
The first rejection from the red major resistance area in February preceded a -26% retrace.
The second rejection spawned a -18% pullback.
The third retrace occurred after Bitcoin overextended beyond the resistance area but nonetheless registered a -27% correction.
And the fourth rejection led to a -52% crash.
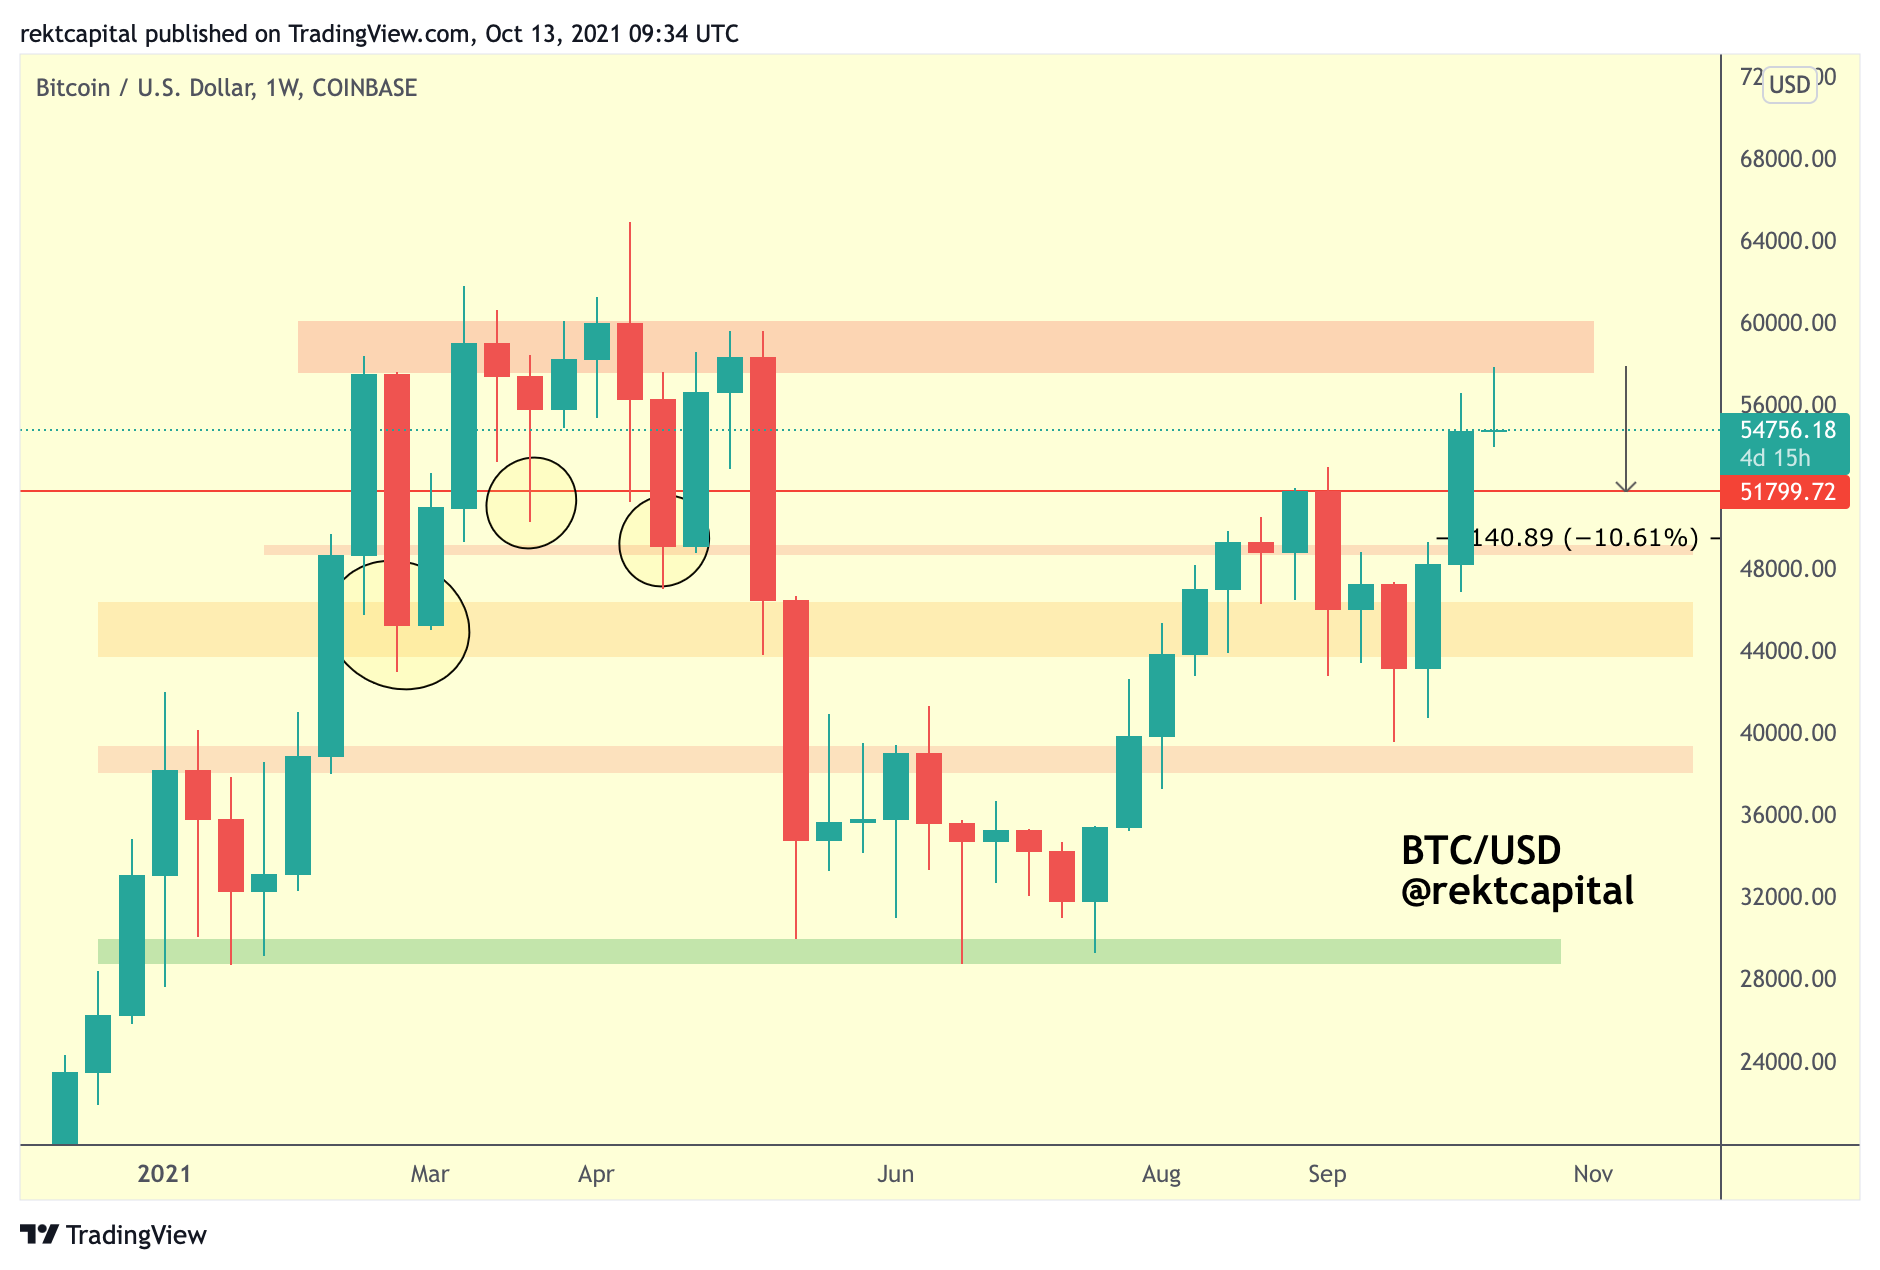
If Bitcoin only retraces to its next Weekly support levels (e.g. ~$52800 or ~$49000) then that would constitute a -10% to -15% pullback, which would be shallower than previous retracements caused by the major red resistance area:
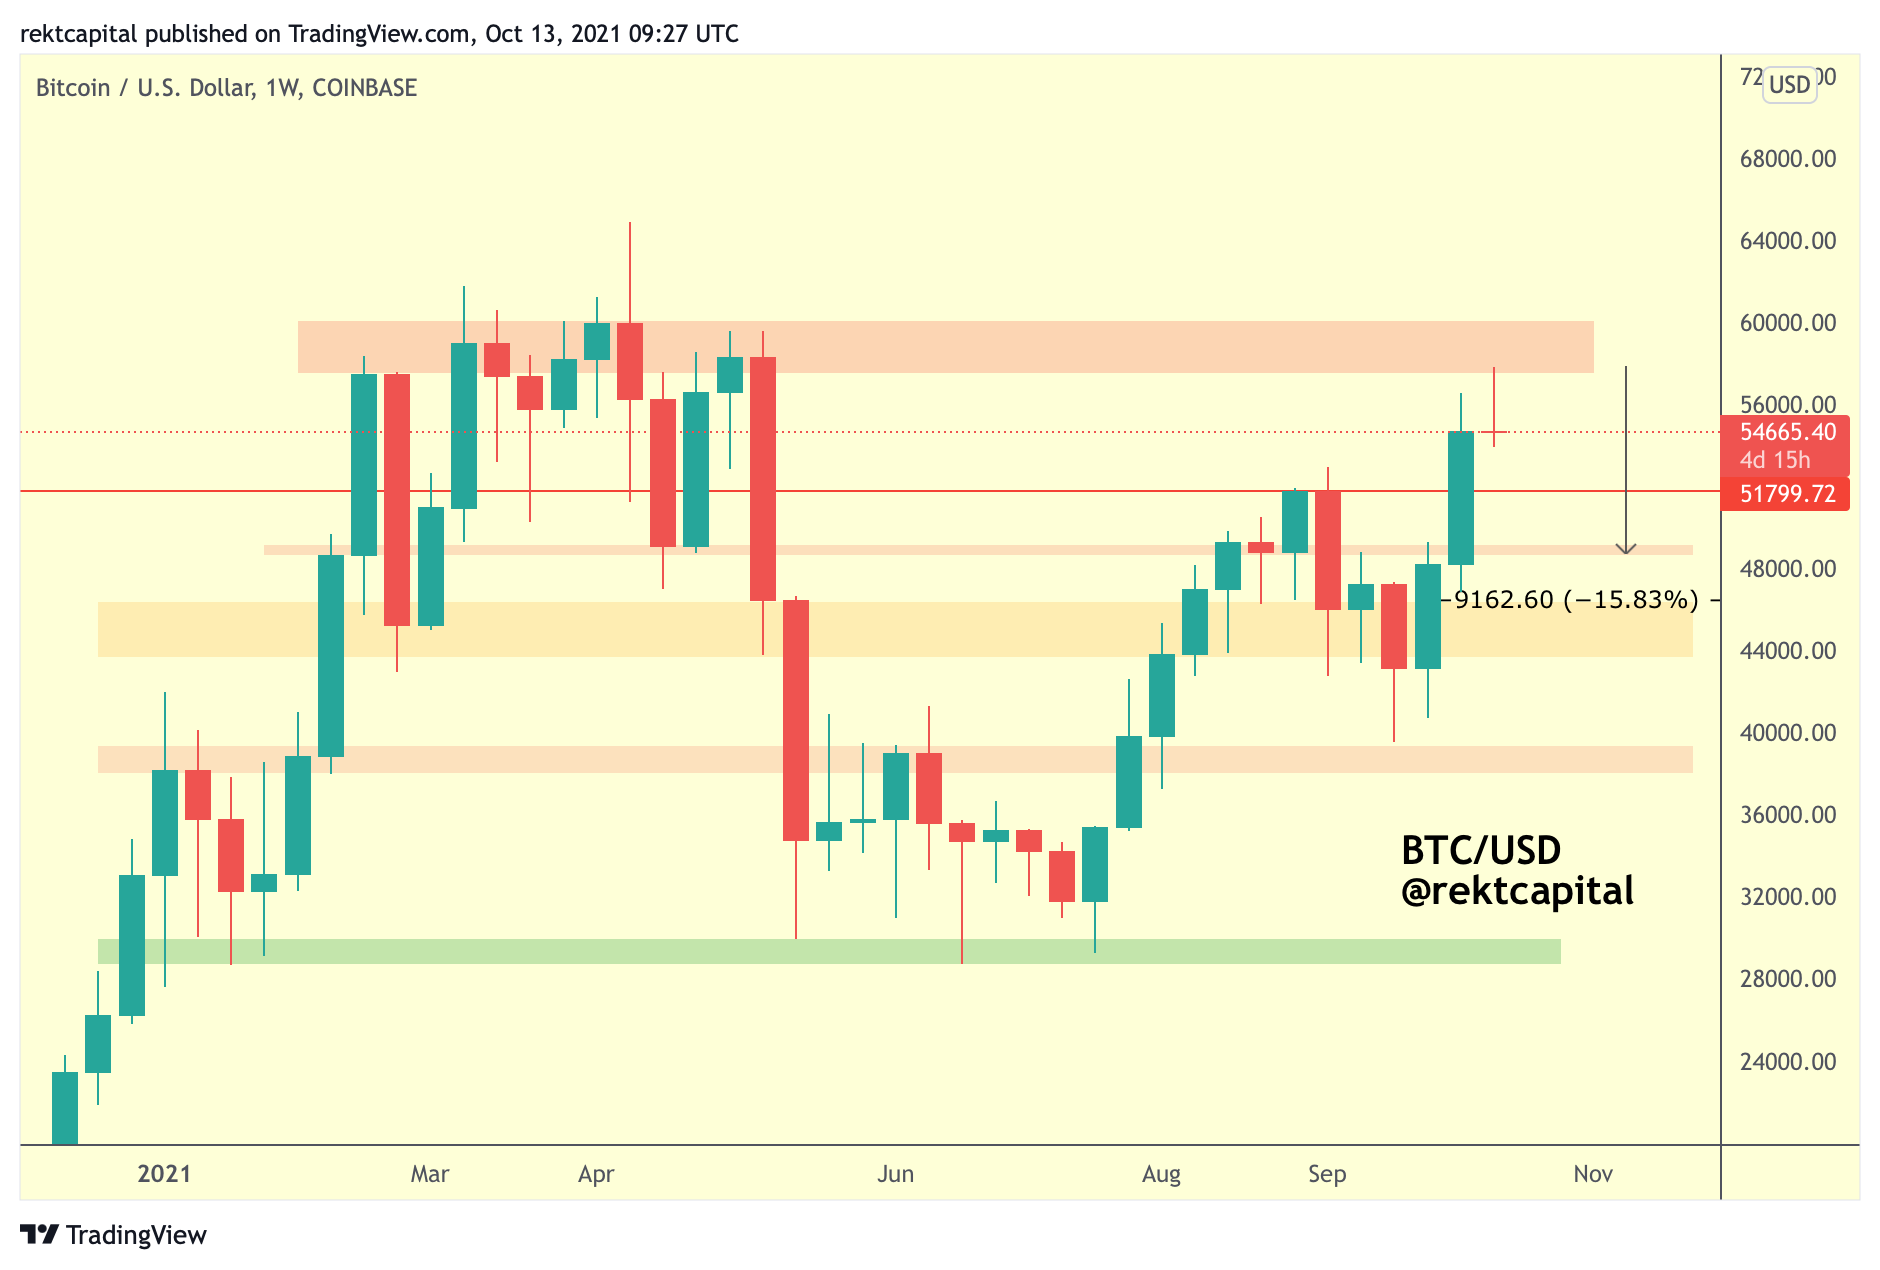
Should such a shallow pullback take place before a Bitcoin recovery, then a good case for a weakening resistance could be made.
Where Has Bitcoin Rebounded From On Similar Rejections?

Following similar previous rejections, Bitcoin would rebound either from:
- The red horizontal (~$51,200) or,
- The small red boxed area (~$49,000),
- The orange demand area ($43,700-$46,500).
If Bitcoin were to bottom at the red horizontal (~$51,200) then BTC would only need to retrace -10%:
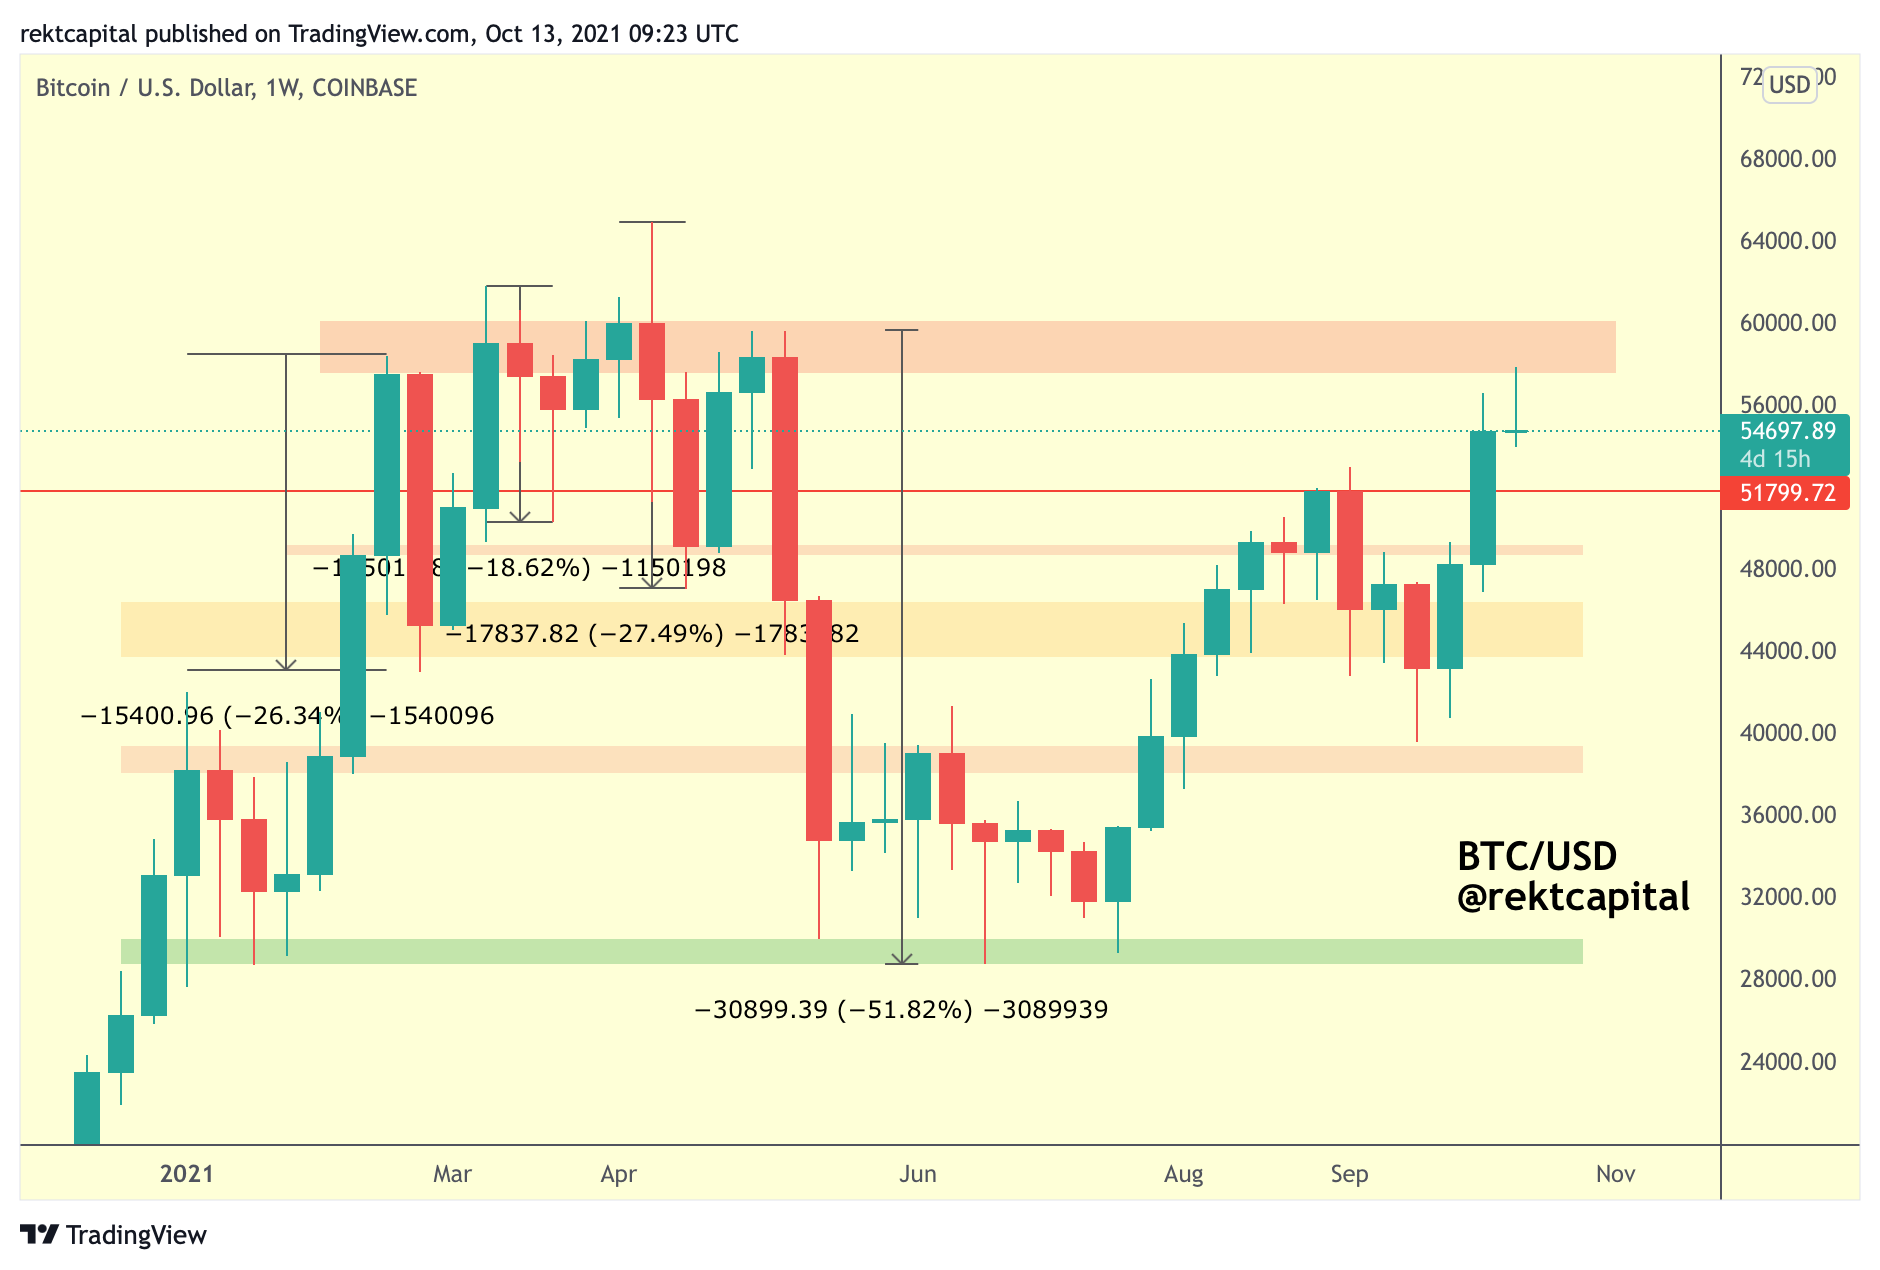
If Bitcoin were to bottom at the small red boxed area (~$49,000) then BTC would only need to retrace around -16%:

If Bitcoin were to bottom at the orange demand area ($43,700-$46,500), then BTC would need to retrace around -25%:
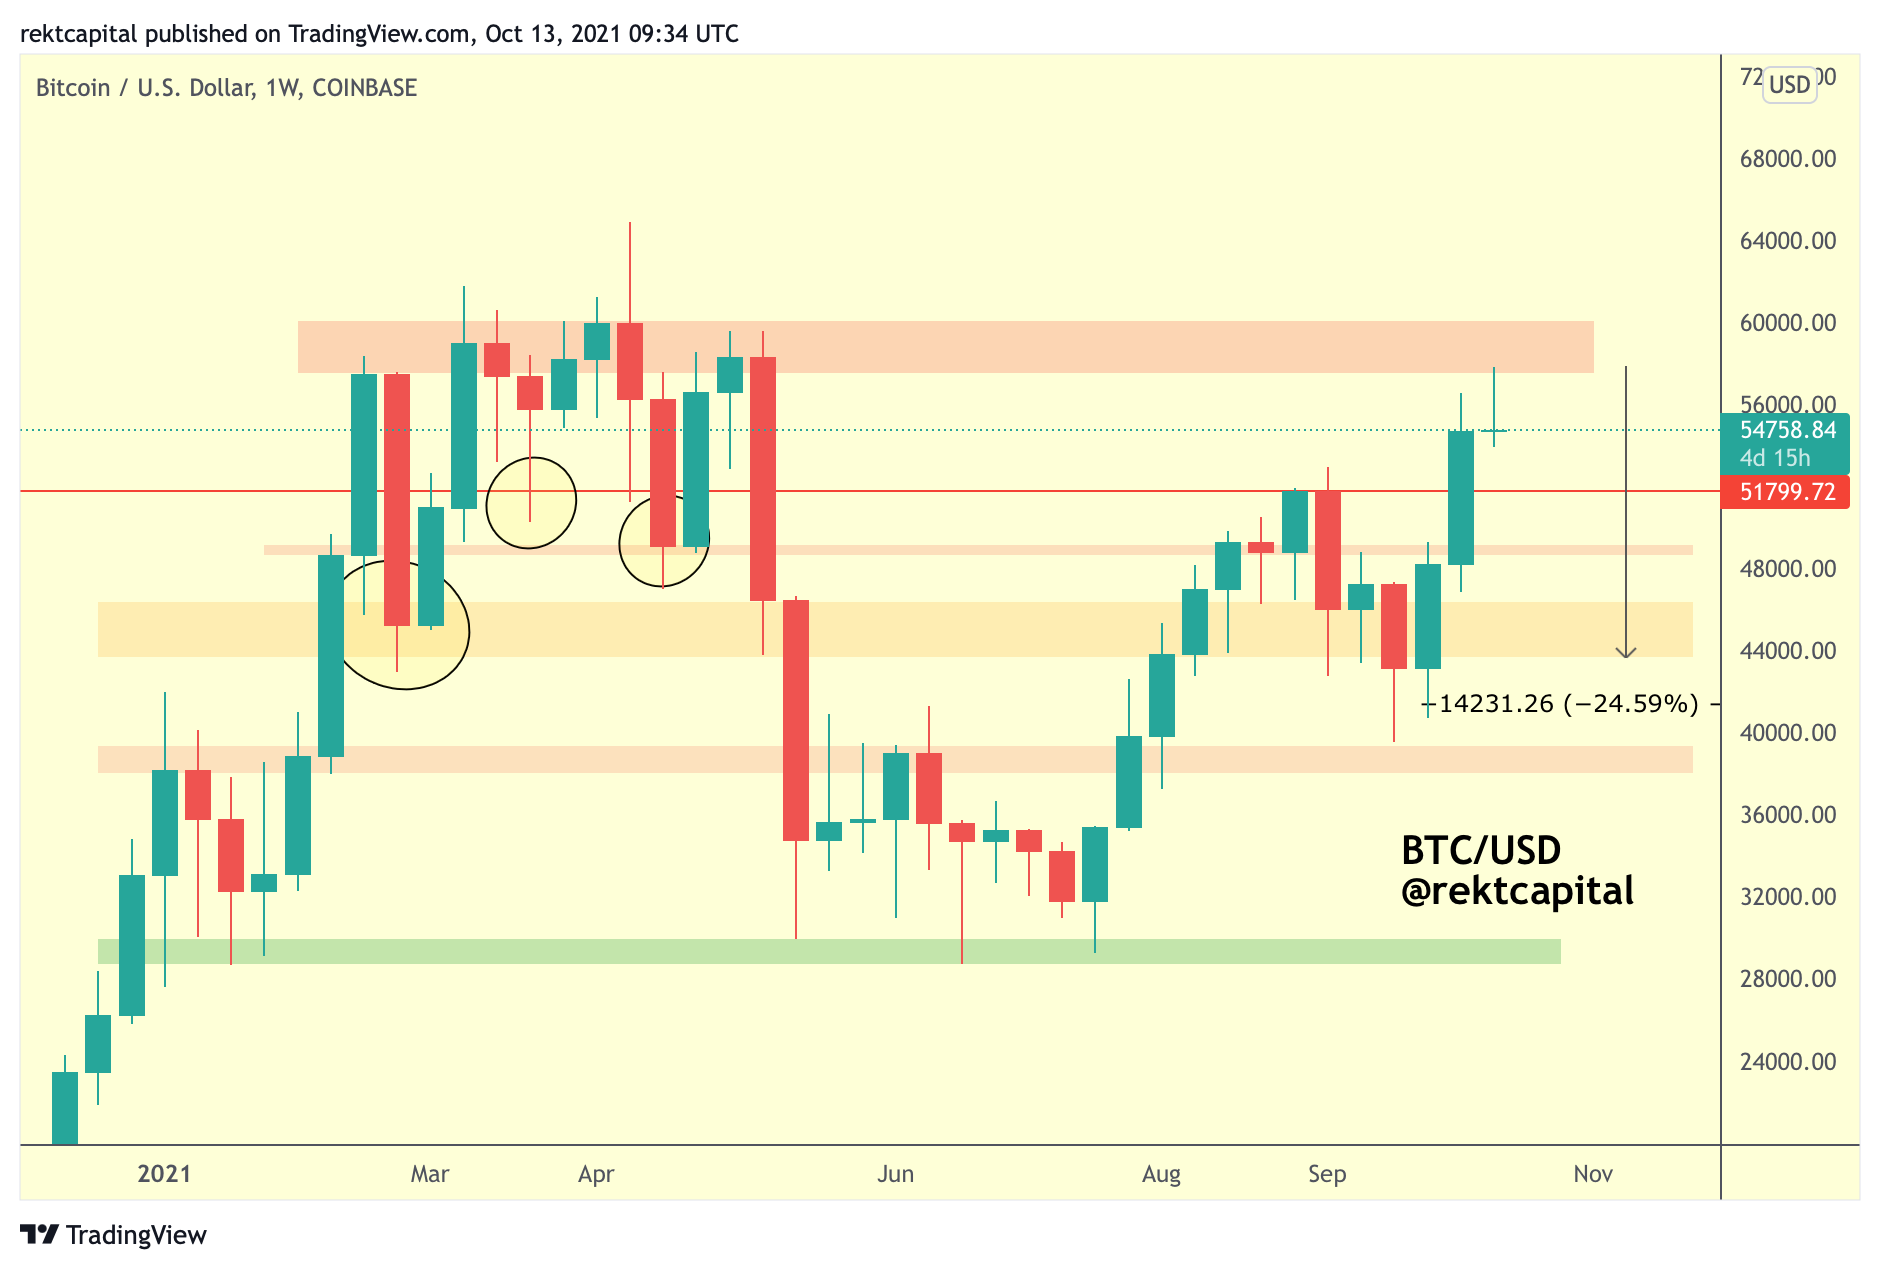
While a -26% retracement would theoretically be a normal one by standards of history at these price regions, it wouldn’t support the argument of the major resistance area weakening.
However, the -10 or -15% retracement would certainly satisfy the narrative of a weakening major resistance area, which would mean BTC would retrace to around the $49,000-$51,200 area.
This has confluence with the multi-month macro structure that Bitcoin broke out from last week:
The Bitcoin Macro Downtrend Is Over
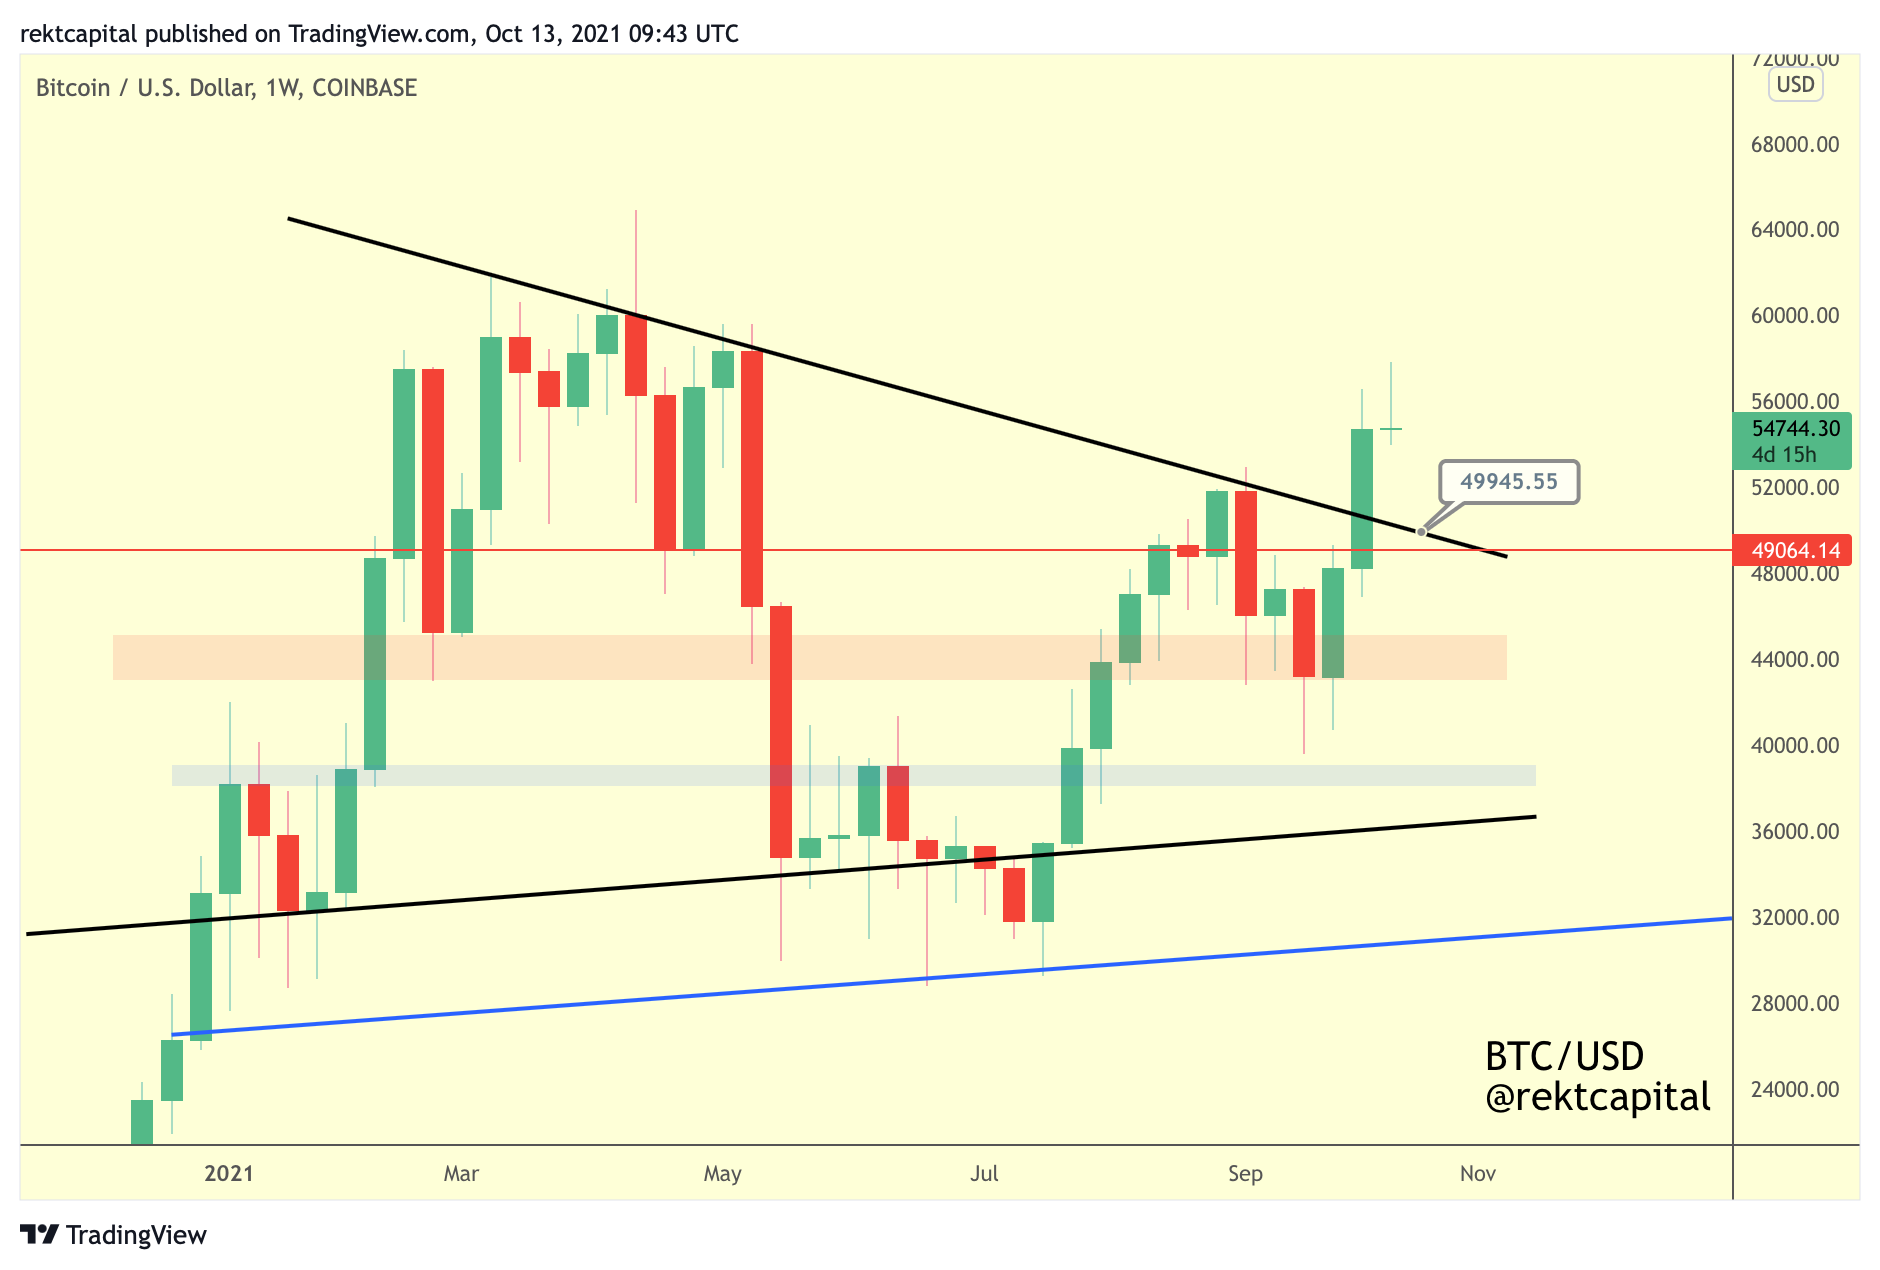
Last week’s breakout beyond the black diagonal trendline resistance means that the macro multi-month downtrend is over for Bitcoin and that a new uptrend will soon emerge.
That said, when trend lines like this breach, it isn’t out of the ordinary for price to pullback towards them for a retest attempt whereby BTC turns a previous resistance into a new support.
A successful retest attempt there would confirm the breakout and enable trend continuation into a new macro uptrend.
This retest attempt would take place at the ~$50000 area, which is an approximately confluent area of support with the aforementioned $49,000-$51,200 demand area.
All in all, market cycle analysis suggests that the downside is limited for Bitcoin in the month of October and that price will try to Monthly Candle Close above ~$55200 to preserve historical mid-cycle price tendencies in an effort to break out to new highs over the coming weeks and months.
Thank you for reading this free edition of the Rekt Capital newsletter.
If you enjoyed this edition - I guarantee you’ll love the Rekt Capital newsletter. Feel free to Subscribe today for only $12 a month: