Is The Bitcoin Bull Market About To Resume?
A level-headed analysis
Welcome to the Rekt Capital newsletter, a resource for investors who want to better navigate the crypto markets with the help of cutting-edge crypto research and unbiased market analysis.
This Friday, I’ll chart your Altcoin picks in an exclusive subscriber-only TA newsletter and will cover as many as I can. So if you’d like to have an Altcoin charted, feel free to share max. two TA requests each in the comments below.
I’ll chart the Altcoins that get mentioned and ‘Liked’ the most. Let’s dive straight into today’s market analysis.
Bitcoin Macro Perspective
Hello and welcome back to the Rekt Capital Newsletter. I hope you’ve had a wonderful, restful Easter holiday weekend.
In today’s edition of the RC Newsletter, we’ll be discussing my macro perspective on Bitcoin.
I’ll share my thoughts through the lens of the Ichimoku Cloud, Bitcoin’s log growth curves, Bull Market EMAs, Volume Profile, and finally - Bollinger Bands.
Throughout the newsletter, it’ll become clear that some levels are key reference points for price as they see tremendous confluence across different types of analyses.
Let’s dive in.
Bitcoin Ichimoku Cloud View
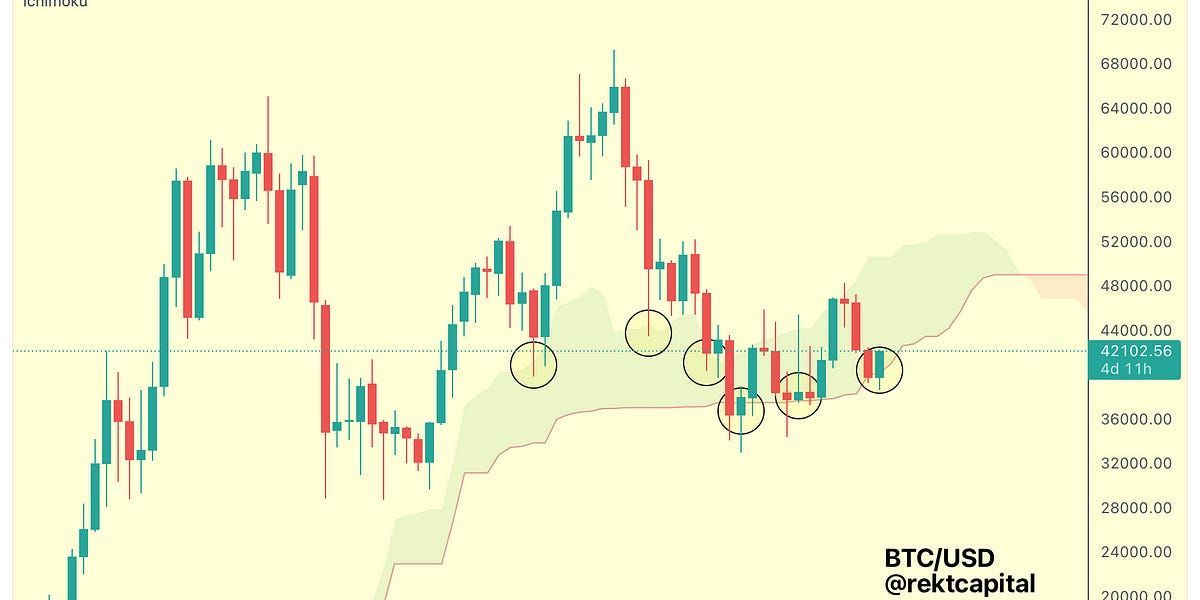
Here’s a very simple way of thinking about Bitcoin’s current price predicament.
It is located within the Ichimoku Cloud (green area).
This Cloud acts as a dynamic support and resistance.
In other words, the bottom of the Cloud acts as support and the top acts as resistance.
Notice how BTC tends to fake-breakdown or downside wick below the Cloud, but nonetheless does so at a Higher Low.
After all - the Cloud is inclining over time, hence a dynamic support.
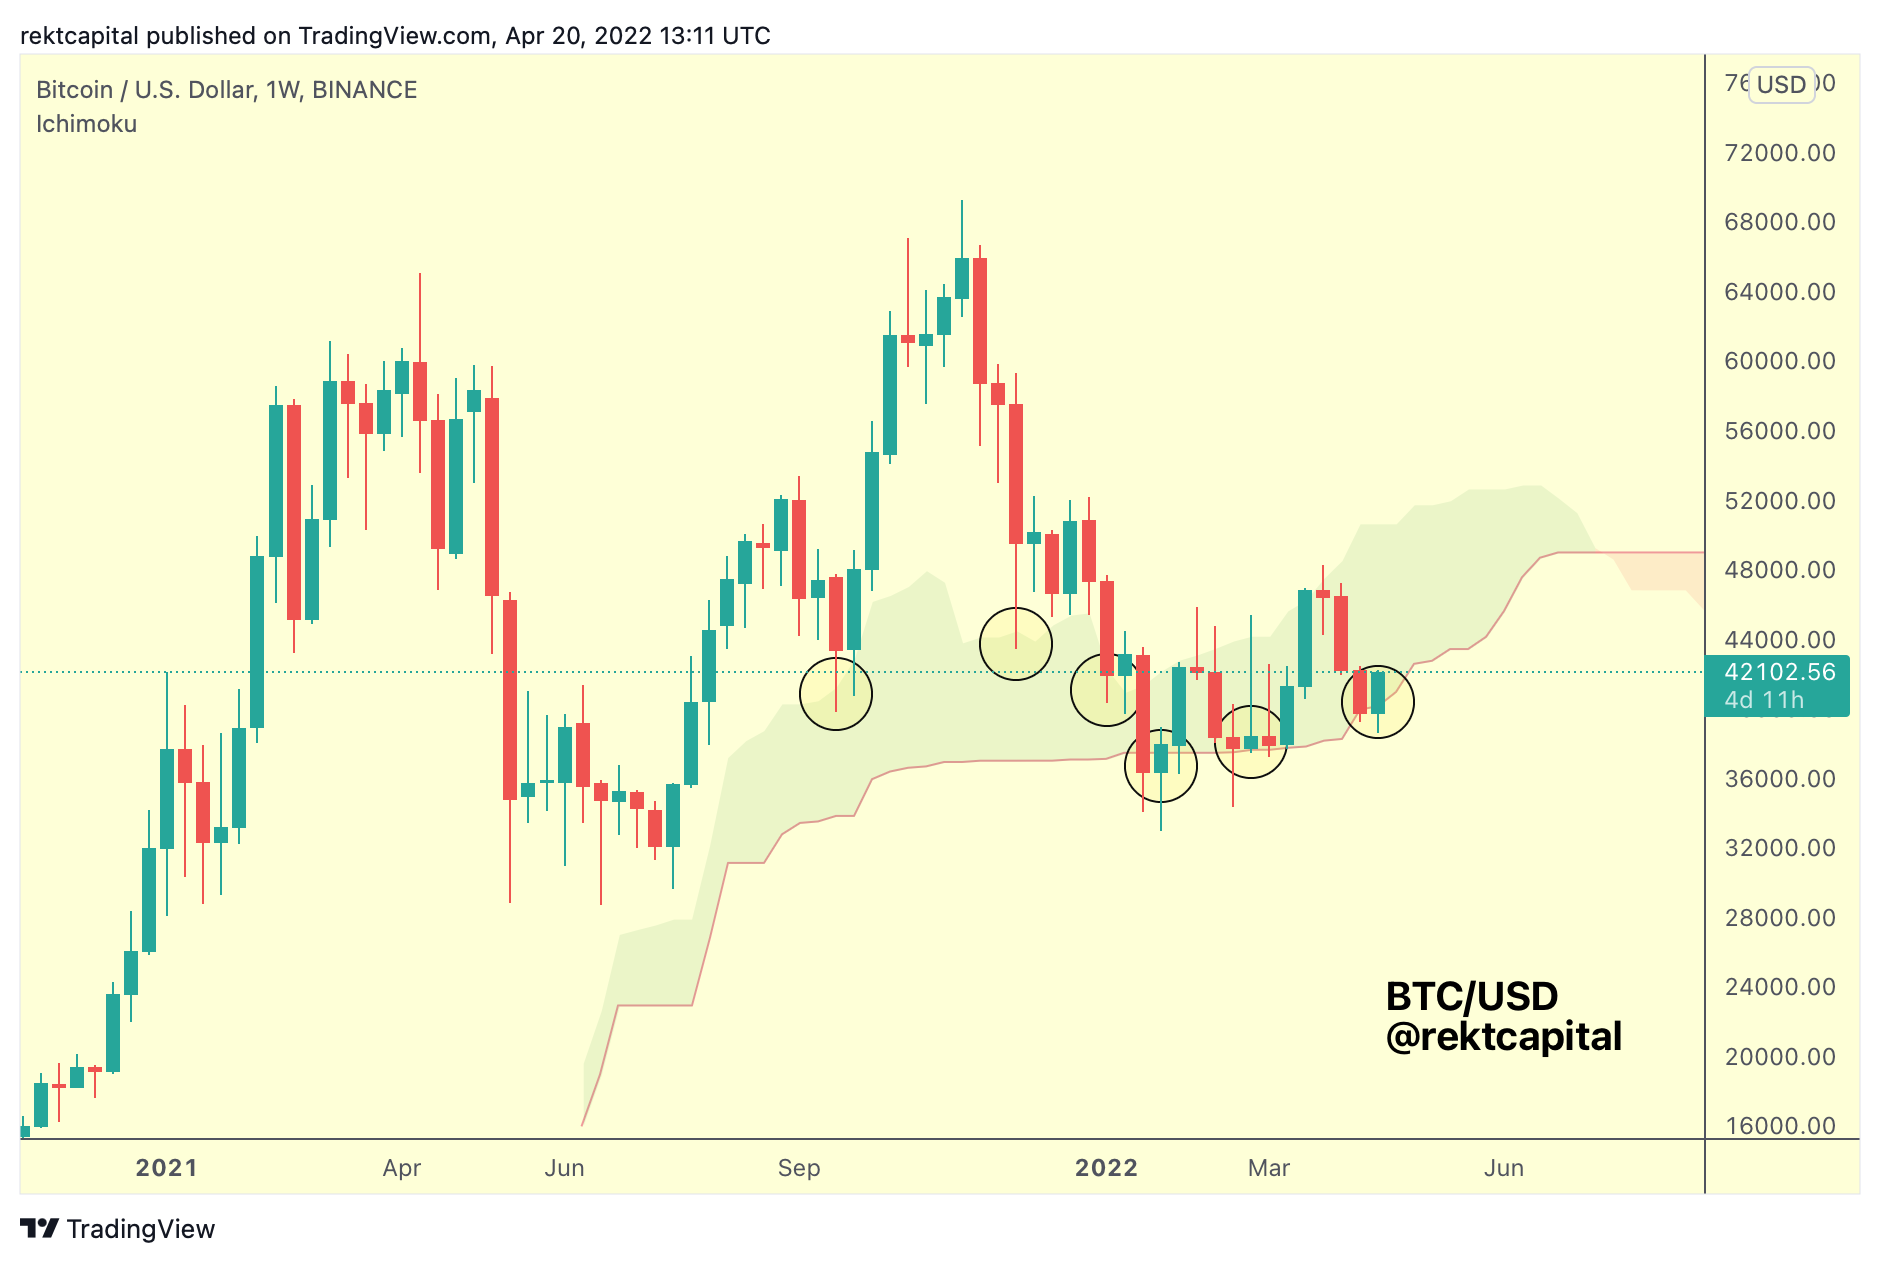
But the Cloud can also act as resistance…
Ichimoku Cloud - A Dynamic Resistance

The top of the Cloud has rejected price on two occasions this year, each time seeing upside FOMO wicks beyond the Cloud briefly, before finally rejecting to the bottom of the Cloud.
(Side note worth mentioning is that the top of the Cloud is now a resistance, but notice how in September 2021 and late 2021 price actually wicked into the Cloud Top, where it figured as support at the time.)
In any case, put simply - Bitcoin is consolidating inside this inclining Cloud, registering Higher Lows and Higher Highs.
But these Higher Highs aren’t necessarily a bad thing as Bear would be inclined to point out.
After all - Bitcoin is reaching higher and higher prices with each attempt, starting from increasingly higher starting price points than before.
So should Bitcoin indeed traverse across the Ichimoku Cloud this time around as well, price could reach the ~$50000-$52000 region, which is the top of the Cloud at this time.
This is the high-level overview of Bitcoin’s next possible uptrend, but there are few key technical things worth mentioning to better understand Bitcoin’s next potential price progression.
I’ll discuss these technical aspects with the aid of Bull Market EMAs, Volume Profile, and Bollinger Bands to better illustrate what levels are worth watching and why they are important going forward.