Is Bitcoin Gearing Up For A Strong Uptrend?
On Bitcoin's most recent recovery...
Welcome to the Rekt Capital newsletter, a resource for people who want to better navigate the crypto markets with the help of cutting-edge crypto research and unbiased market analysis.
I write research articles just like this one every Monday and Wednesday for subscribers of the Rekt Capital newsletter. Friday’s feature my thoughts, charts, and analysis on a wide-variety of Altcoins.
Today’s edition is free for everybody to read.
If you’d like to receive cutting-edge research like this straight to your inbox - feel free to subscribe for $14 a month:
Newsletter in a nutshell:
- Bitcoin has formed a new Higher Low.
- Bitcoin may be in the process of forming a macro Ascending Triangle, though this still needs to be confirmed. Bitcoin needs to break the series of Lower Highs first.
- Bitcoin may soon challenge the two key Bull Market EMAs that need to be flipped into support for price to enter the upper half of the $28000-$69000 macro range.
- Bitcoin finds itself inside a Volume Gap. Volume Gaps tend to be filled which is why a breakout beyond the two key Bull Market EMAs could see price revisit the Range High of the Volume Gap (~$48000).
- The Range High of the Volume Gap is approximate resistance with the mid-point of the macro Bollinger Bands. This area will likely be a strong resistance, should price indeed rally there.
- Monthly Close above ~$42000 would be a bullish turn of technical events, as per the Bitcoin Logarithmic Growth Curves.
- Monthly Close above $35000 would bring the Double Top formation closer towards invalidation.
Bitcoin Q1/Q2 Re-Accumulation Range
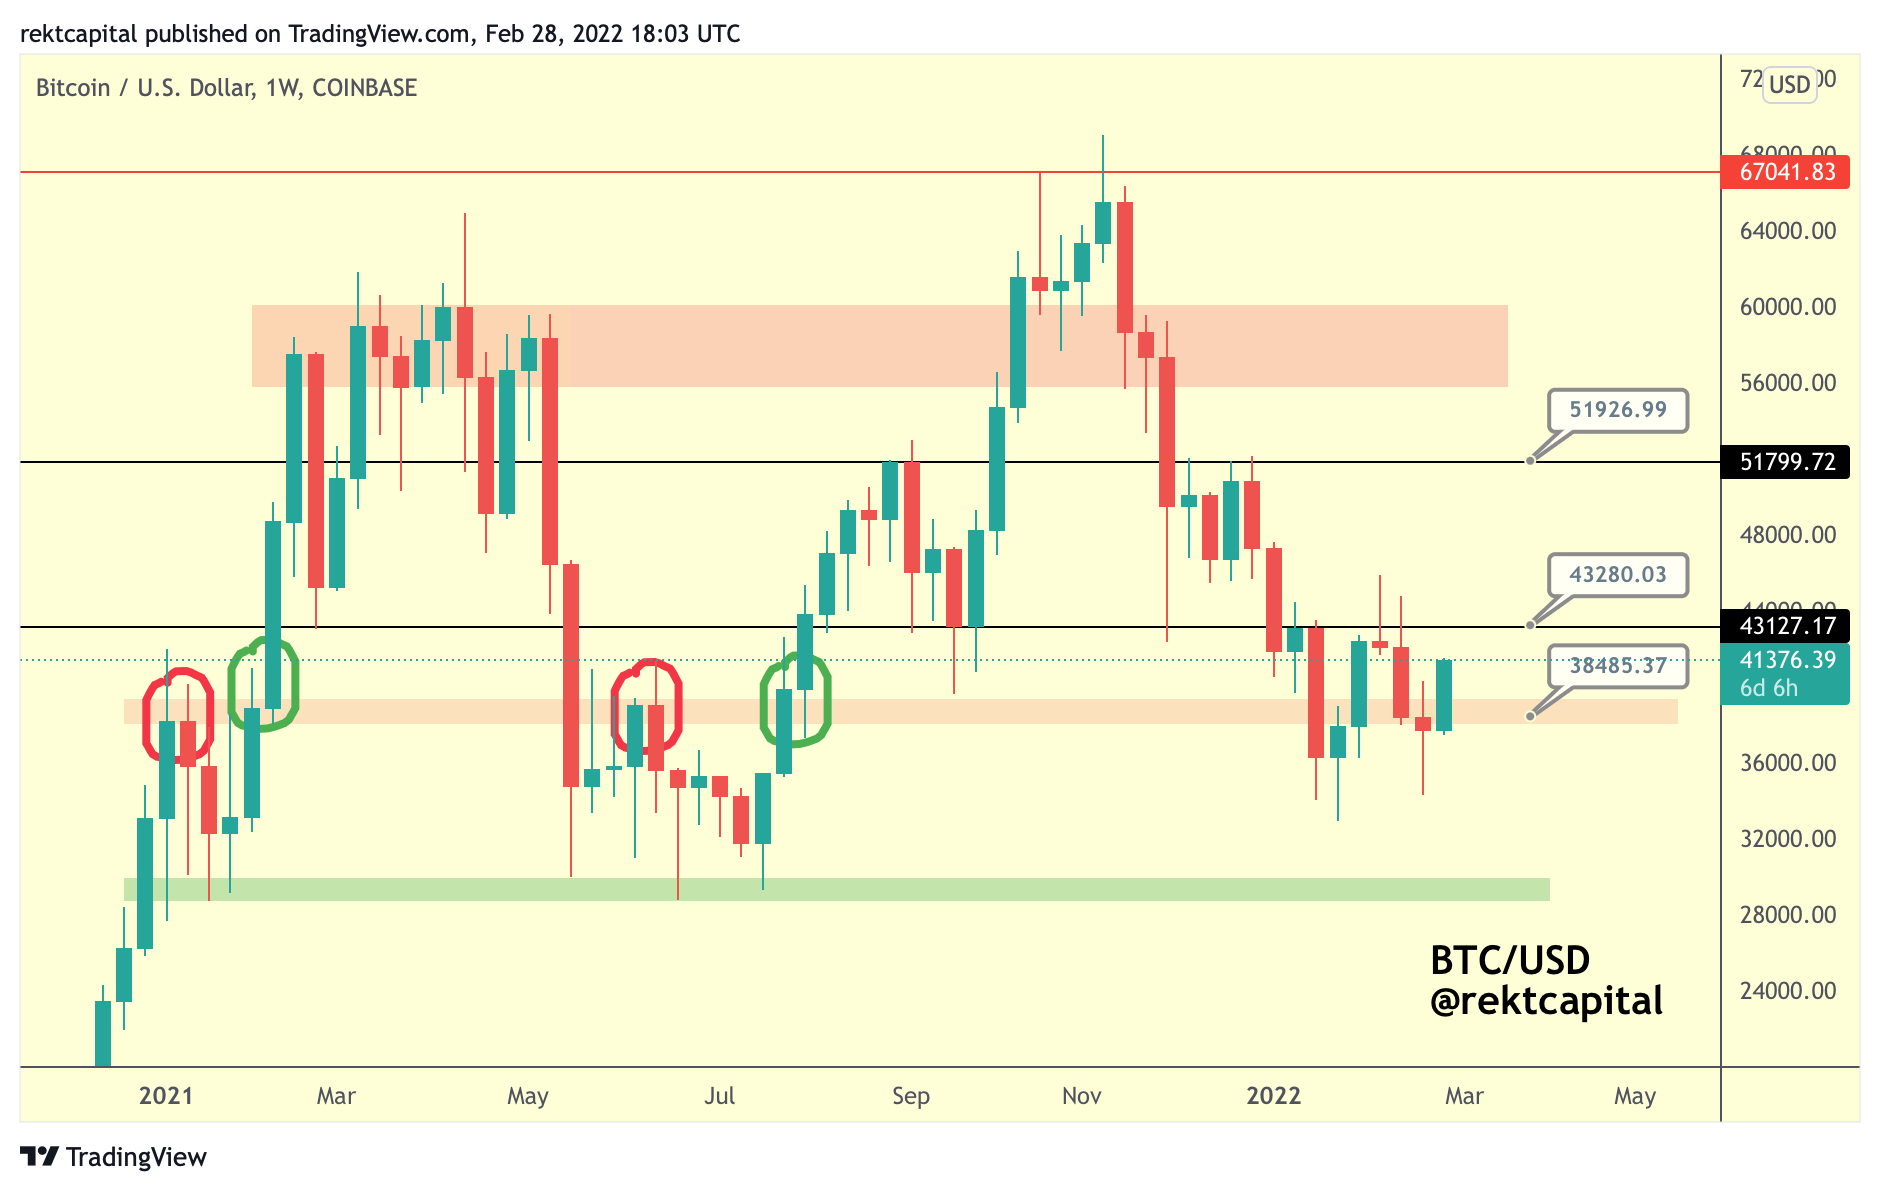
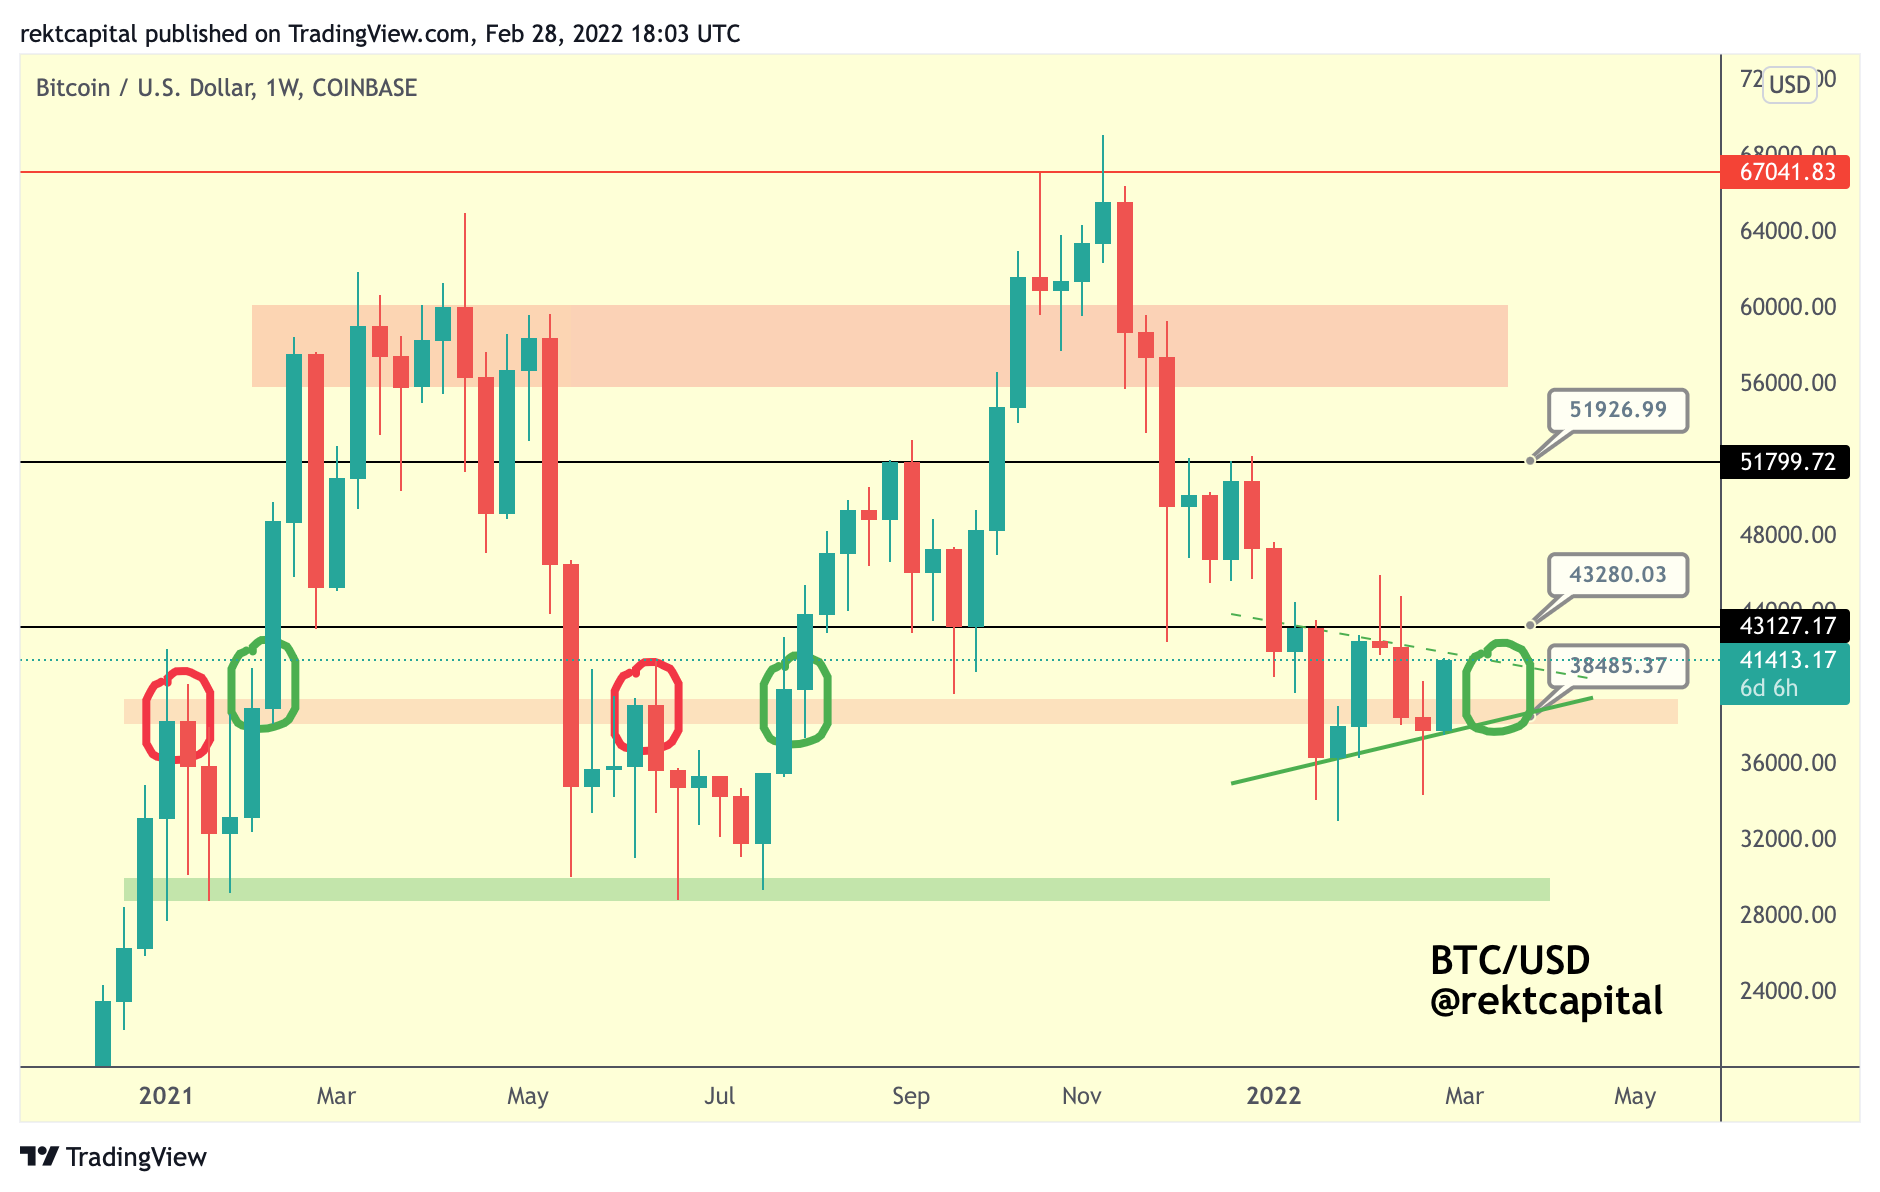
Despite the Weekly Close below the red $38000 area, Bitcoin has been able to swiftly recover back above this region - and it has done so very early on in the new week.
Thus Bitcoin has reclaimed the red area as support on lower timeframes, effectively breaking back into the $38000-$43100 range (red-black).
But even though Bitcoin has reclaimed the red area as support on lower timeframes, Bitcoin may very well need to repeat this feat on the higher timeframe - specifically the Weekly timeframe.
And Bitcoin is once again positioning itself for a successful retest attempt, just like in previous green circles:
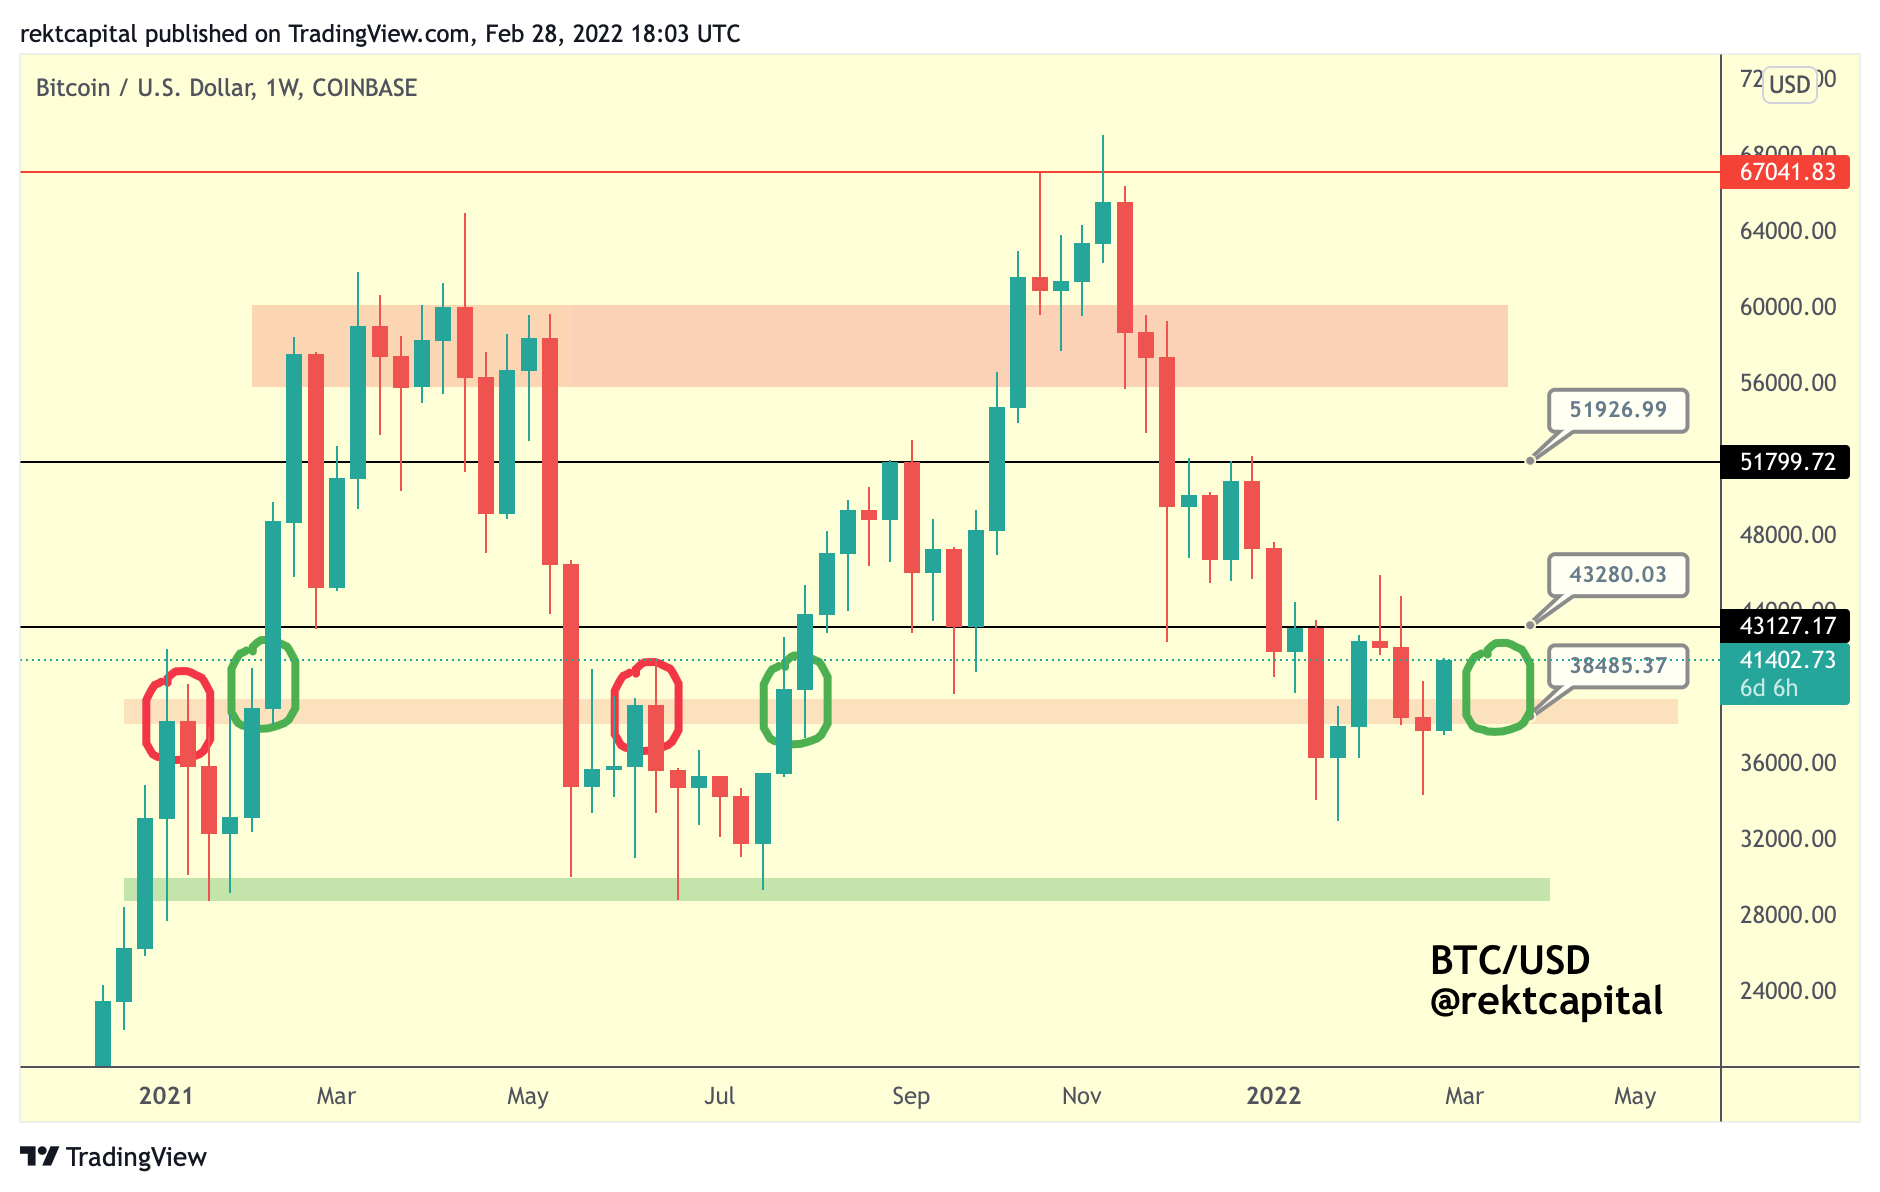
And also - Bitcoin has formed a new Higher Low on this recovery:
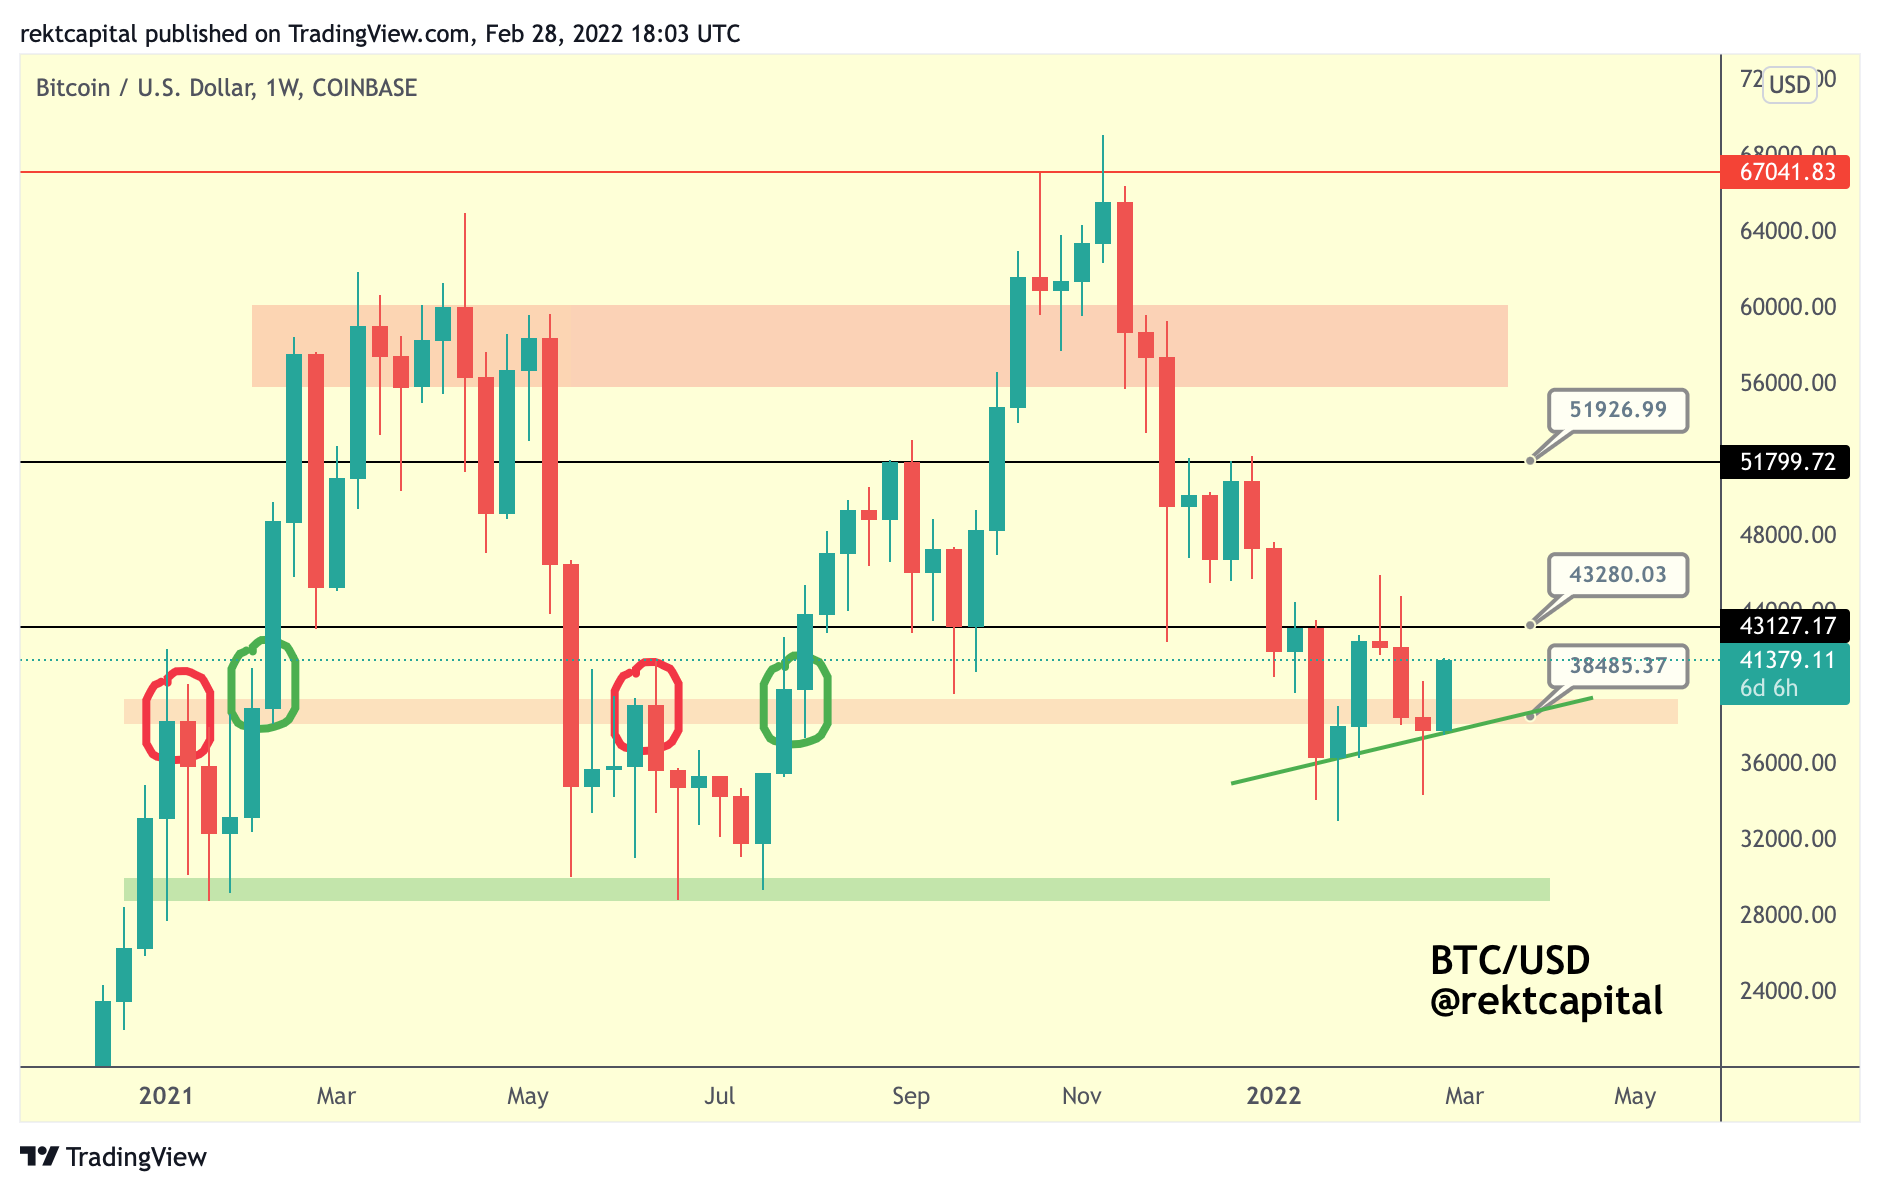
Now the questions is - is Bitcoin forming a flagging structure or an Ascending Triangle here?
Because Bitcoin is now testing the green dashed diagonal resistance forming a series of Lower Highs.
If this indeed becomes a formidable resistance, then this diagonal could reject price into that retest of the red $38000 region.
However, if this green dashed diagonal turns out to not be much of an obstacle, Bitcoin could see price revisit the ~$43100 level:
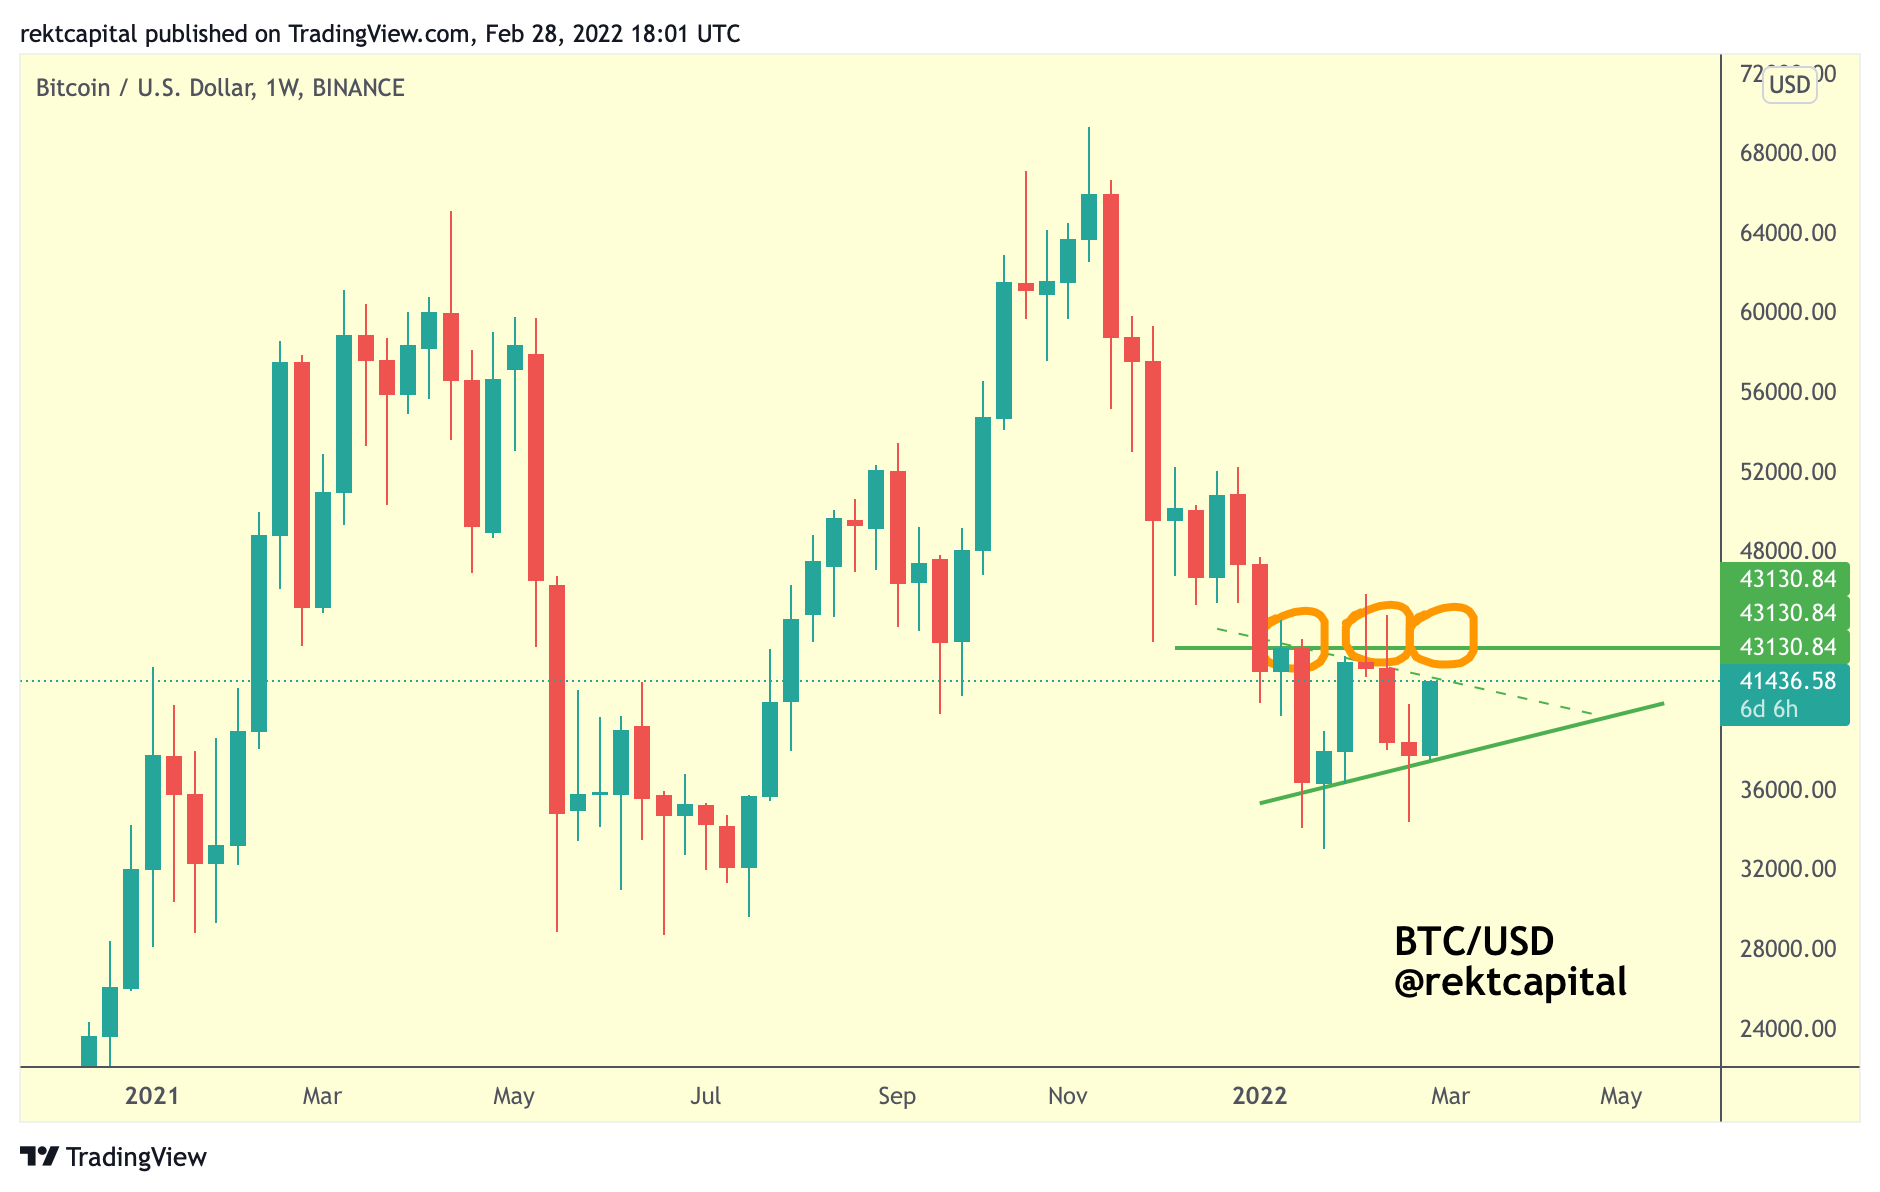
If indeed Bitcoin revisits the $43100 level, it’s important that Bitcoin Weekly closes above the green dashed diagonal resistance - as this would invalidate the series of Lower Highs and this way the green Ascending Triangle would take precedence as the predominant market structure for Bitcoin right now.
Because otherwise, Bitcoin could upside wick into the top of the Ascending Triangle resistance at $43100 and Weekly Close below the green dashed diagonal which would confirm the series of Lower Highs, in which case BTC would take on more of a flagging structure, with possible bearish ramifications upon loss of the newly established Higher Low.
So while Bitcoin is theoretically ranging in between the $38000-$43100 range, it is doing so at a Higher Low and possibly at a Lower High as well (though the legitimacy of this LH is still on the table at this time).
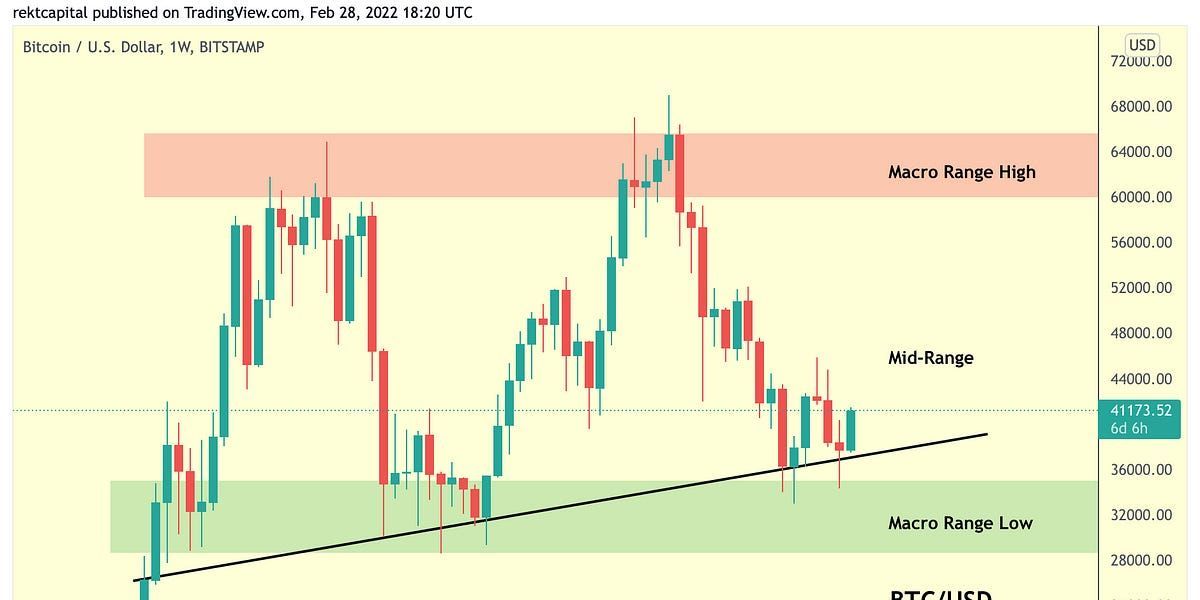
Macro Range Analysis
Macro-wise, not much is going on.
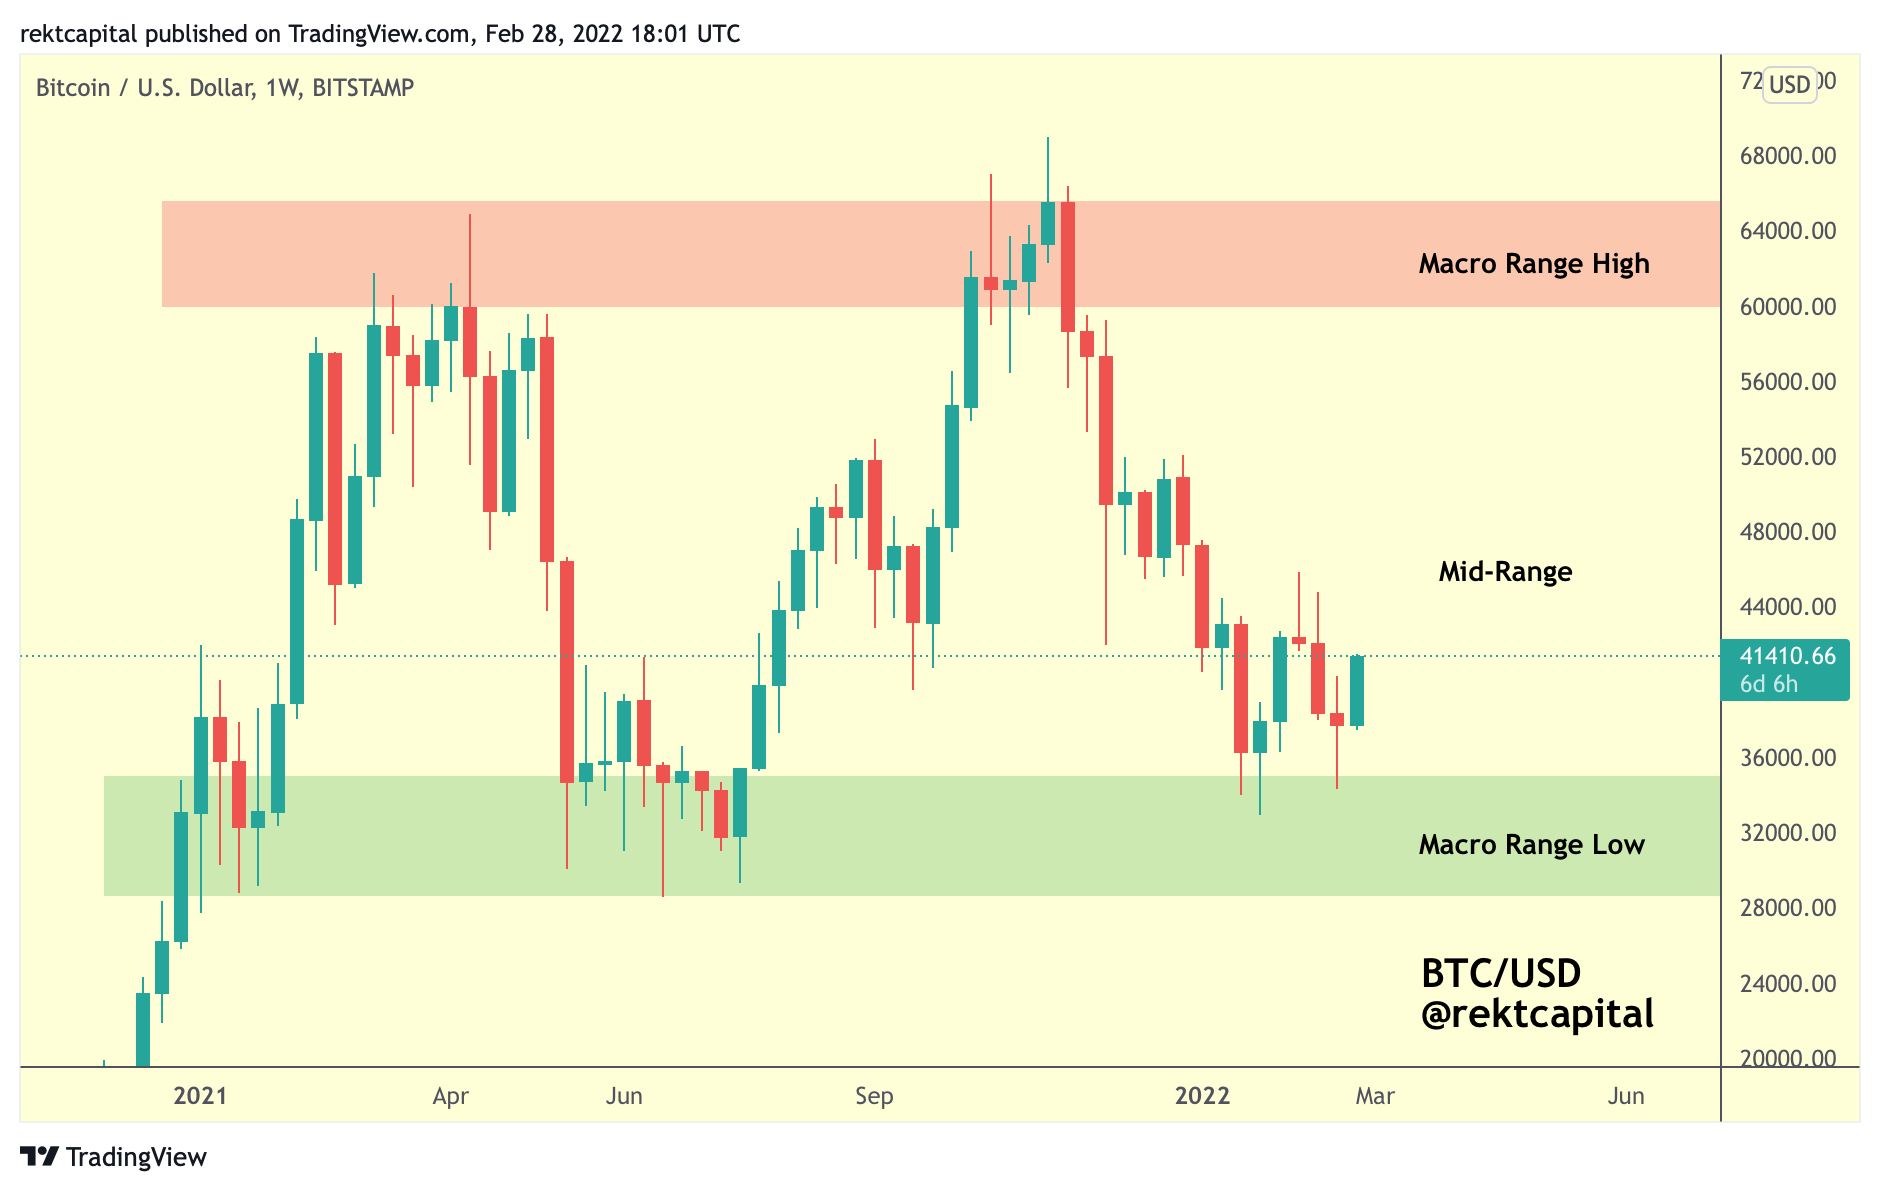
Bitcoin continues to consolidate in between the $28000-$69000 macro range (green-red).
But here’s what’s worth mentioning about price action inside this wide range:
Not only has Bitcoin formed a new Higher Low this week, as mentioned earlier in this edition of the newsletter, but this Higher Low is yet another in a series of Higher Lows dating back to July 2021.
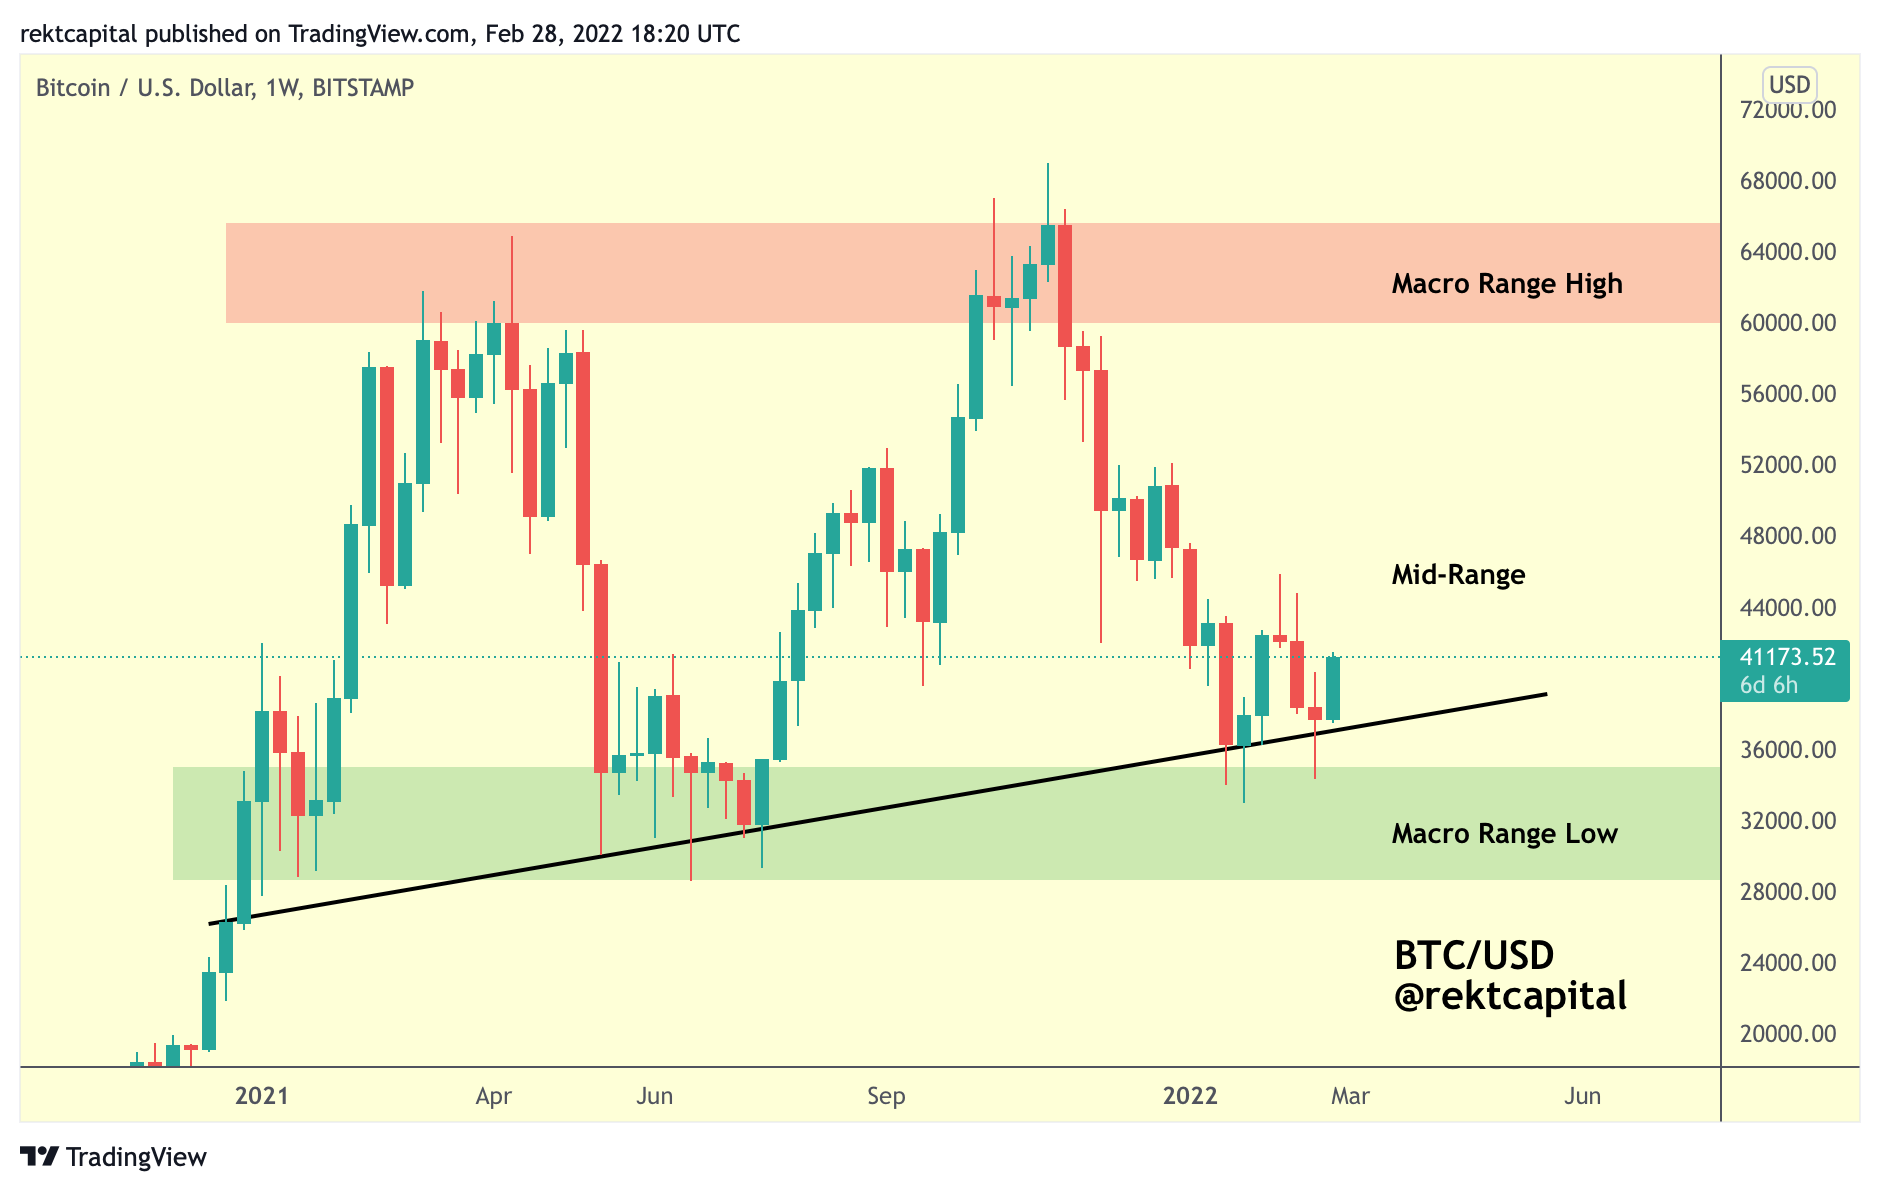
With Bitcoin seemingly forming Higher Lows at the lows of this macro range, let’s now turn our attention to the mid-range area, which is where the action may be taking place soon.
The Mid-Range & The Volume Gap
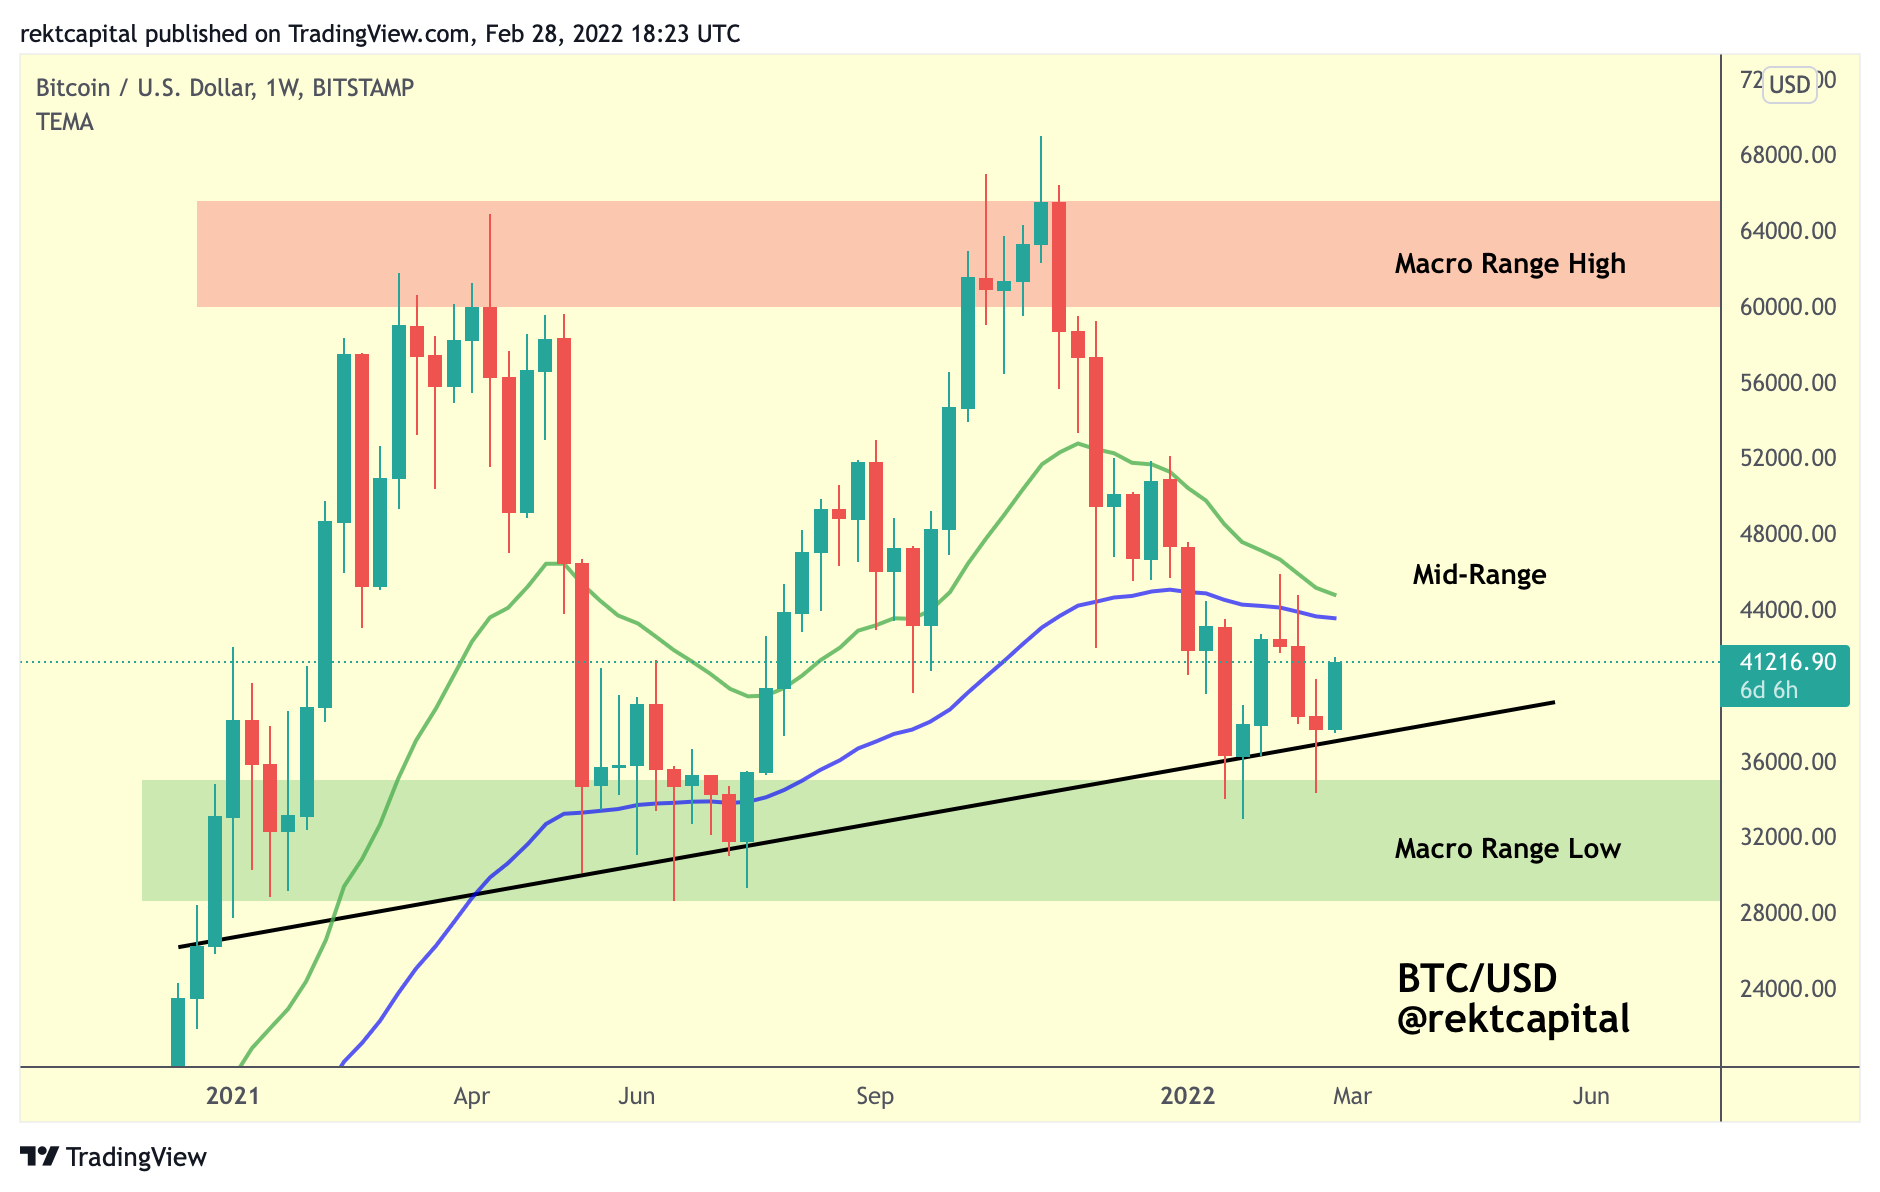
Bitcoin is now approaching the mid-range area of the macro range.
The mid-range is of course the mid-point of the entire macro range, but what’s interesting about this mid-range area is that it is also represented by the two Bull Market EMAs that BTC needs to flip back into support for bullish bias.
These two EMAs are the green 21-week EMA and blue 50-week EMA.
Through the lens of the Macro Range, reclaiming them as support would effectively confirm that Bitcoin is ready to move higher within the upper half of the range.
As long as they remain as resistance, Bitcoin will simply occupy the lower half of the macro range.
So these two Bull Market EMAs will be important breakout points to watch for to further validate this bullish momentum for Bitcoin.
But what’s also important to bear in mind is that Bitcoin finds itself inside a Volume Gap:
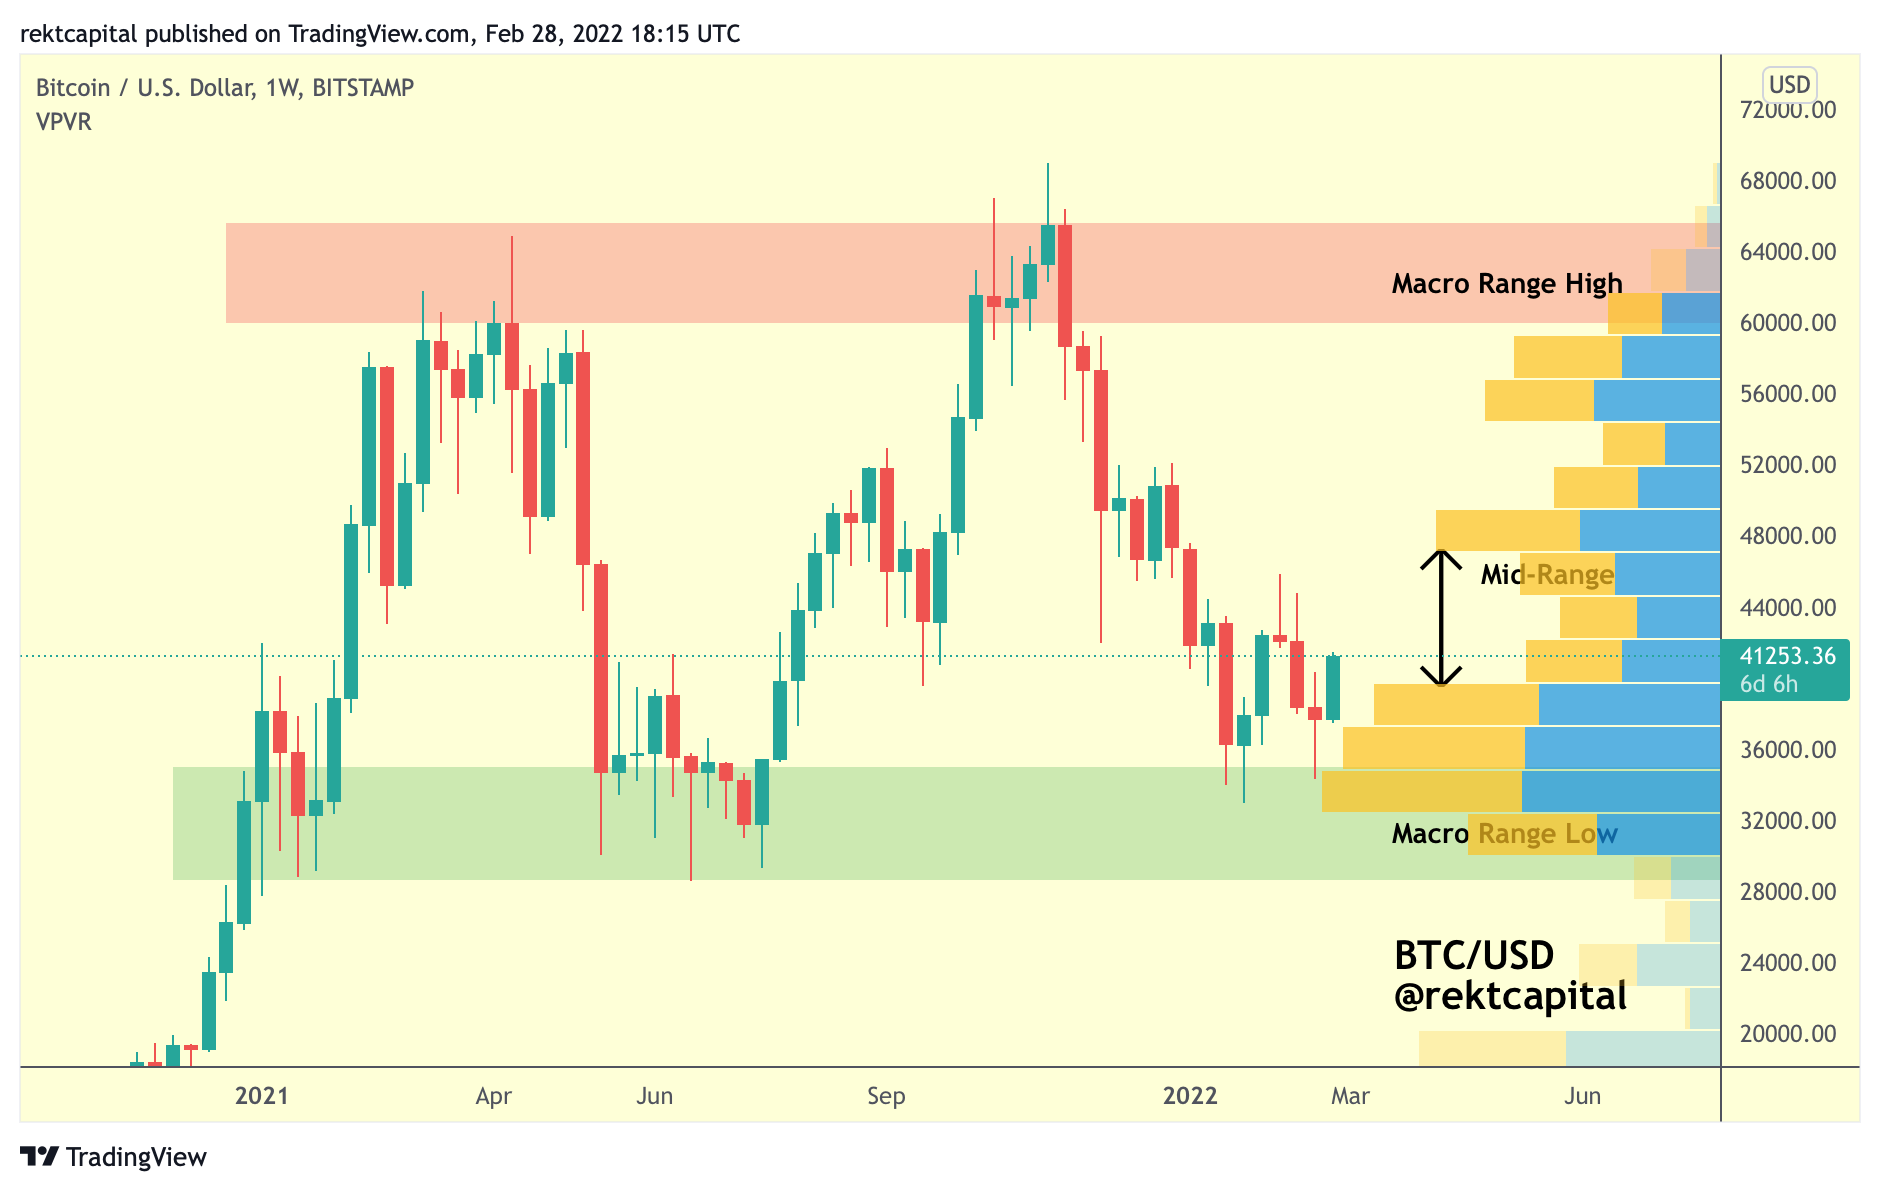
Volume Gaps are like vaccums in physics - they tend to get filled.
In terms of price action, this Volume Gap is suggesting that there is little historically transacted volume at the prices that the Volume Gap represents.
Therefore should BTC indeed break beyond those two aforementioned EMAs, then BTC could levitate to the ~$48000 area which is the Range High of the Volume Gap.
After all - the Volume Gap itself represents a small range and Bitcoin rebounding recently is essentially BTC rebounding from the Range Low of the Volume Gap, with scope to traverse the entire range and reach the Range High of the Volume Gap. This is something we spoke about in last week’s letter.
What’s interesting about the Range High of the Volume Gap is that it is approximately confluent with the mid-point of the macro Bollinger Bands:
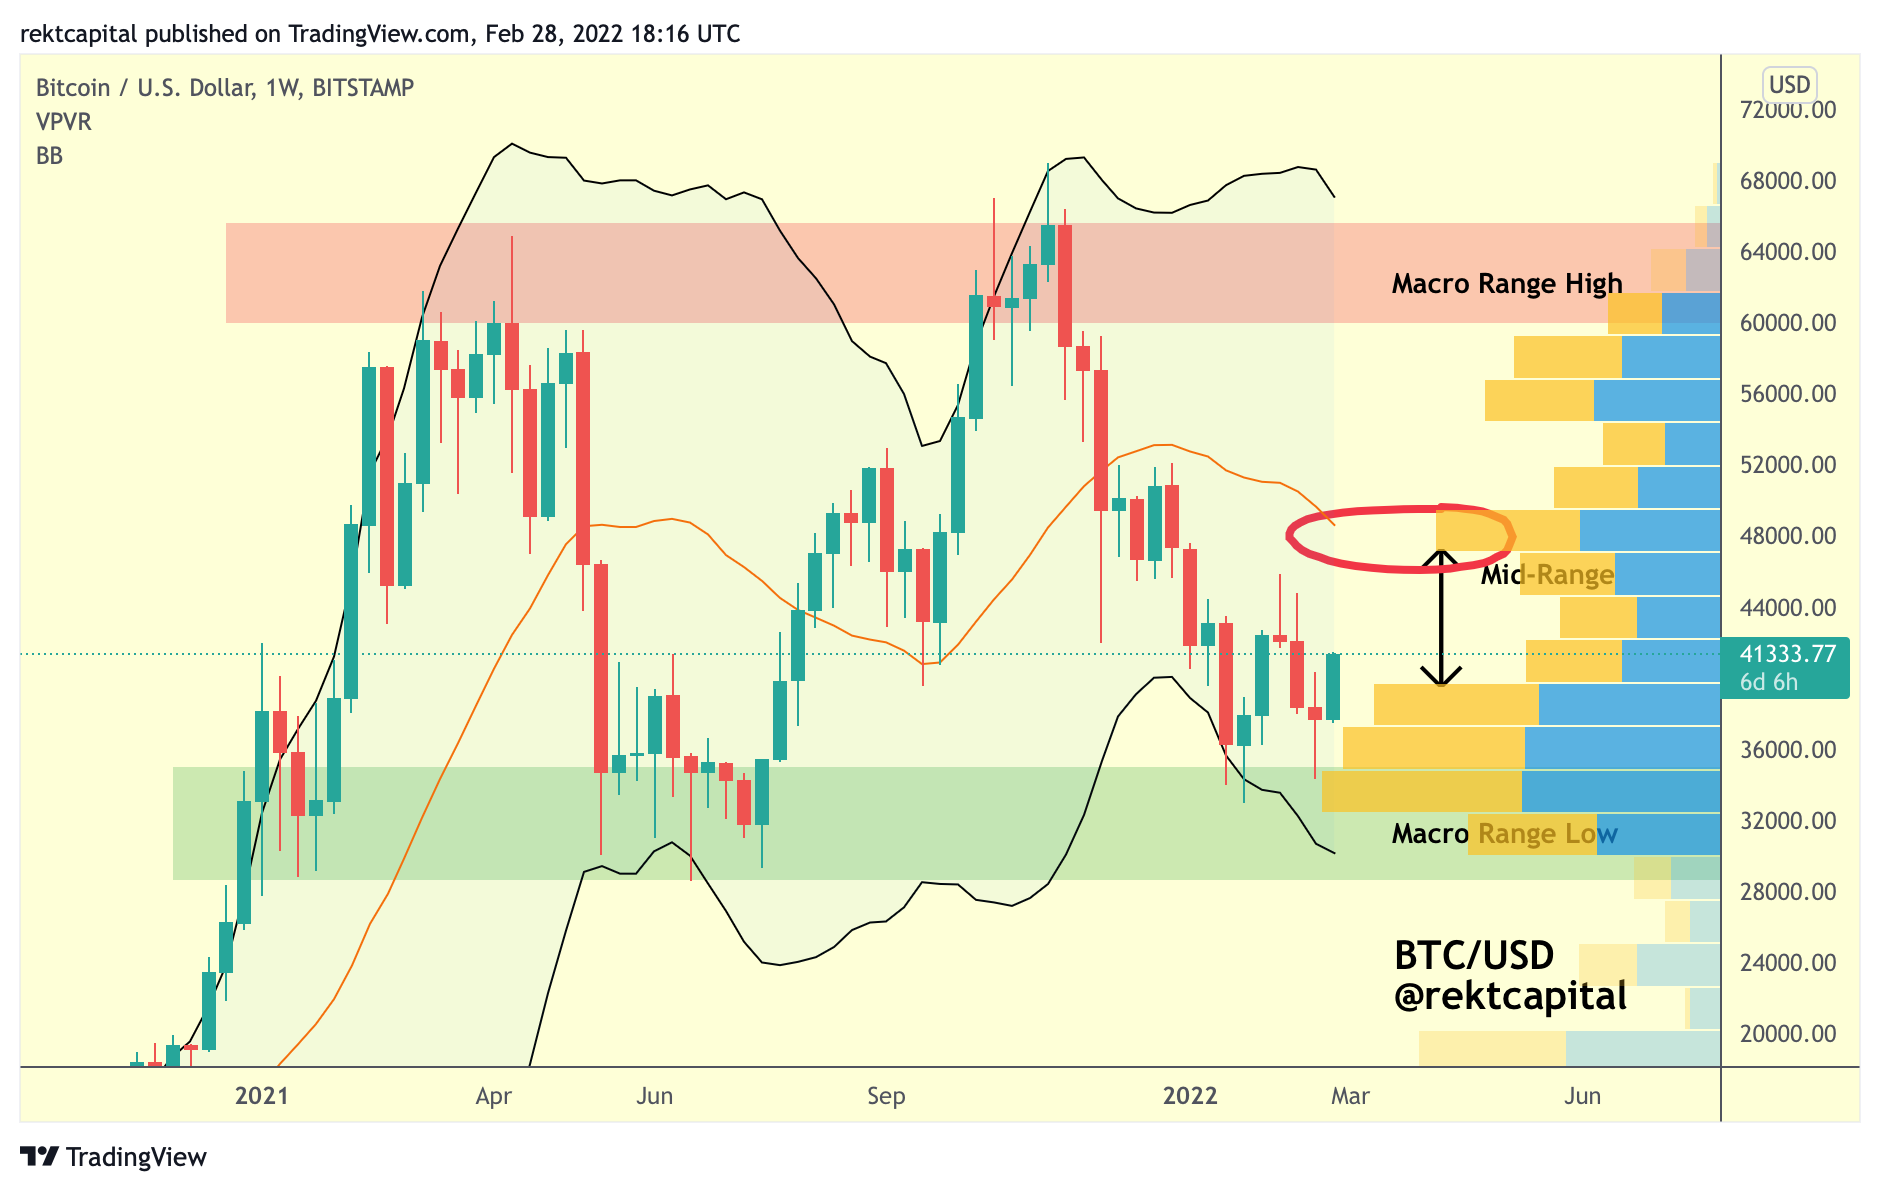
This will probably be a resistance Bitcoin will need to reckon with should price indeed break beyond the EMA-formed mid-range area (red circle, confluent with orange Bollinger Band mid-point).
Bitcoin Logarithmic Growth Curve Channel
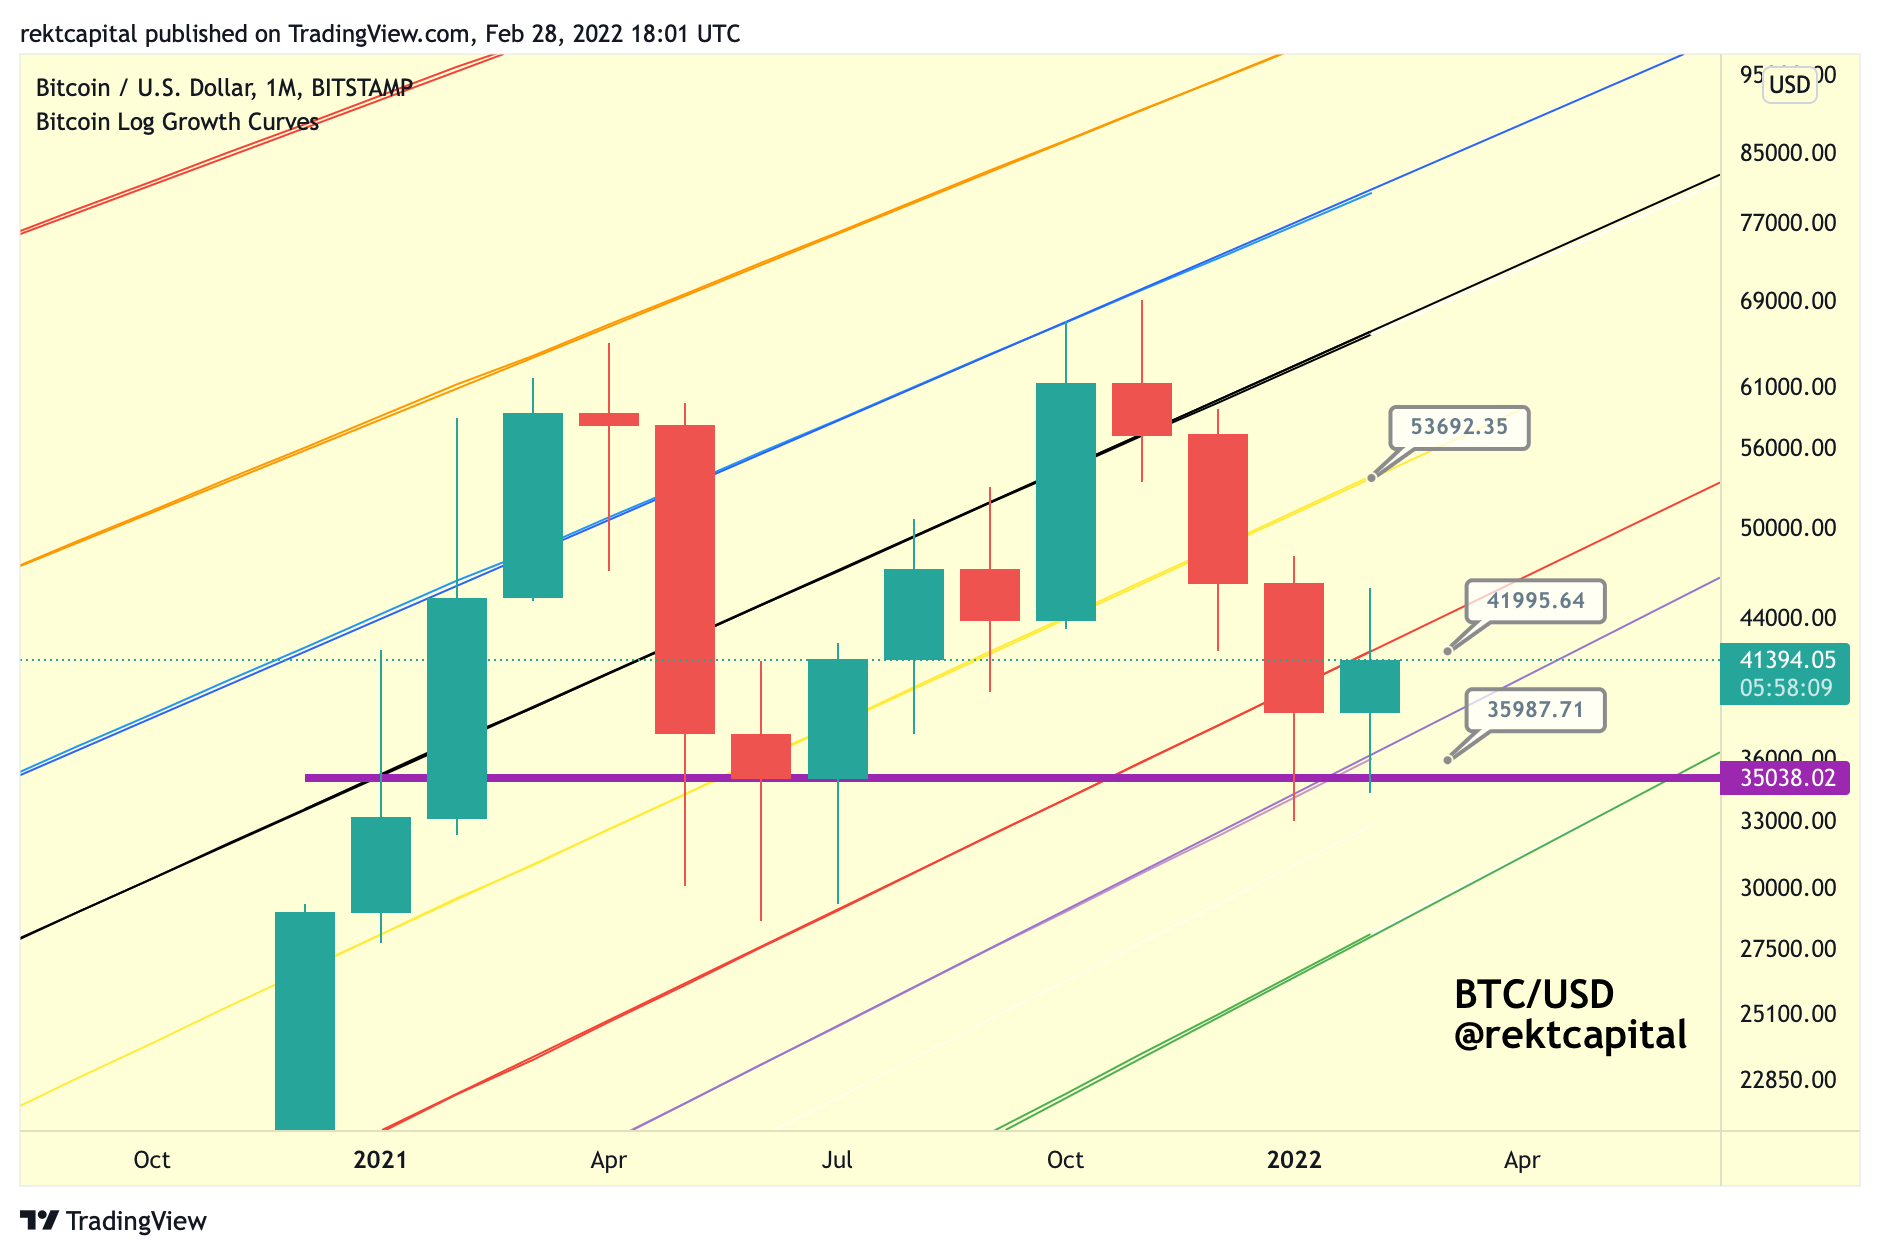
The Monthly candle close is approaching and here’s what we need to know:
Monthly close above the red 0.236 Fib Curve (~$42000) and Bitcoin will need to reclaim this Fib as support. But should that close occur, that would be a bullish development for price.
Will that close happen?
That would be a best-case scenario for BTC right now; instead, I think it would be better to focus simply on the fact that BTC may Monthly Close between the purple Fib and the red 0.236 Fib curves.
On the surface, such a Monthly Close doesn’t seem like much, but it would actually distort an inherently bearish M-Shaped formation in the Double Top:
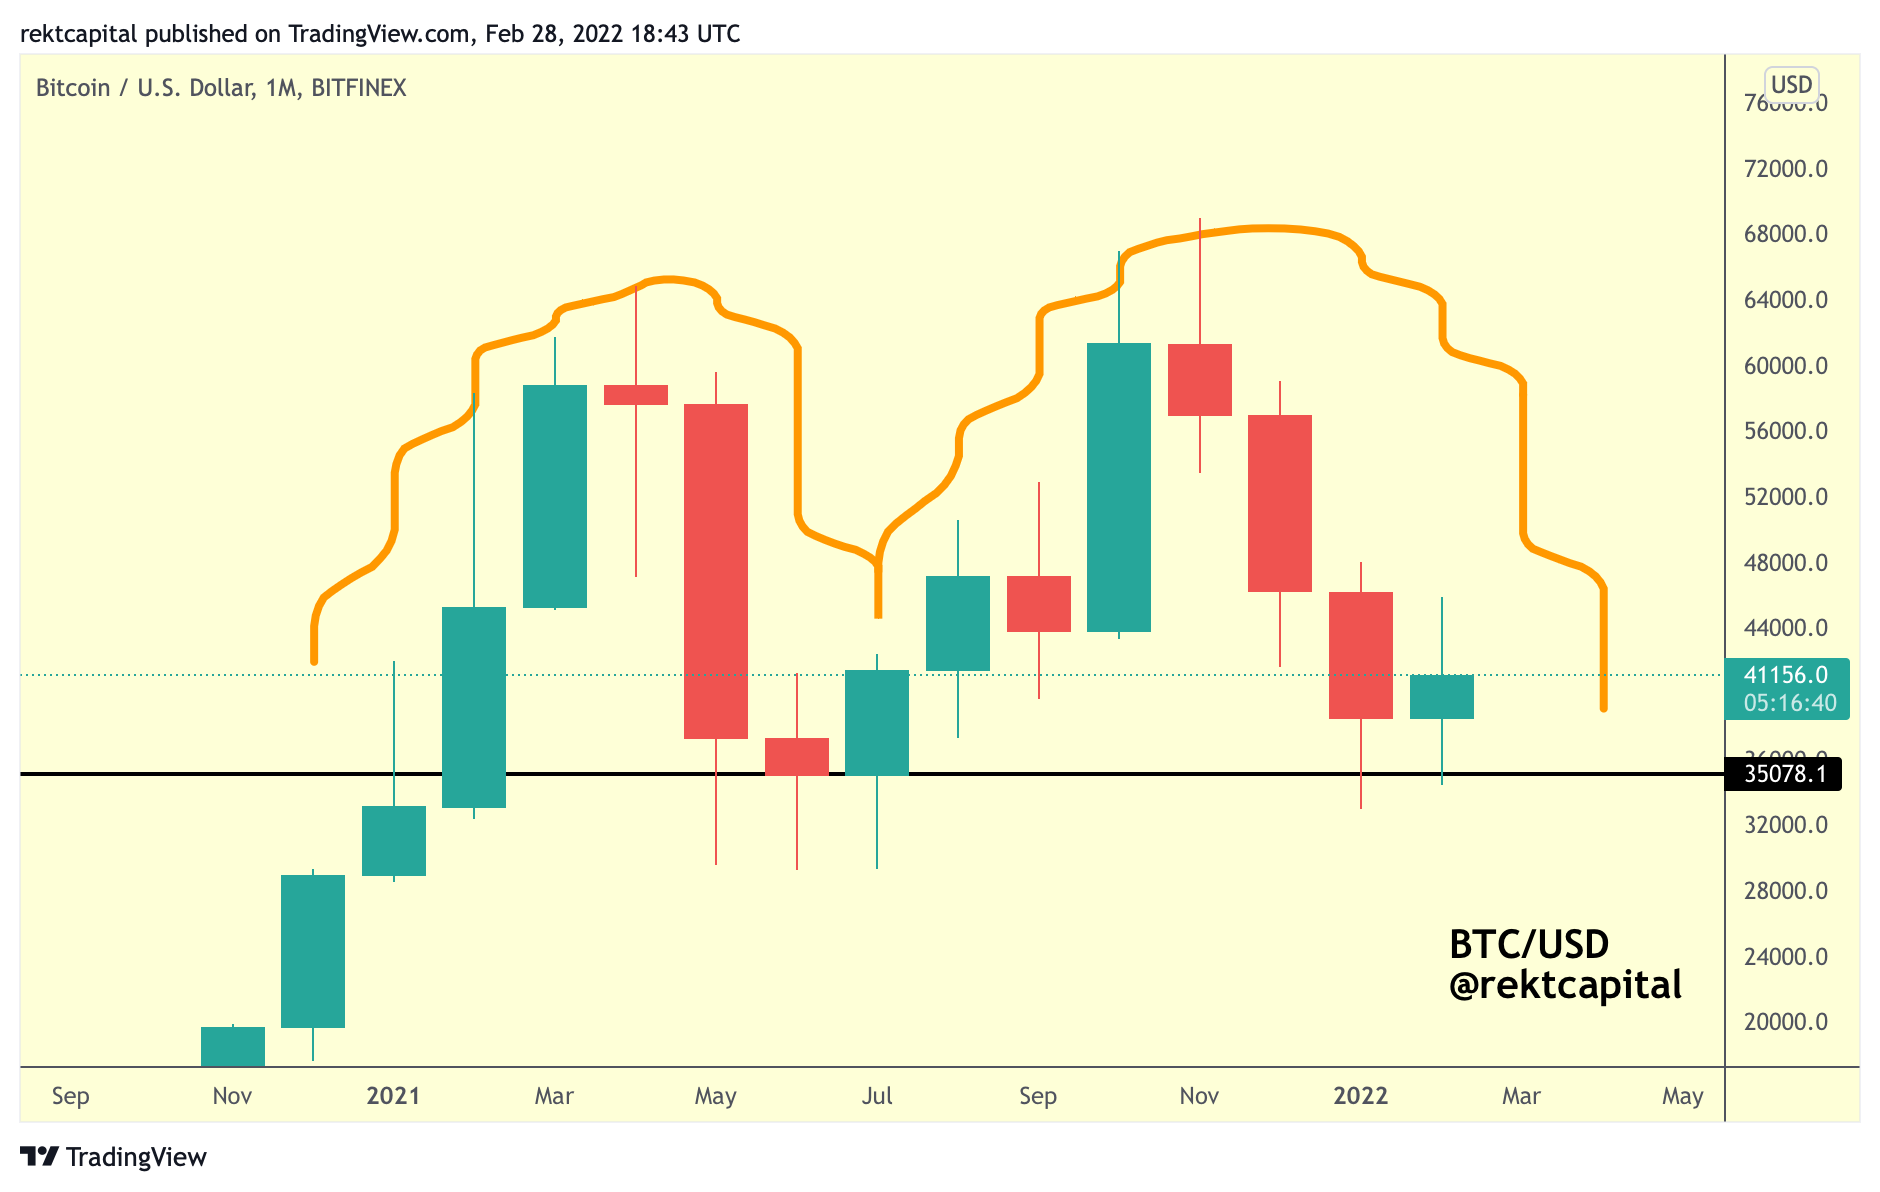
The validation point for this bearish formation is ~$35000 (black) and a Monthly close below this level could indeed be cause for concern.
However, it must be said that in the past we’ve see quintessentially bearish macro formations precipitate upside, rather than downside.
One most notable example of this occurrence is the Head & Shoulders formation back in May 2021:
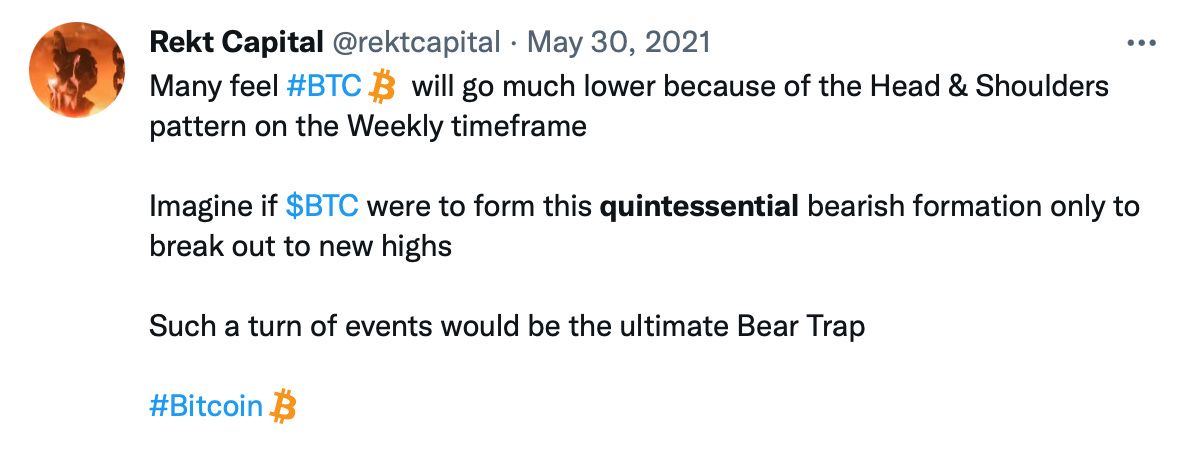
Which is why this past December I tweeted the same about the Double Top formation that is currently appearing on price:
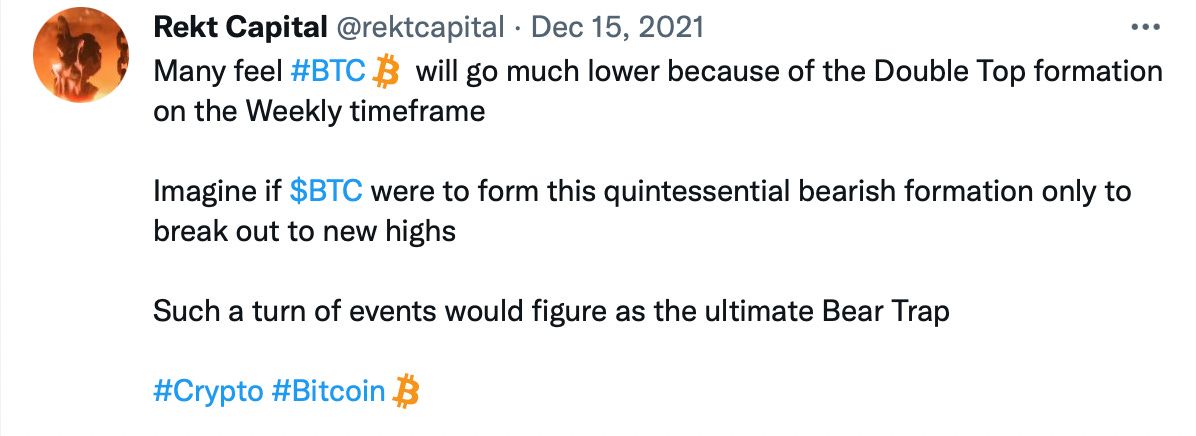

So the fact that BTC is on the cusp of Monthly Closing above $35000 is a positive thing for the bulls as it would avoid the validation of this bearish pattern and by the same token it would confirm a Higher Low on the monthly timeframe.
Thank you for reading this free edition of the Rekt Capital newsletter.
If you enjoyed this edition - I guarantee you’ll love the Rekt Capital newsletter. Feel free to Subscribe today for only $14 a month: