The DASH Market Cycle
The historical cyclicality of DASH's price action

Welcome the Rekt Capital newsletter, a place for investors who want to better navigate the crypto markets with the help of cutting-edge crypto research and unbiased market analysis.
I write research articles just like this one every Monday for subscribers of the Rekt Capital newsletter. Monday editions are only available to paid Subscribers.
That said - today’s edition is free for everybody to read.
So if you’d like to receive cutting-edge research like this straight to your inbox, feel free to make the most of the early-bird discount of $6.99 a month and subscribe today:
Key Altcoin Correlations
In a mid-January edition of the Rekt Capital newsletter, I shared a few examples of how major Altcoins were mimicking and following Ethereum’s price trajectory.
The first example was Litecoin:
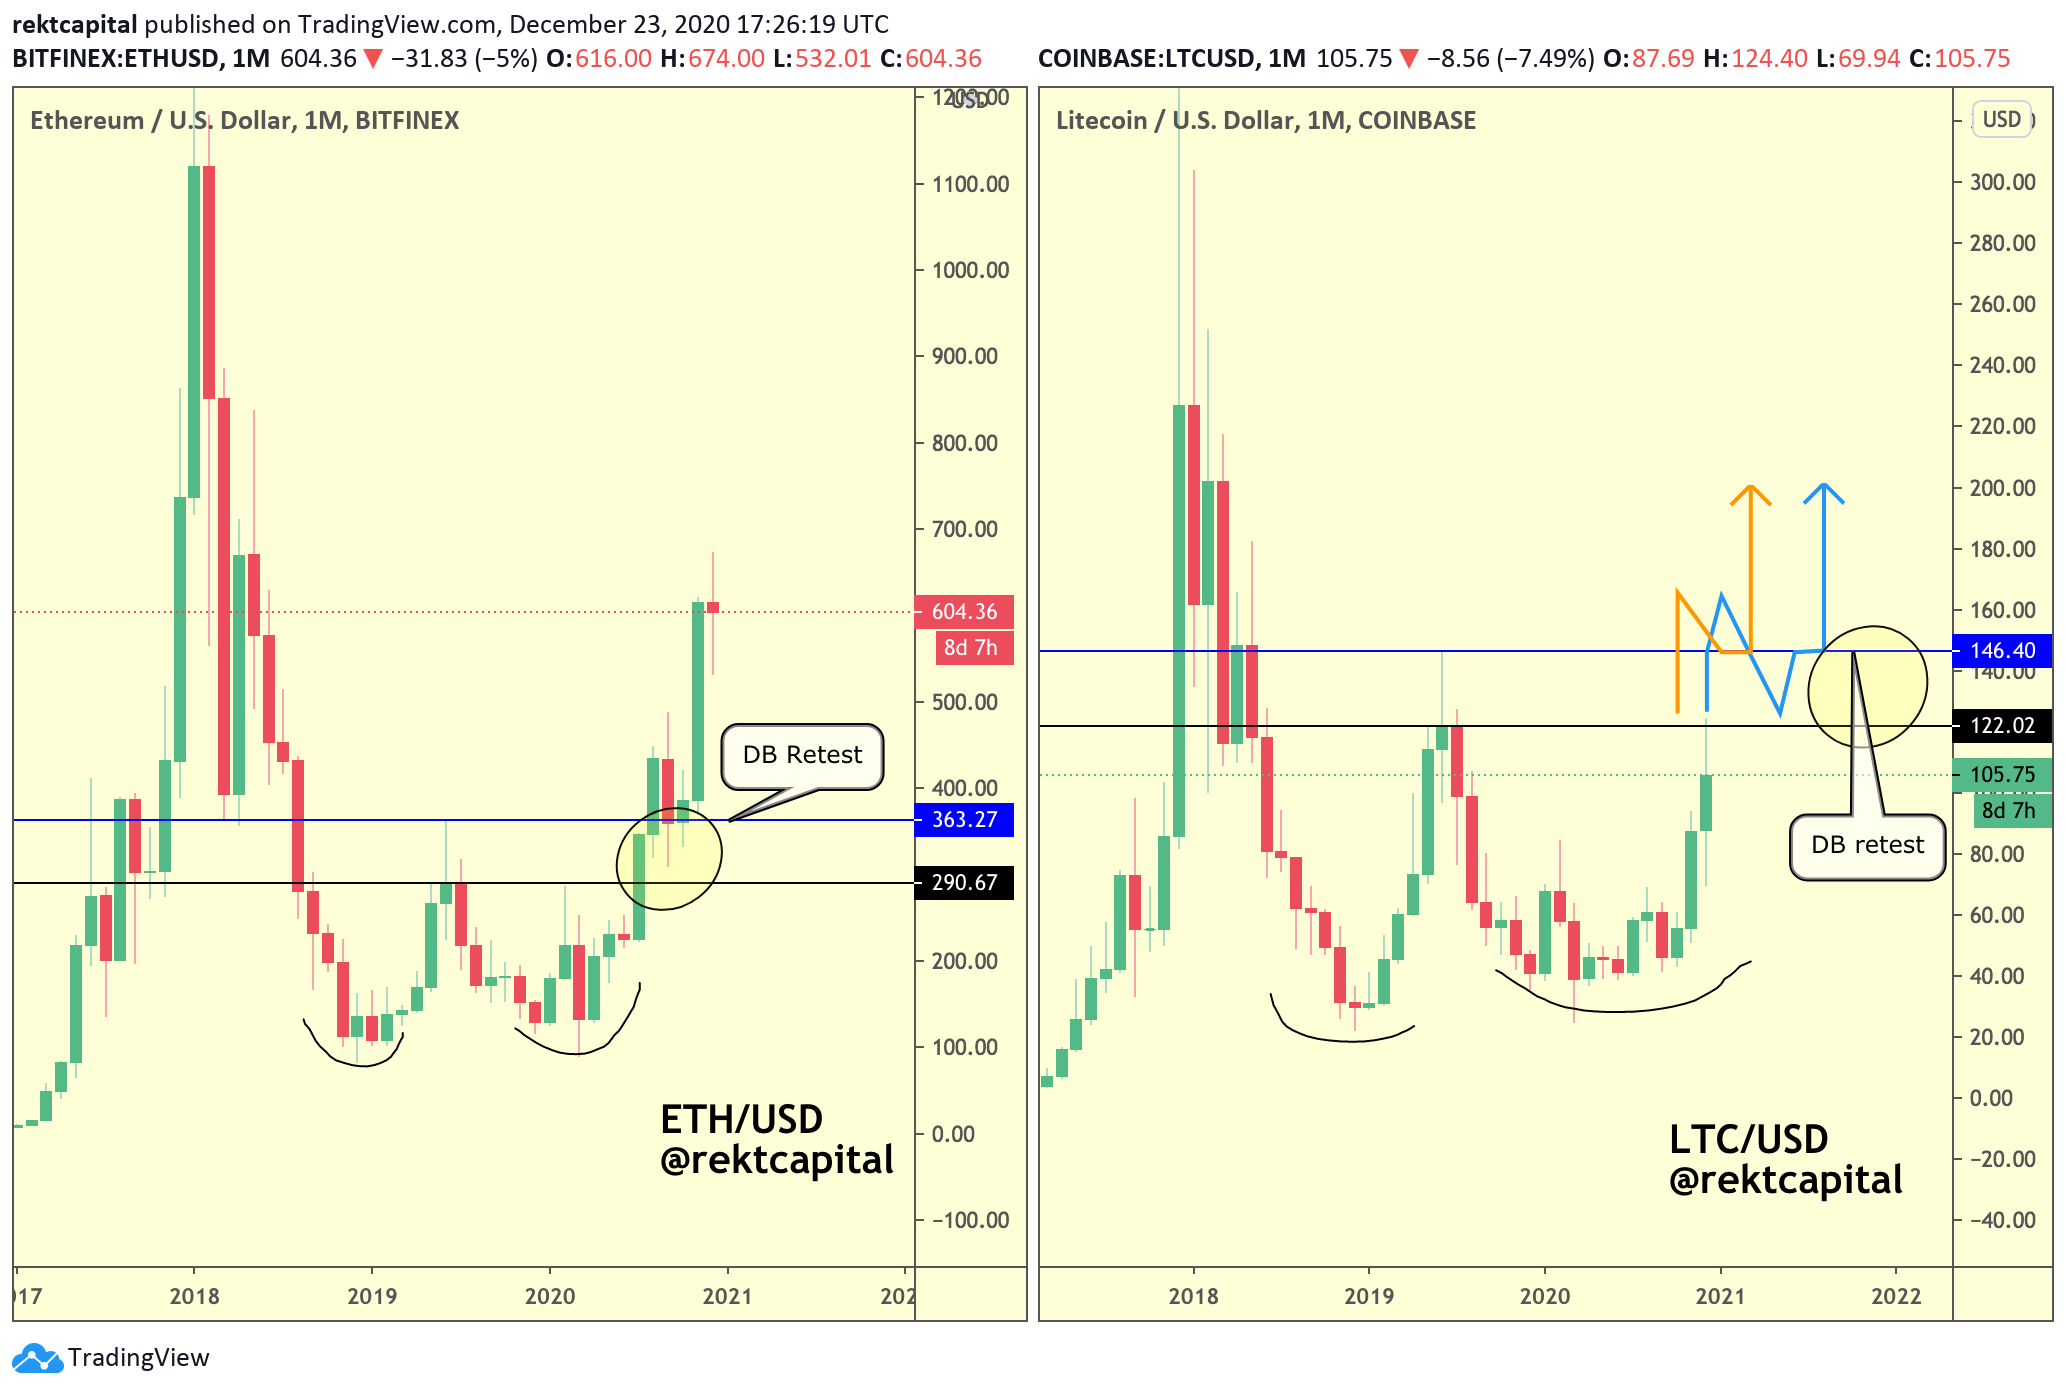
Ethereum had broken out from a macro Double Bottom formation and successfully retest it (yellow circle) before continuing higher.
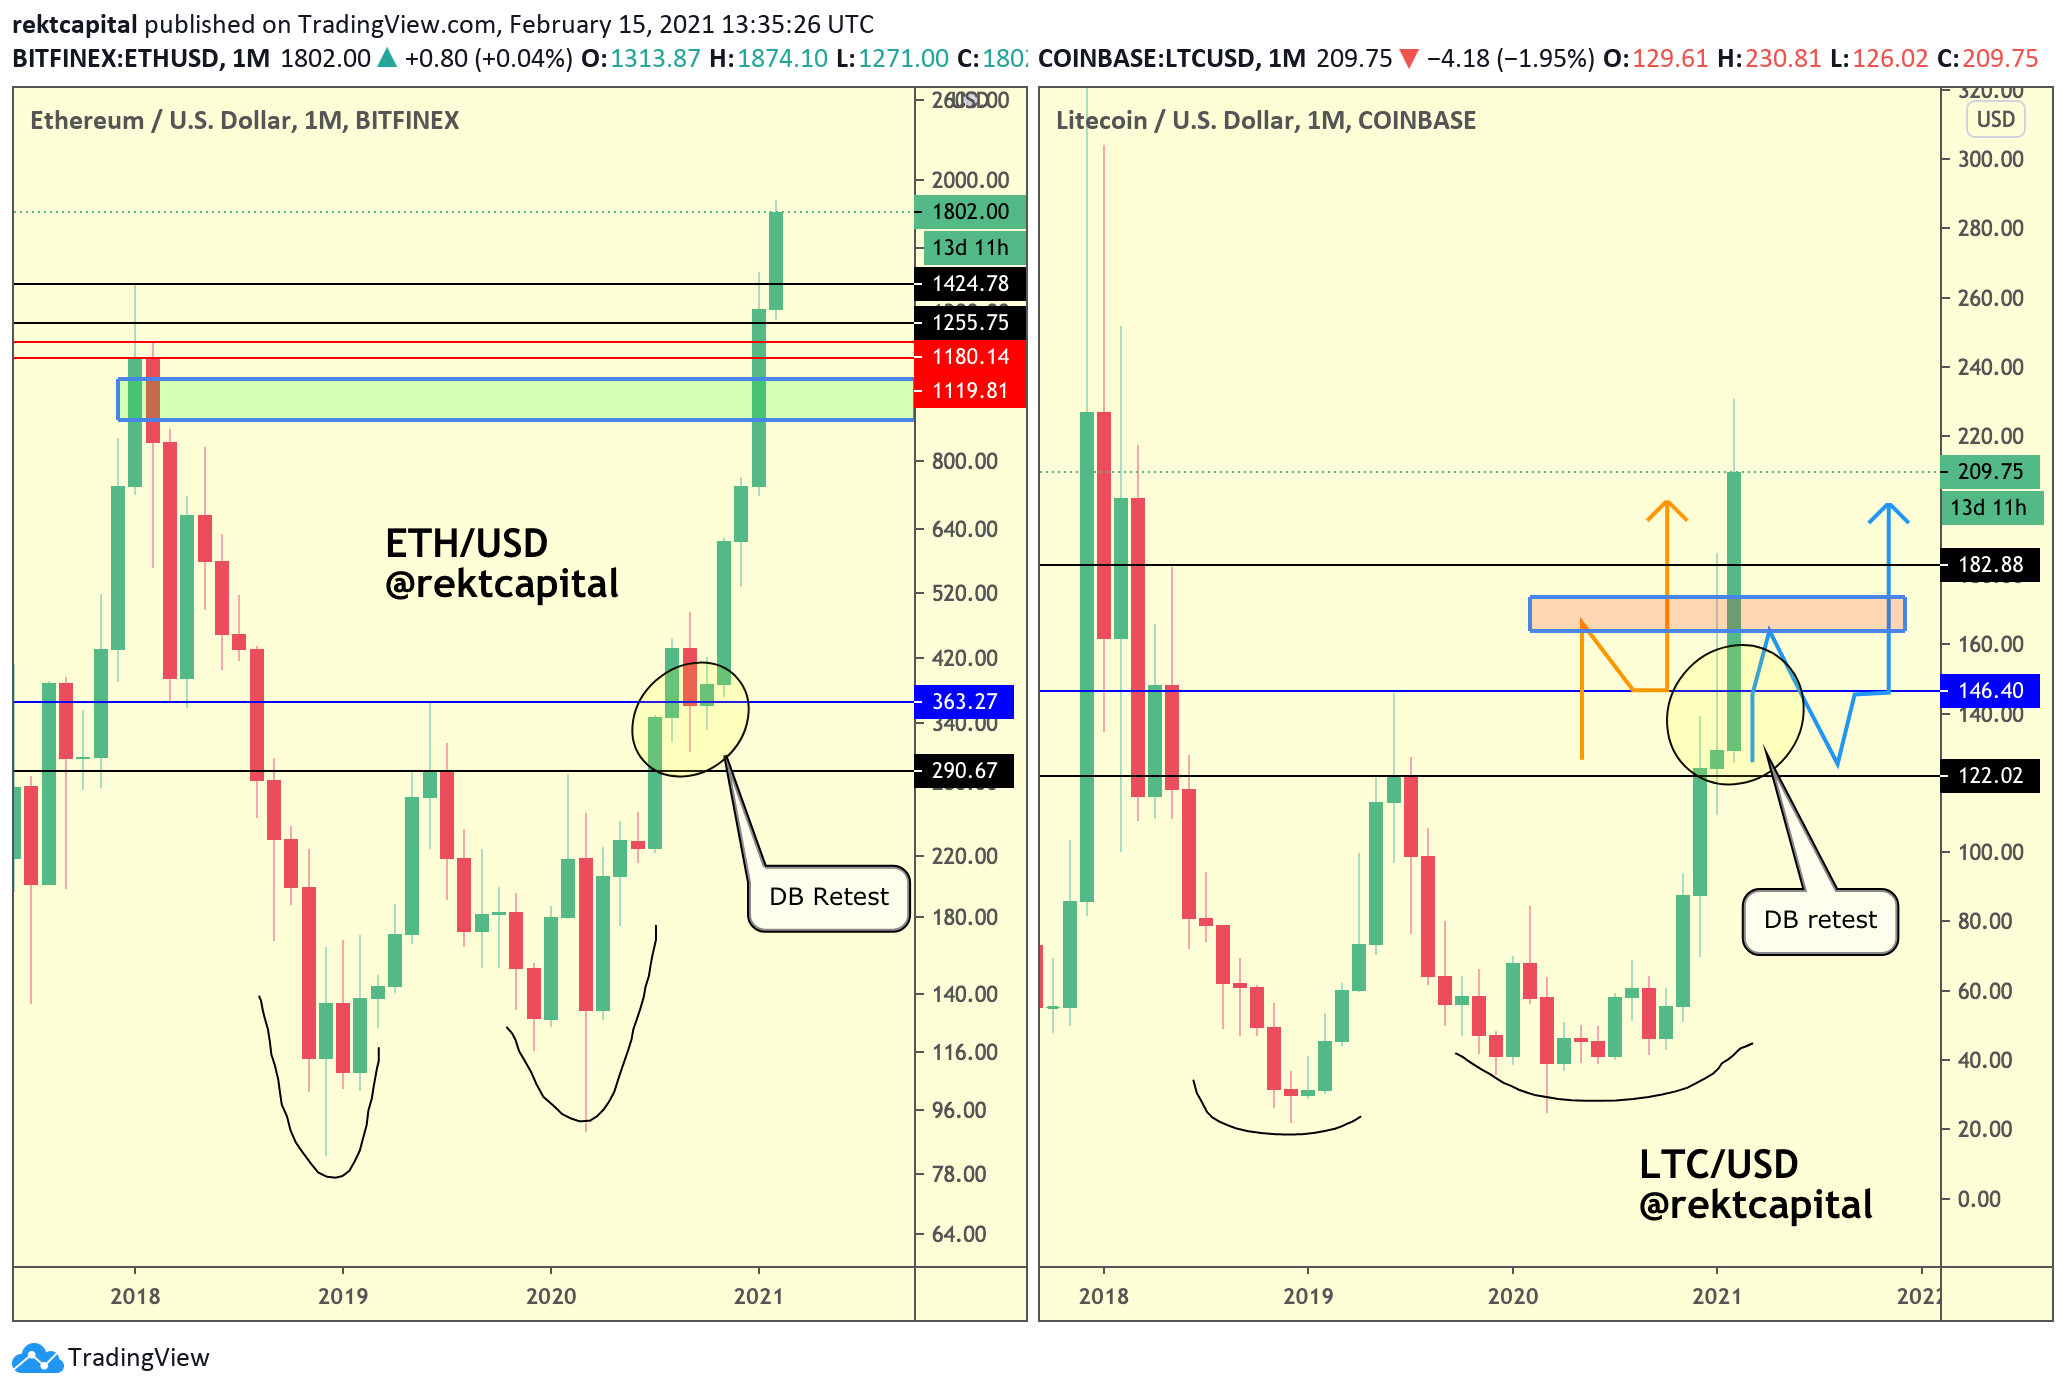
And though Litecoin was also forming a macro Double Bottom formation, LTC was lagging behind in this respect.
But in the several weeks since - Litecoin has continued to perfectly copy Ethereum’s price action:
Another example mentioned in that January newsletter was Bitcoin Cash:
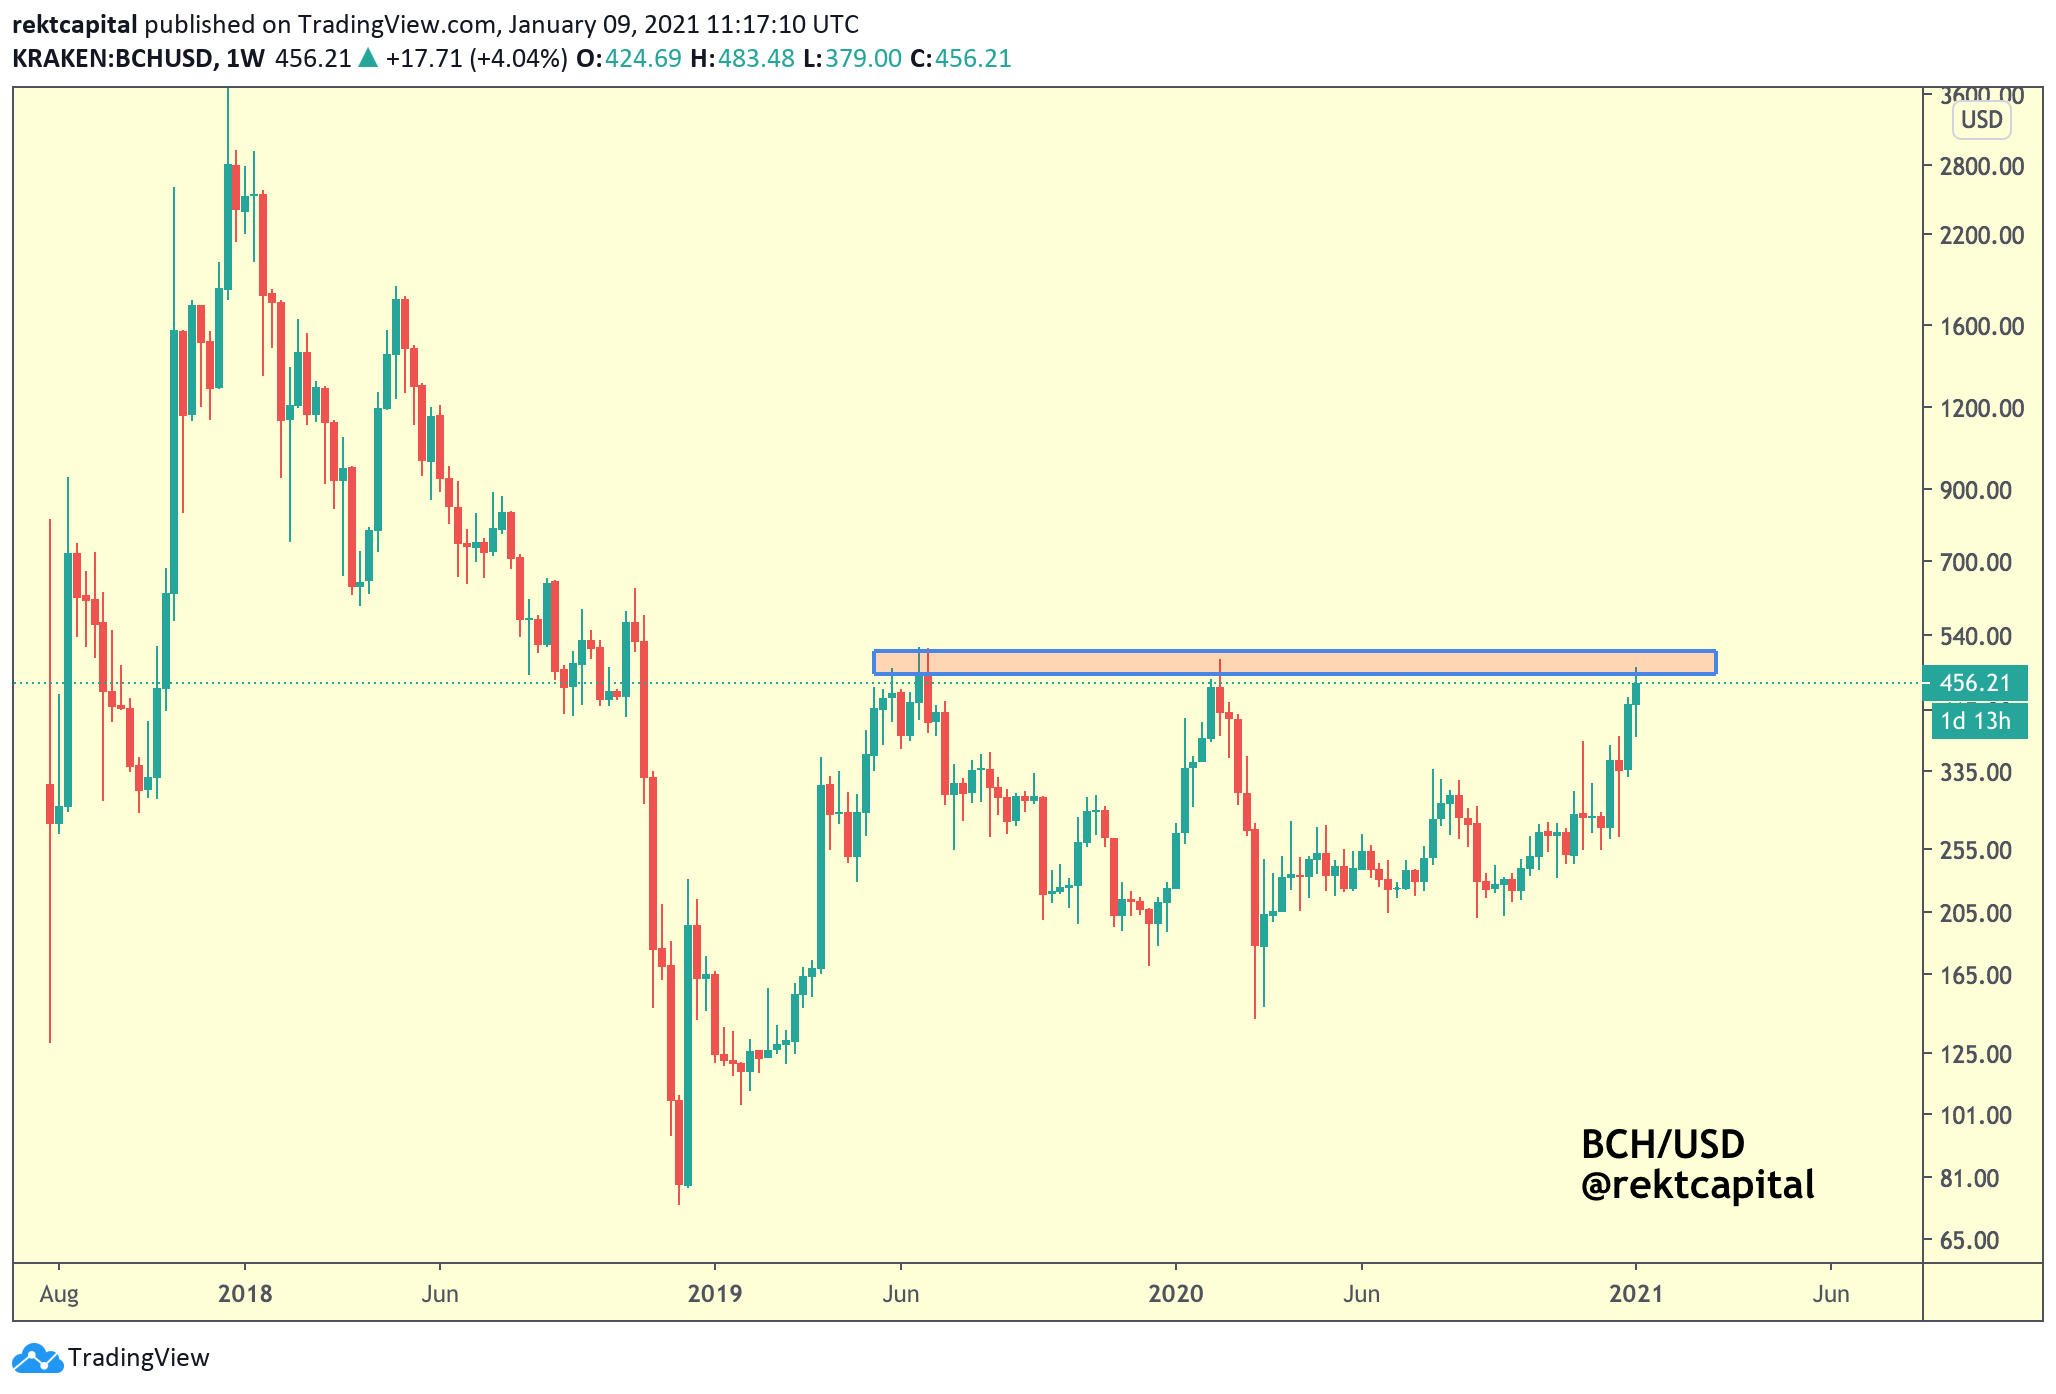
Though not as perfectly as Litecoin, Bitcoin Cash too was mimicking Ethereum’s price action for the most part. BCH was also forming a macro Double Bottom formation.
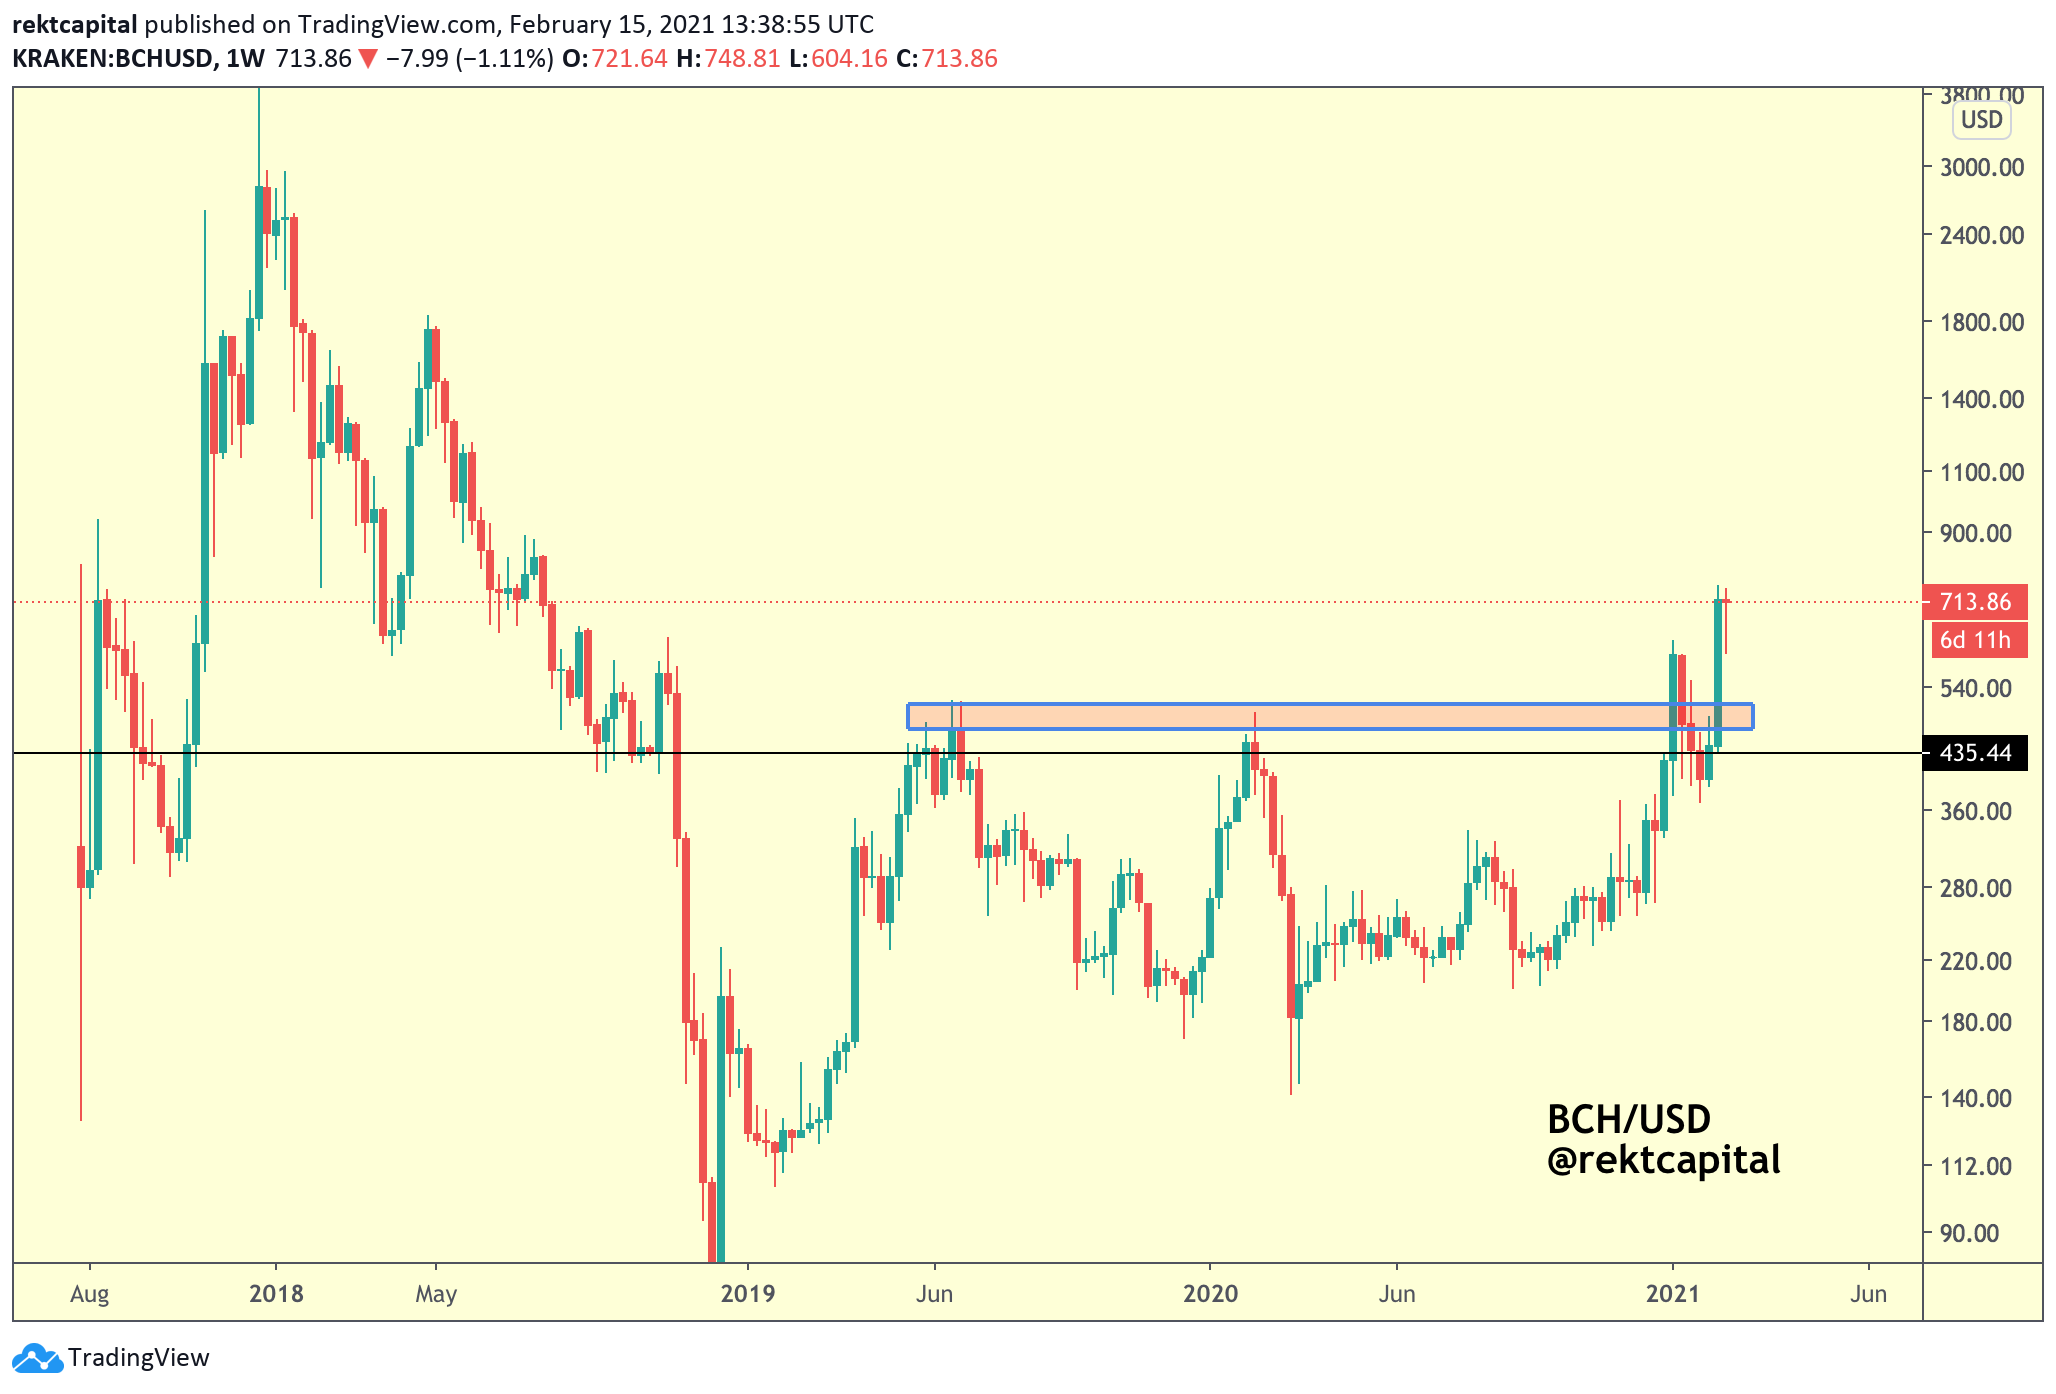
And in the several weeks since that newsletter, BCH has also just broken out from this pattern:
And here’s another Altcoin that was mimicking this Double Bottom formation back in January:
DASH.
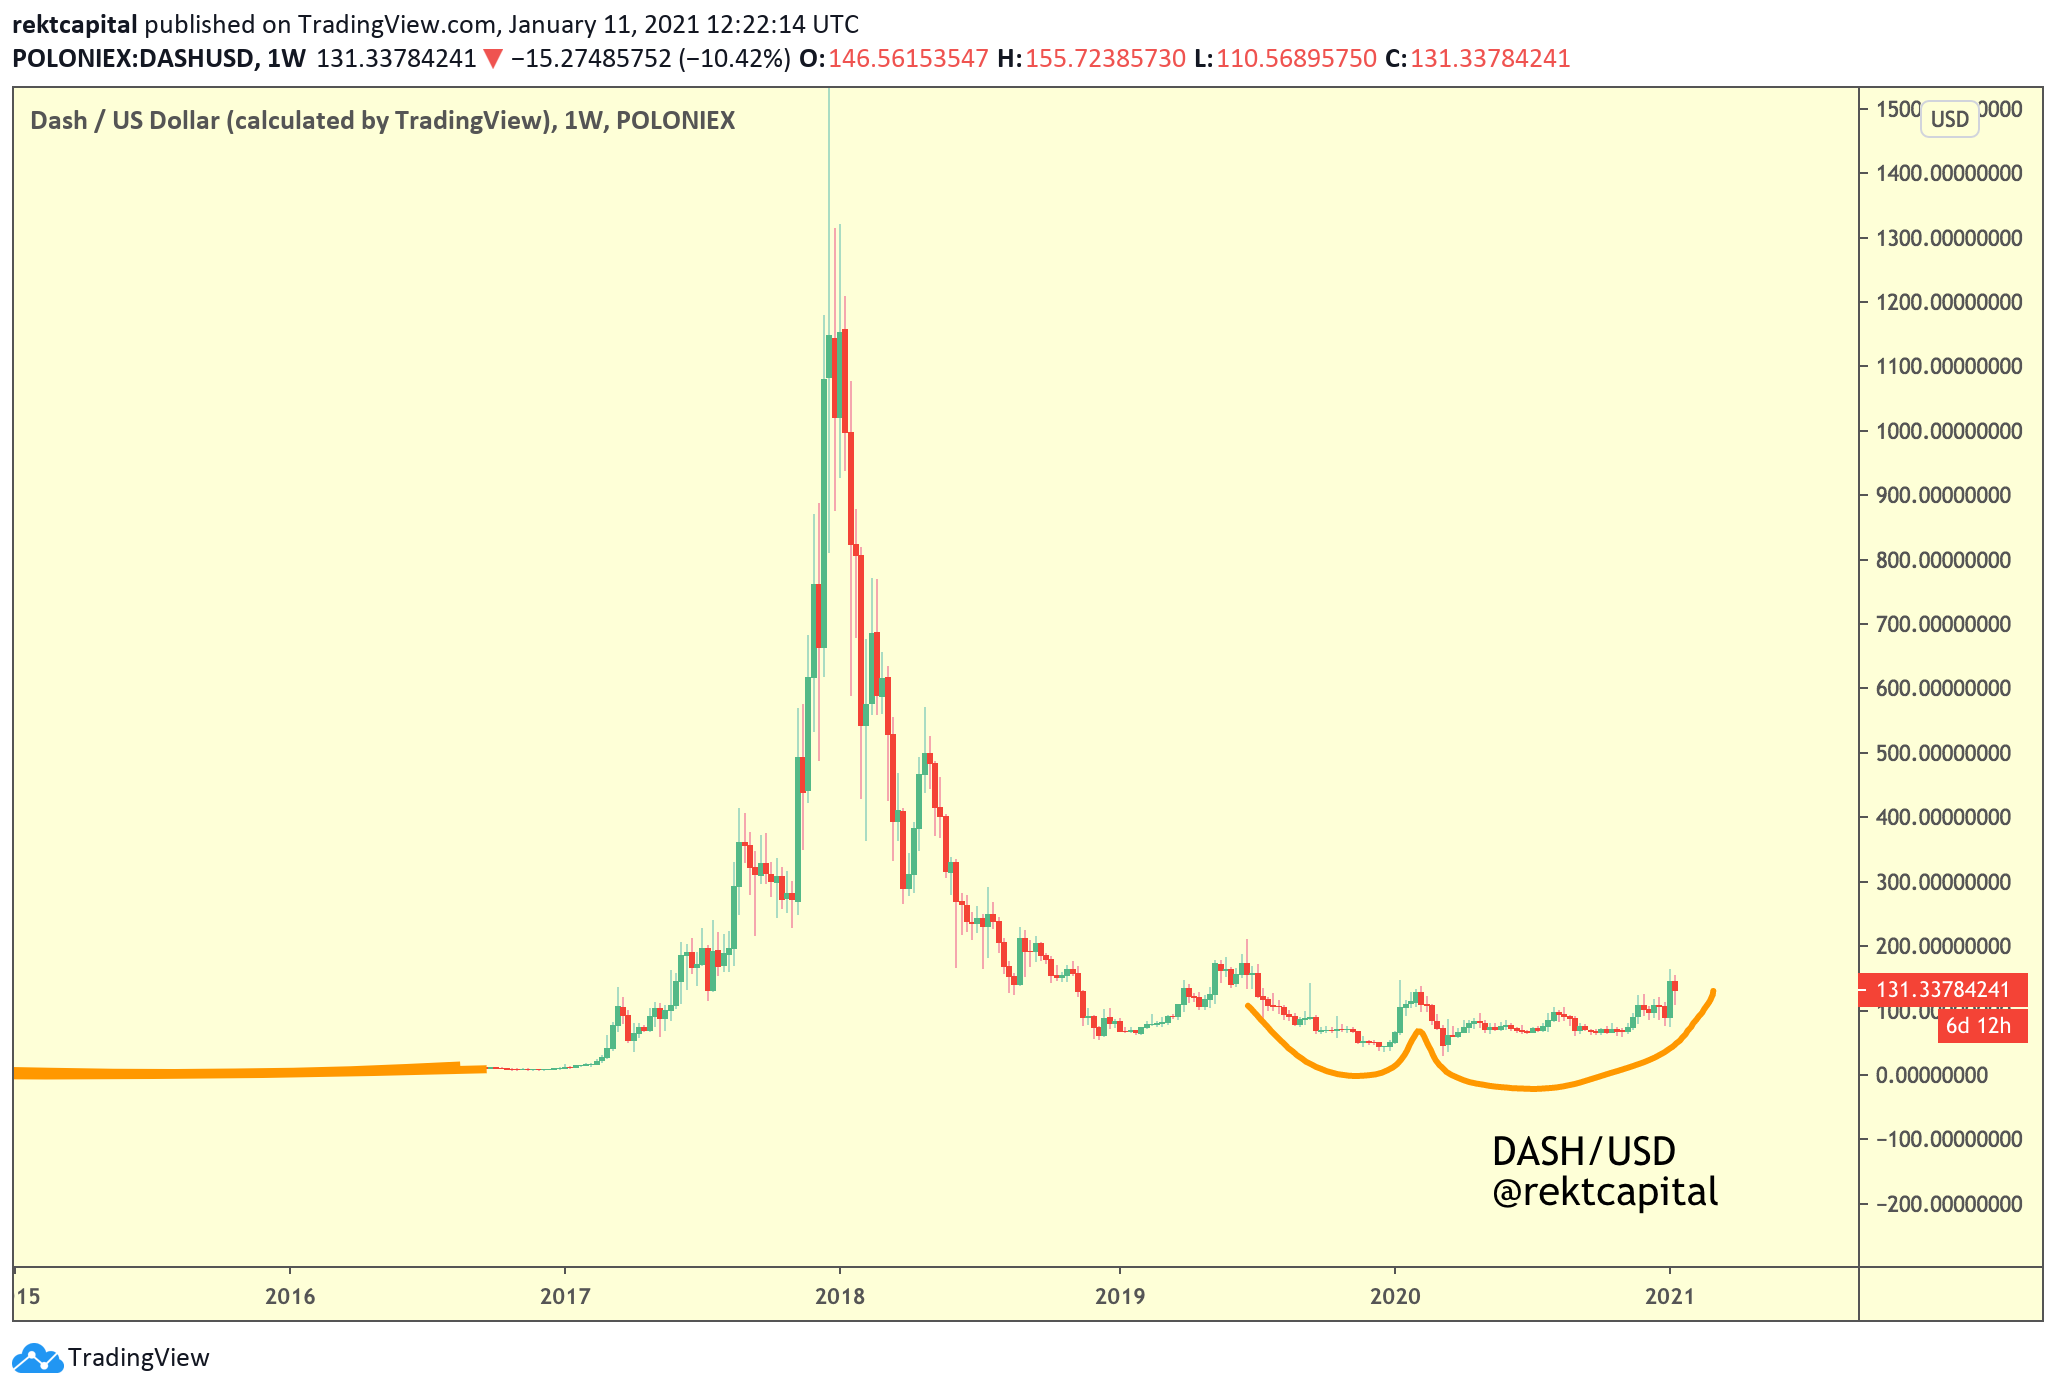
And in the several weeks since - DASH has also validated its Double Bottom:
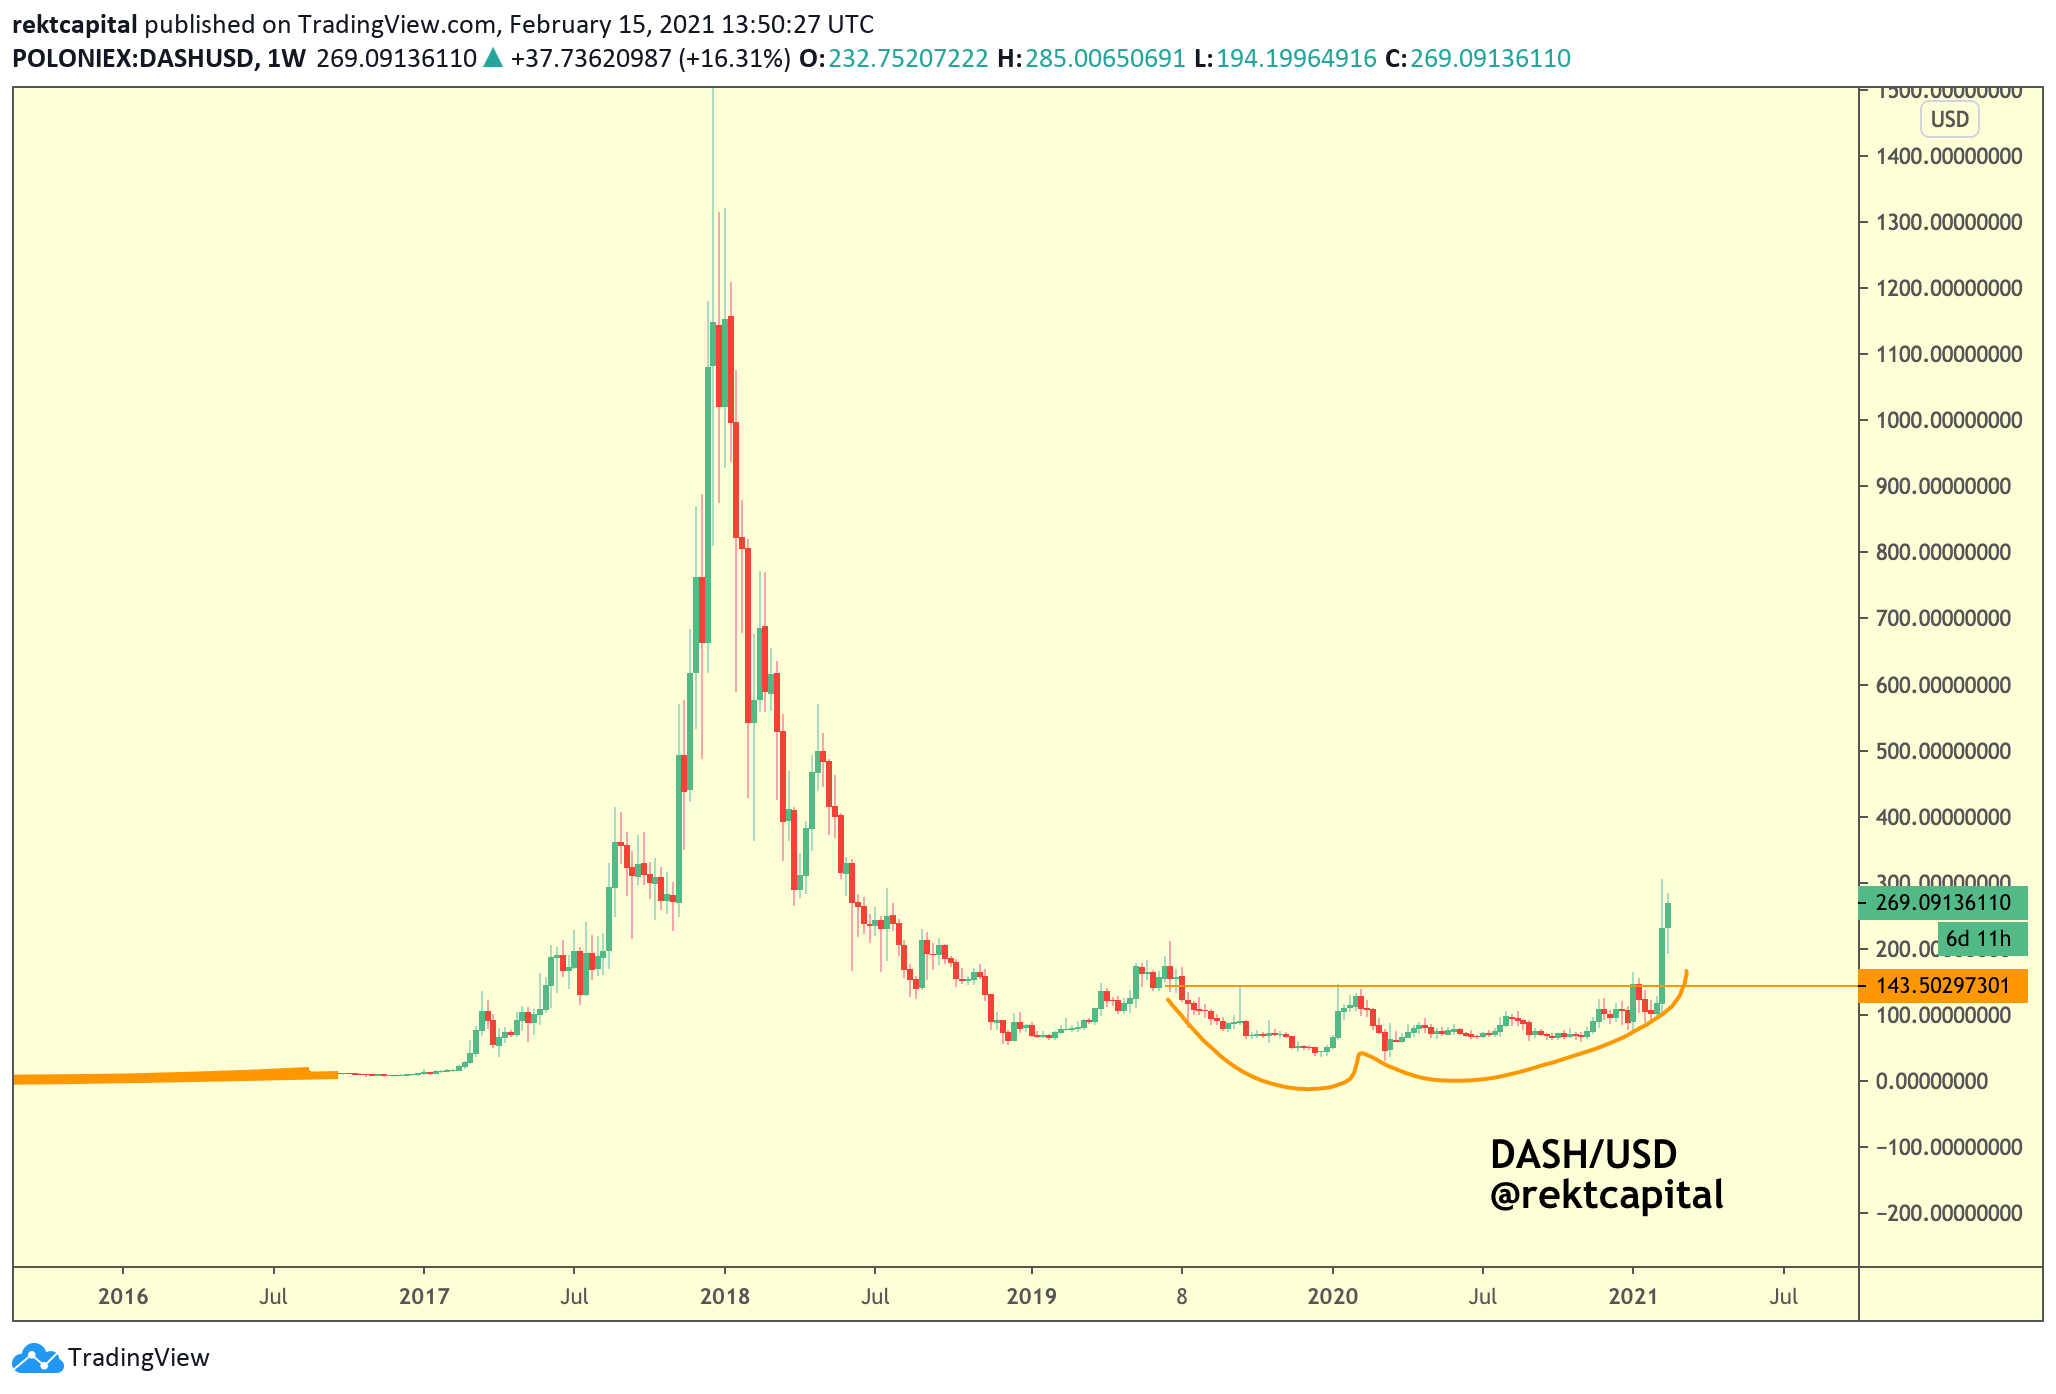
So some Large Caps are closely following Ethereum, so much so that their market structures are identical, just at different phases in their own respective cycles.
But as you can see - DASH’s Double Bottom isn’t perfect if we compare it to the Double Bottom that LTC is forming with respect to ETH.
Some Altcoins are just painted differently, like DASH/USD. And though DASH won’t blatantly copy Ethereum’s market structure, it will still follow Ethereum - just in its own way; the only way it knows how.
Via its own historical cyclicality…
The DASH/USD Market Cycle
In late November 2020, I shared a tweet describing DASH’s historical price cyclicality:
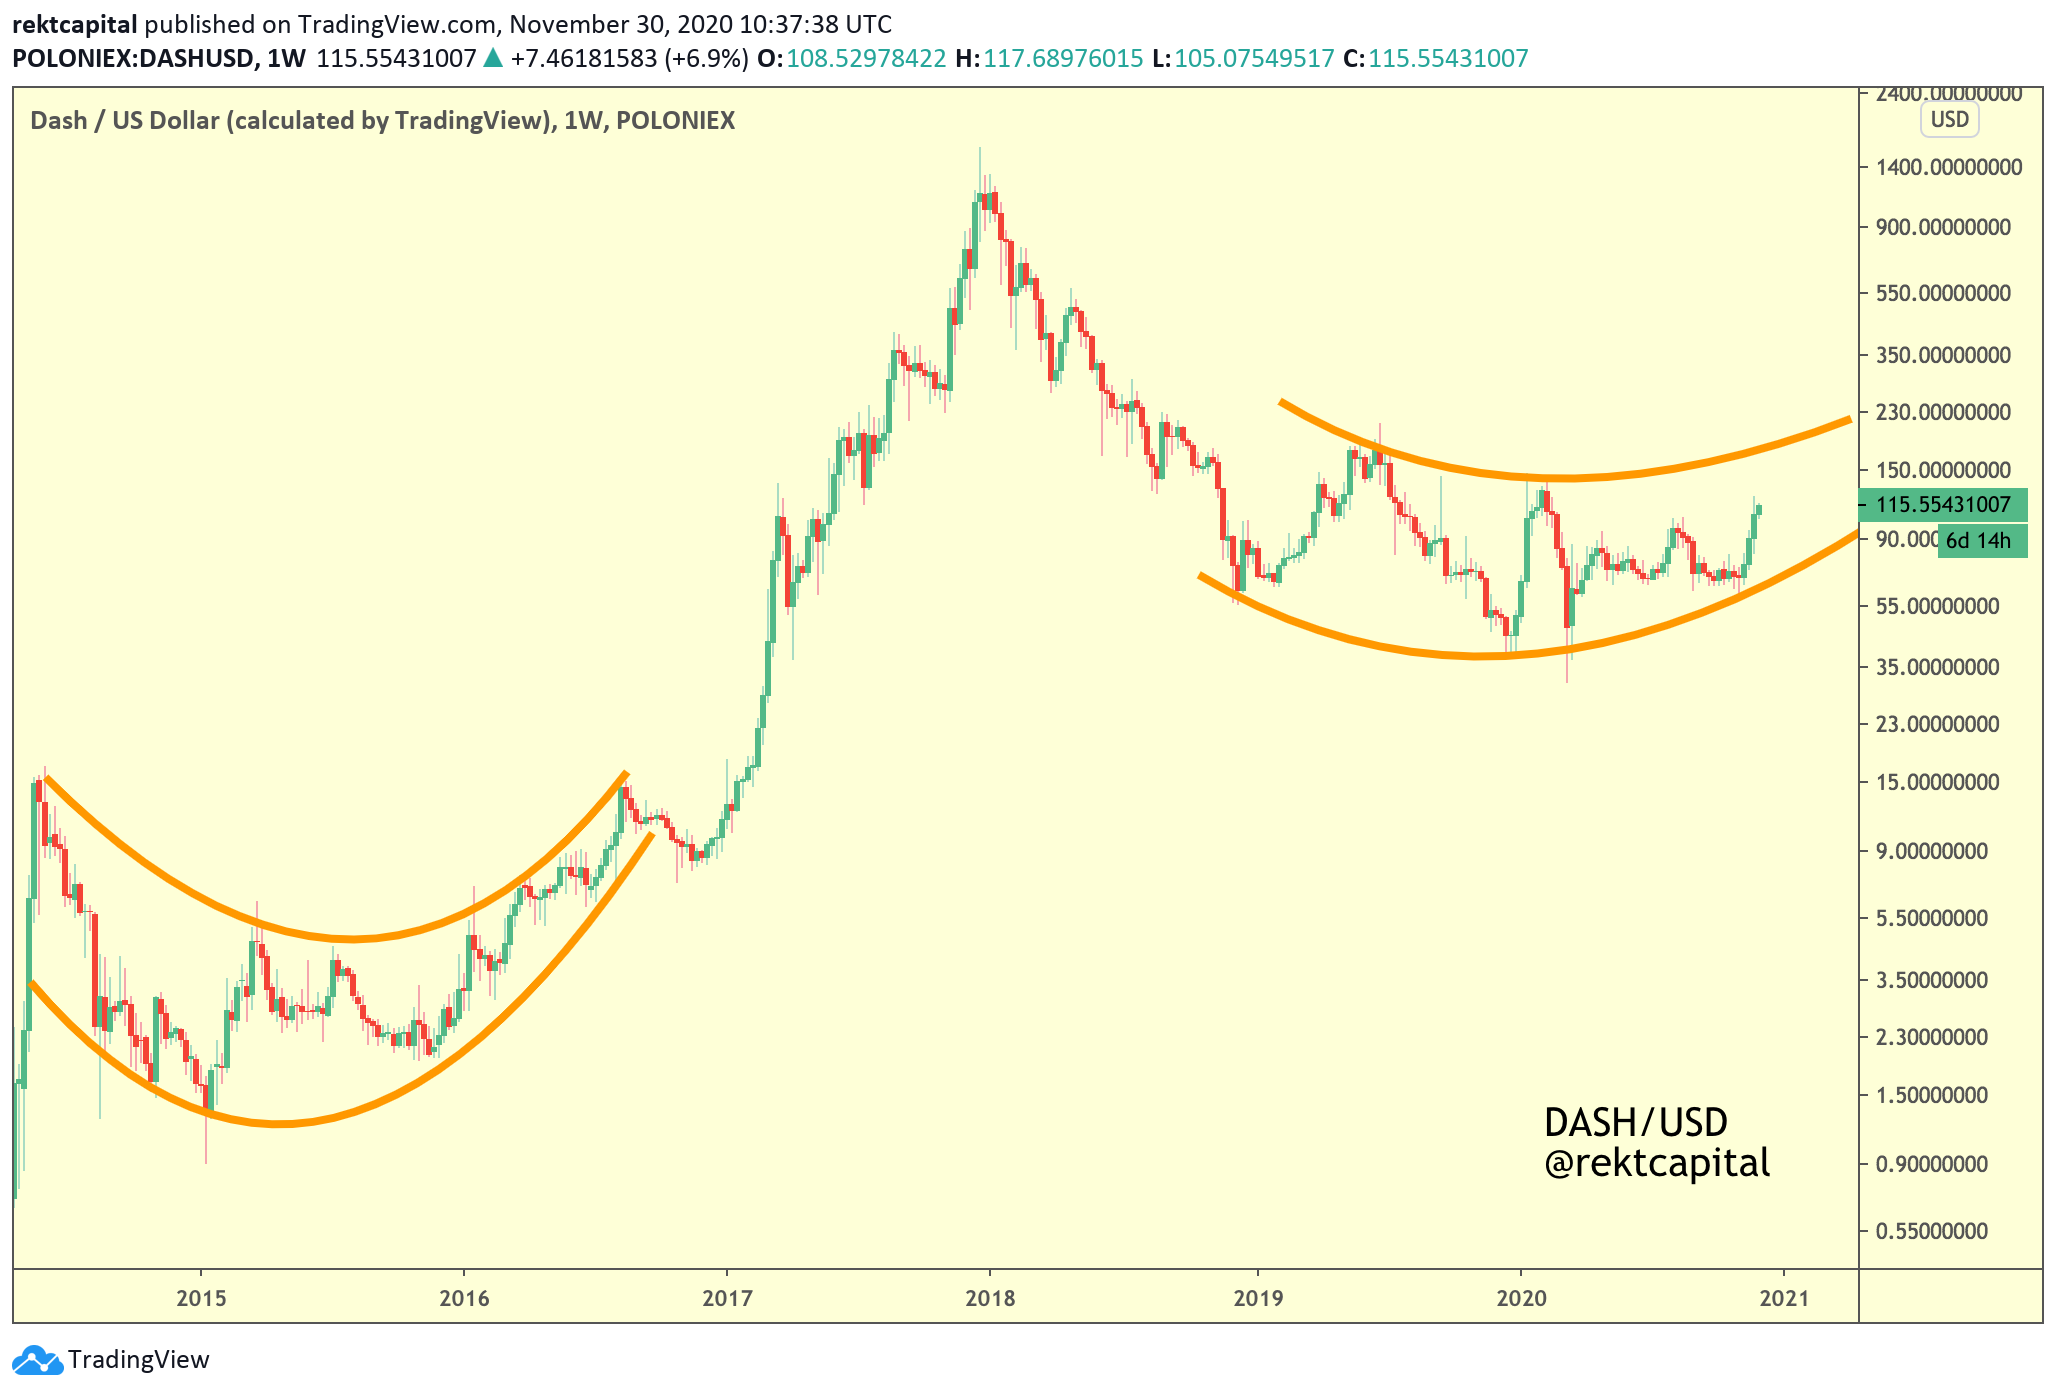
DASH tends to form parabolic accumulation ranges whereby price declines, bottoms, and then finally reverses in a U-Shaped trend reversal, forming a U-Shaped parabola support.
Dogecoin is very similar in that respect and I’ll explain the reason why this matters in the context of DASH’s price action:
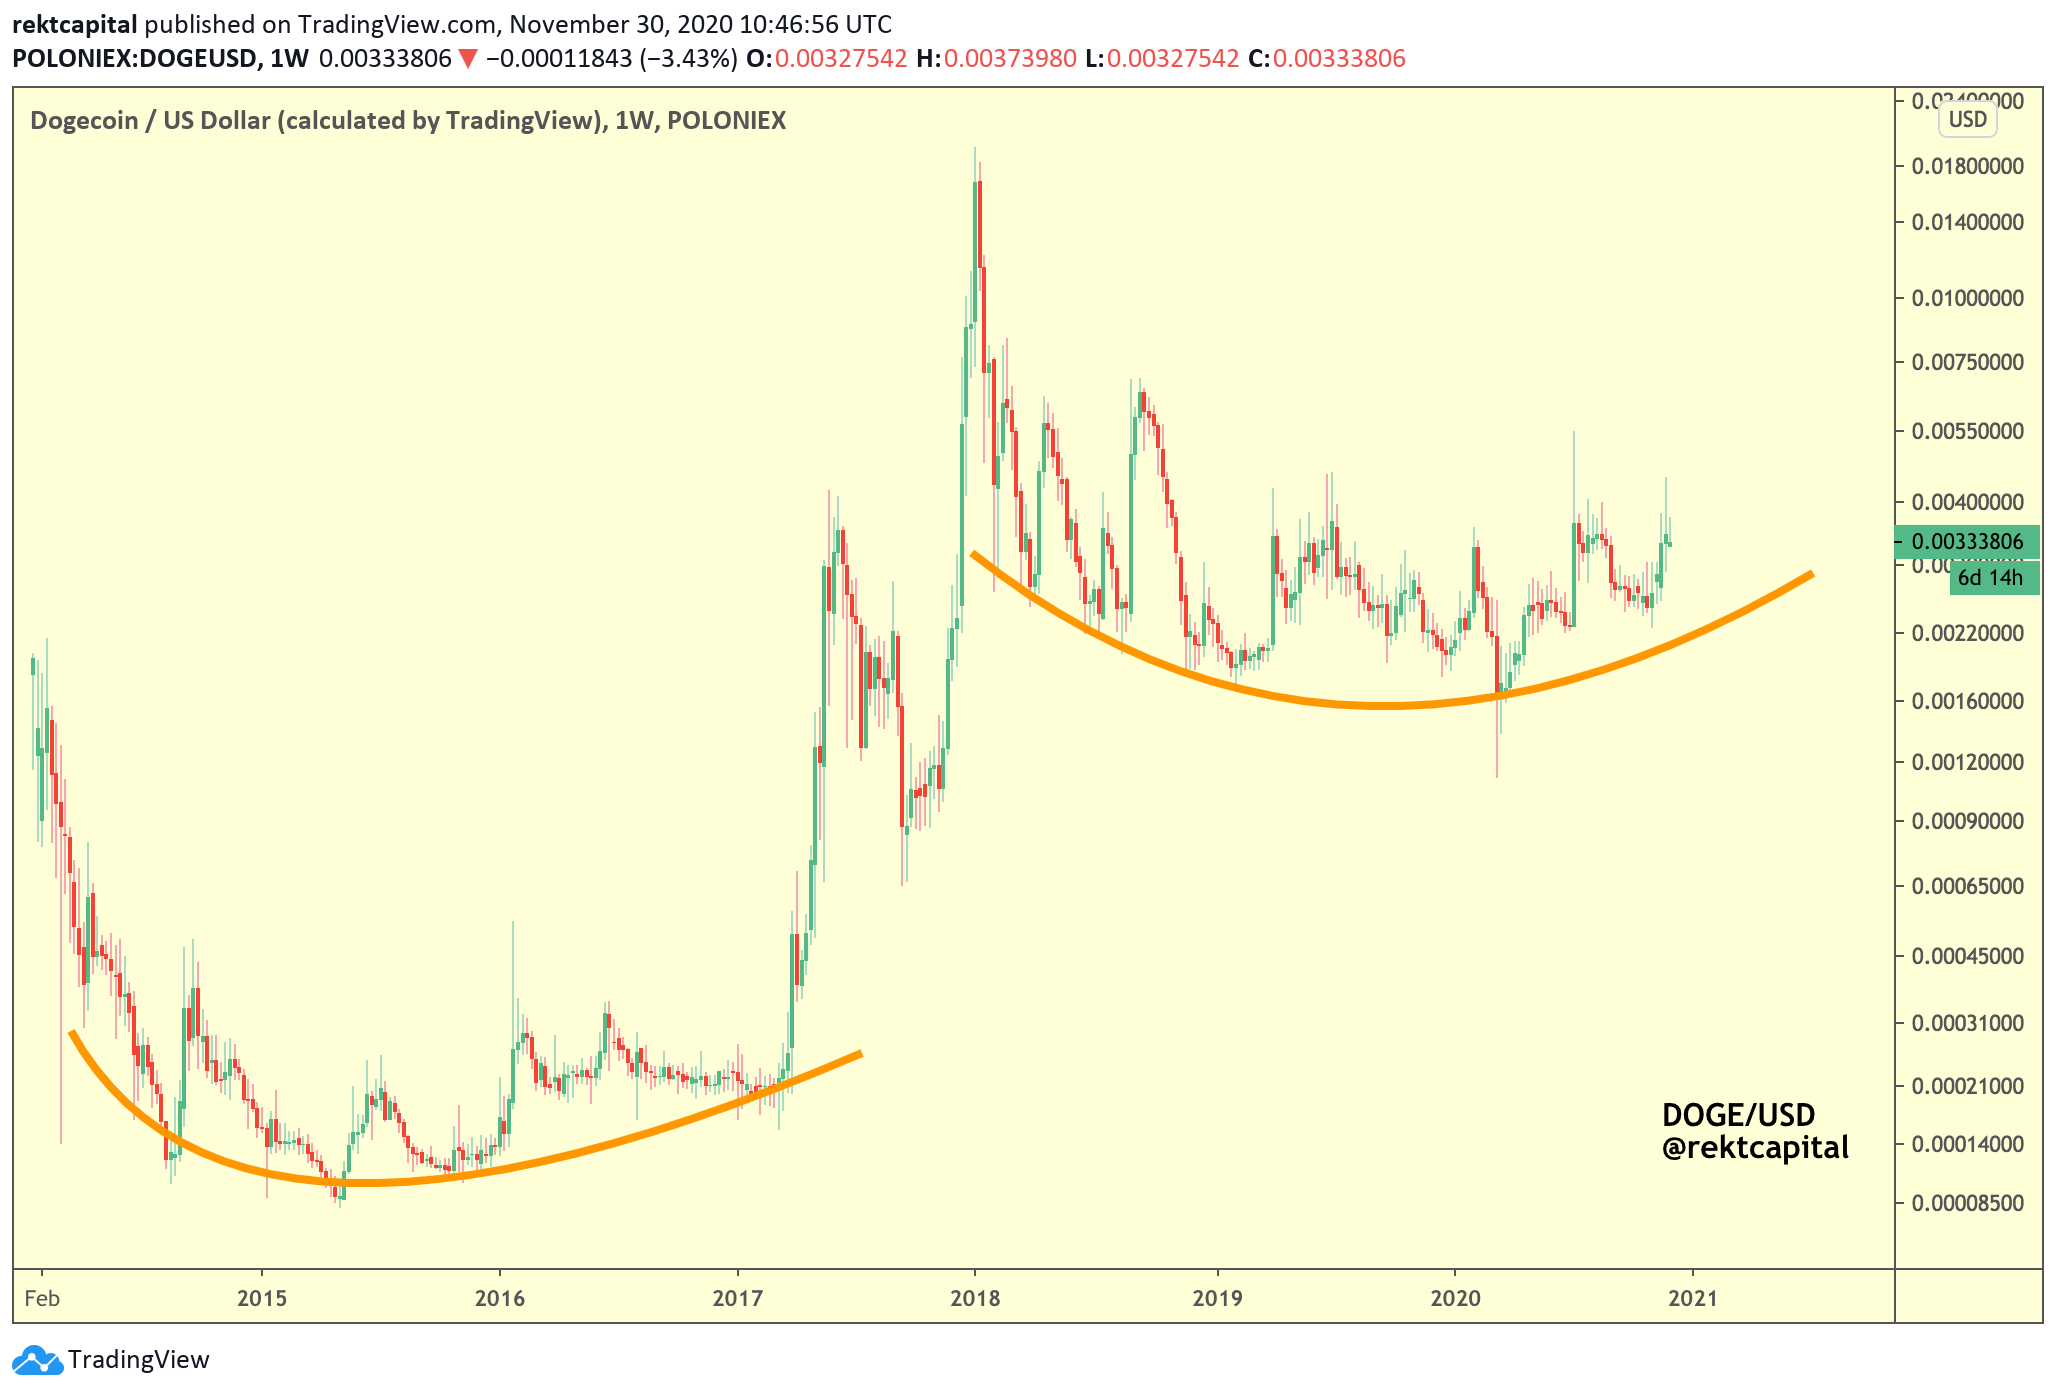
In a late November 2020 edition of the Rekt Capital newsletter, DOGE/USD was forming its own parabola support, much like DASH/USD was.
And the reason that DOGE matters is because Dogecoin also has a historical cyclicality, both on its USD pair and its BTC pair:
Since the above tweet Dogecoin kickstarted a new +1150% DOGE cycle:
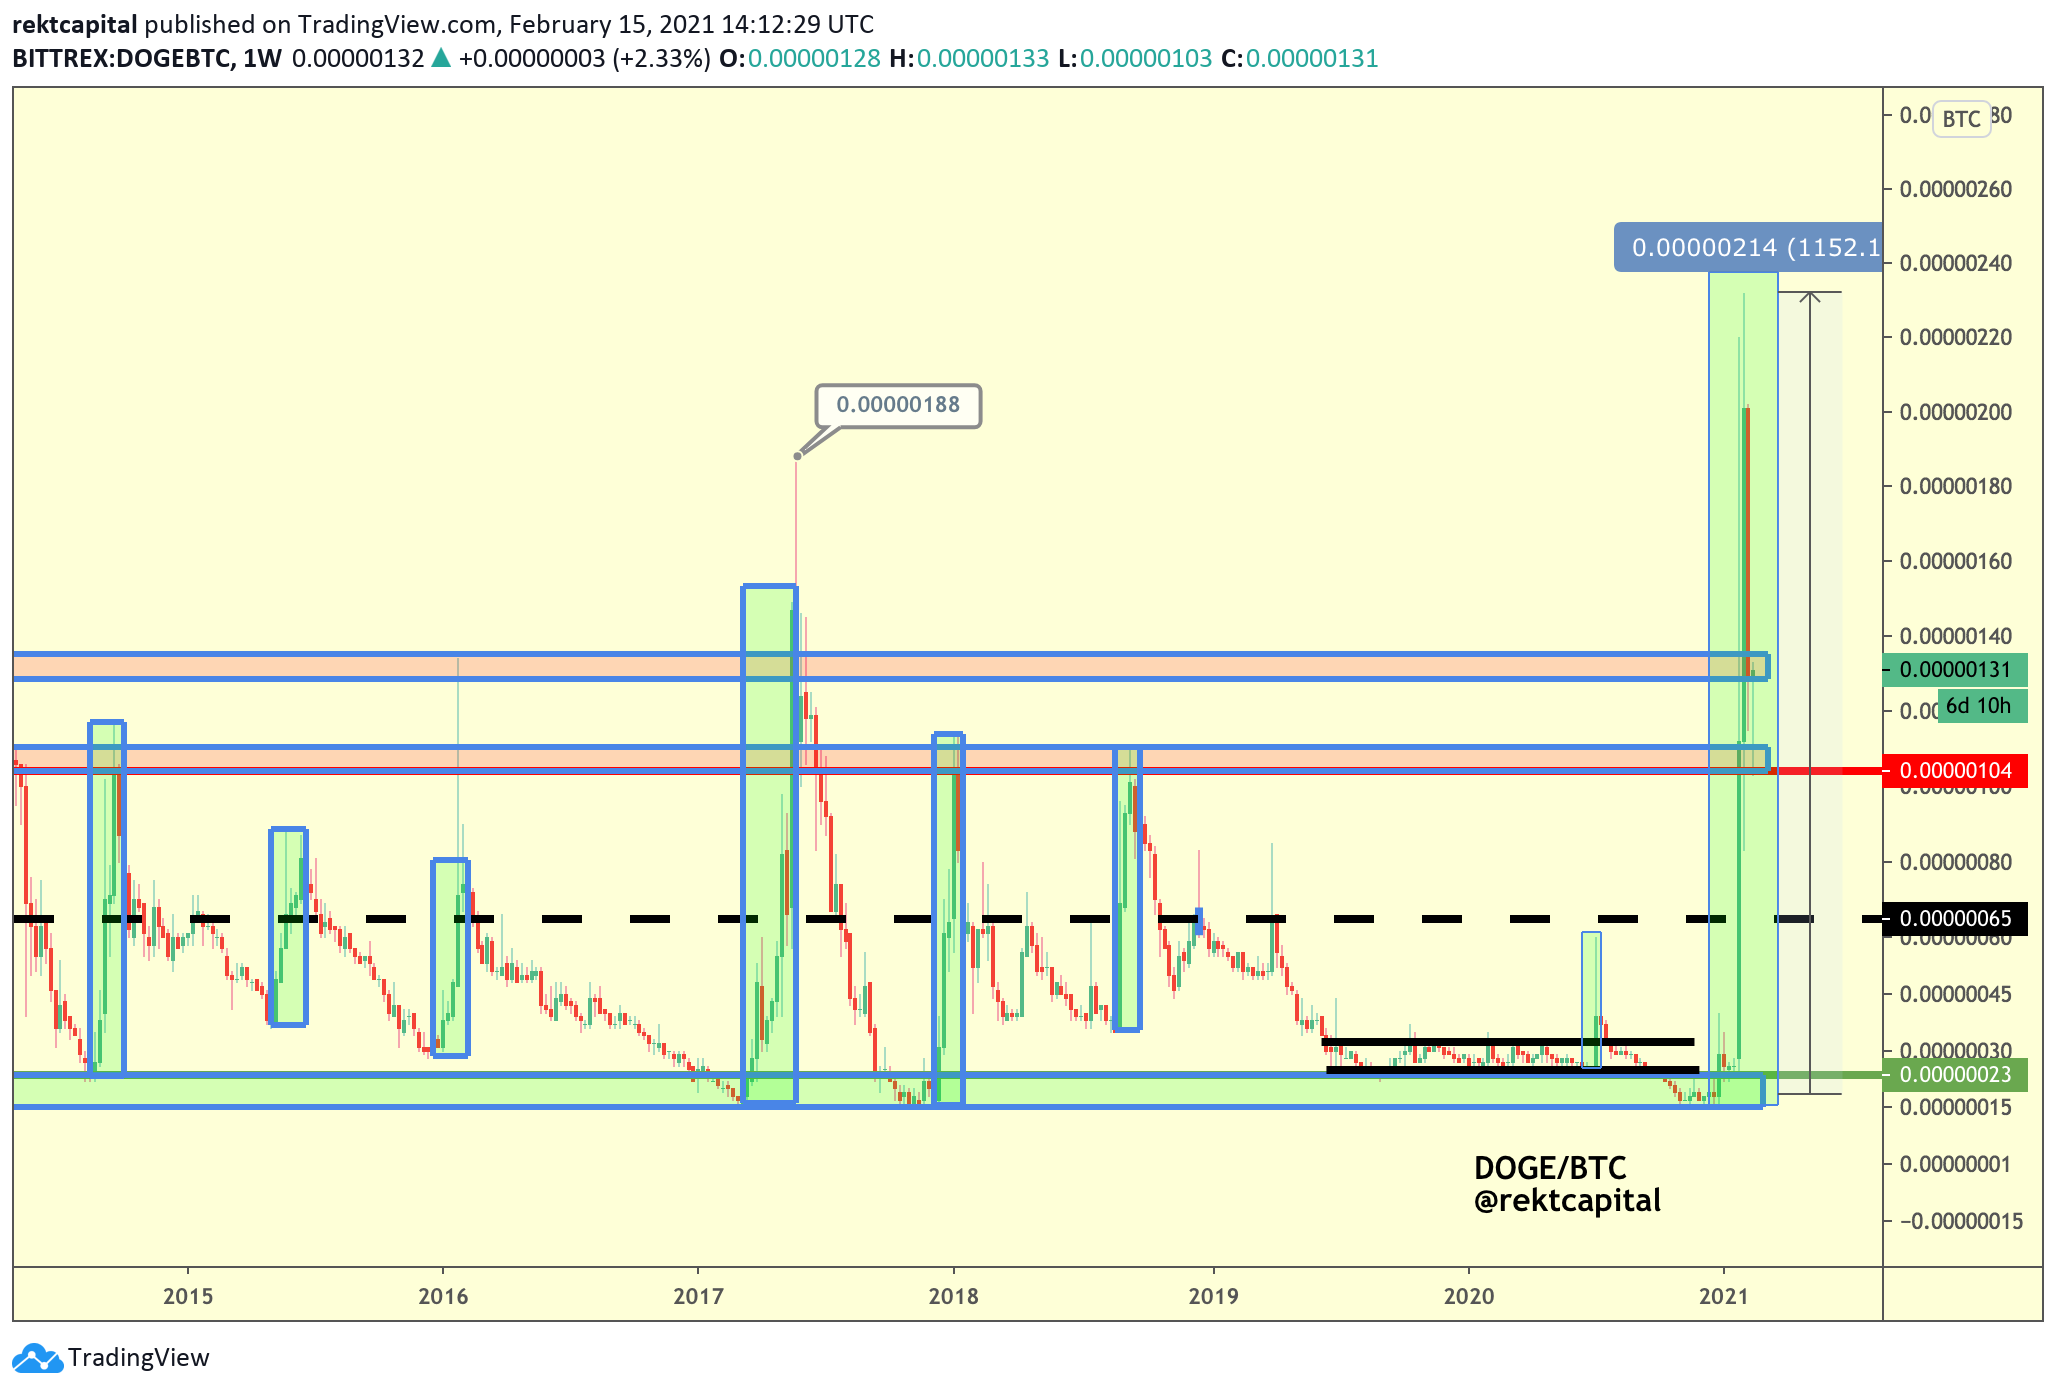
And the reason this matters in the context of DASH and other Altcoins is because Dogecoin cycles confirm increases in Altcoin Market Cap:
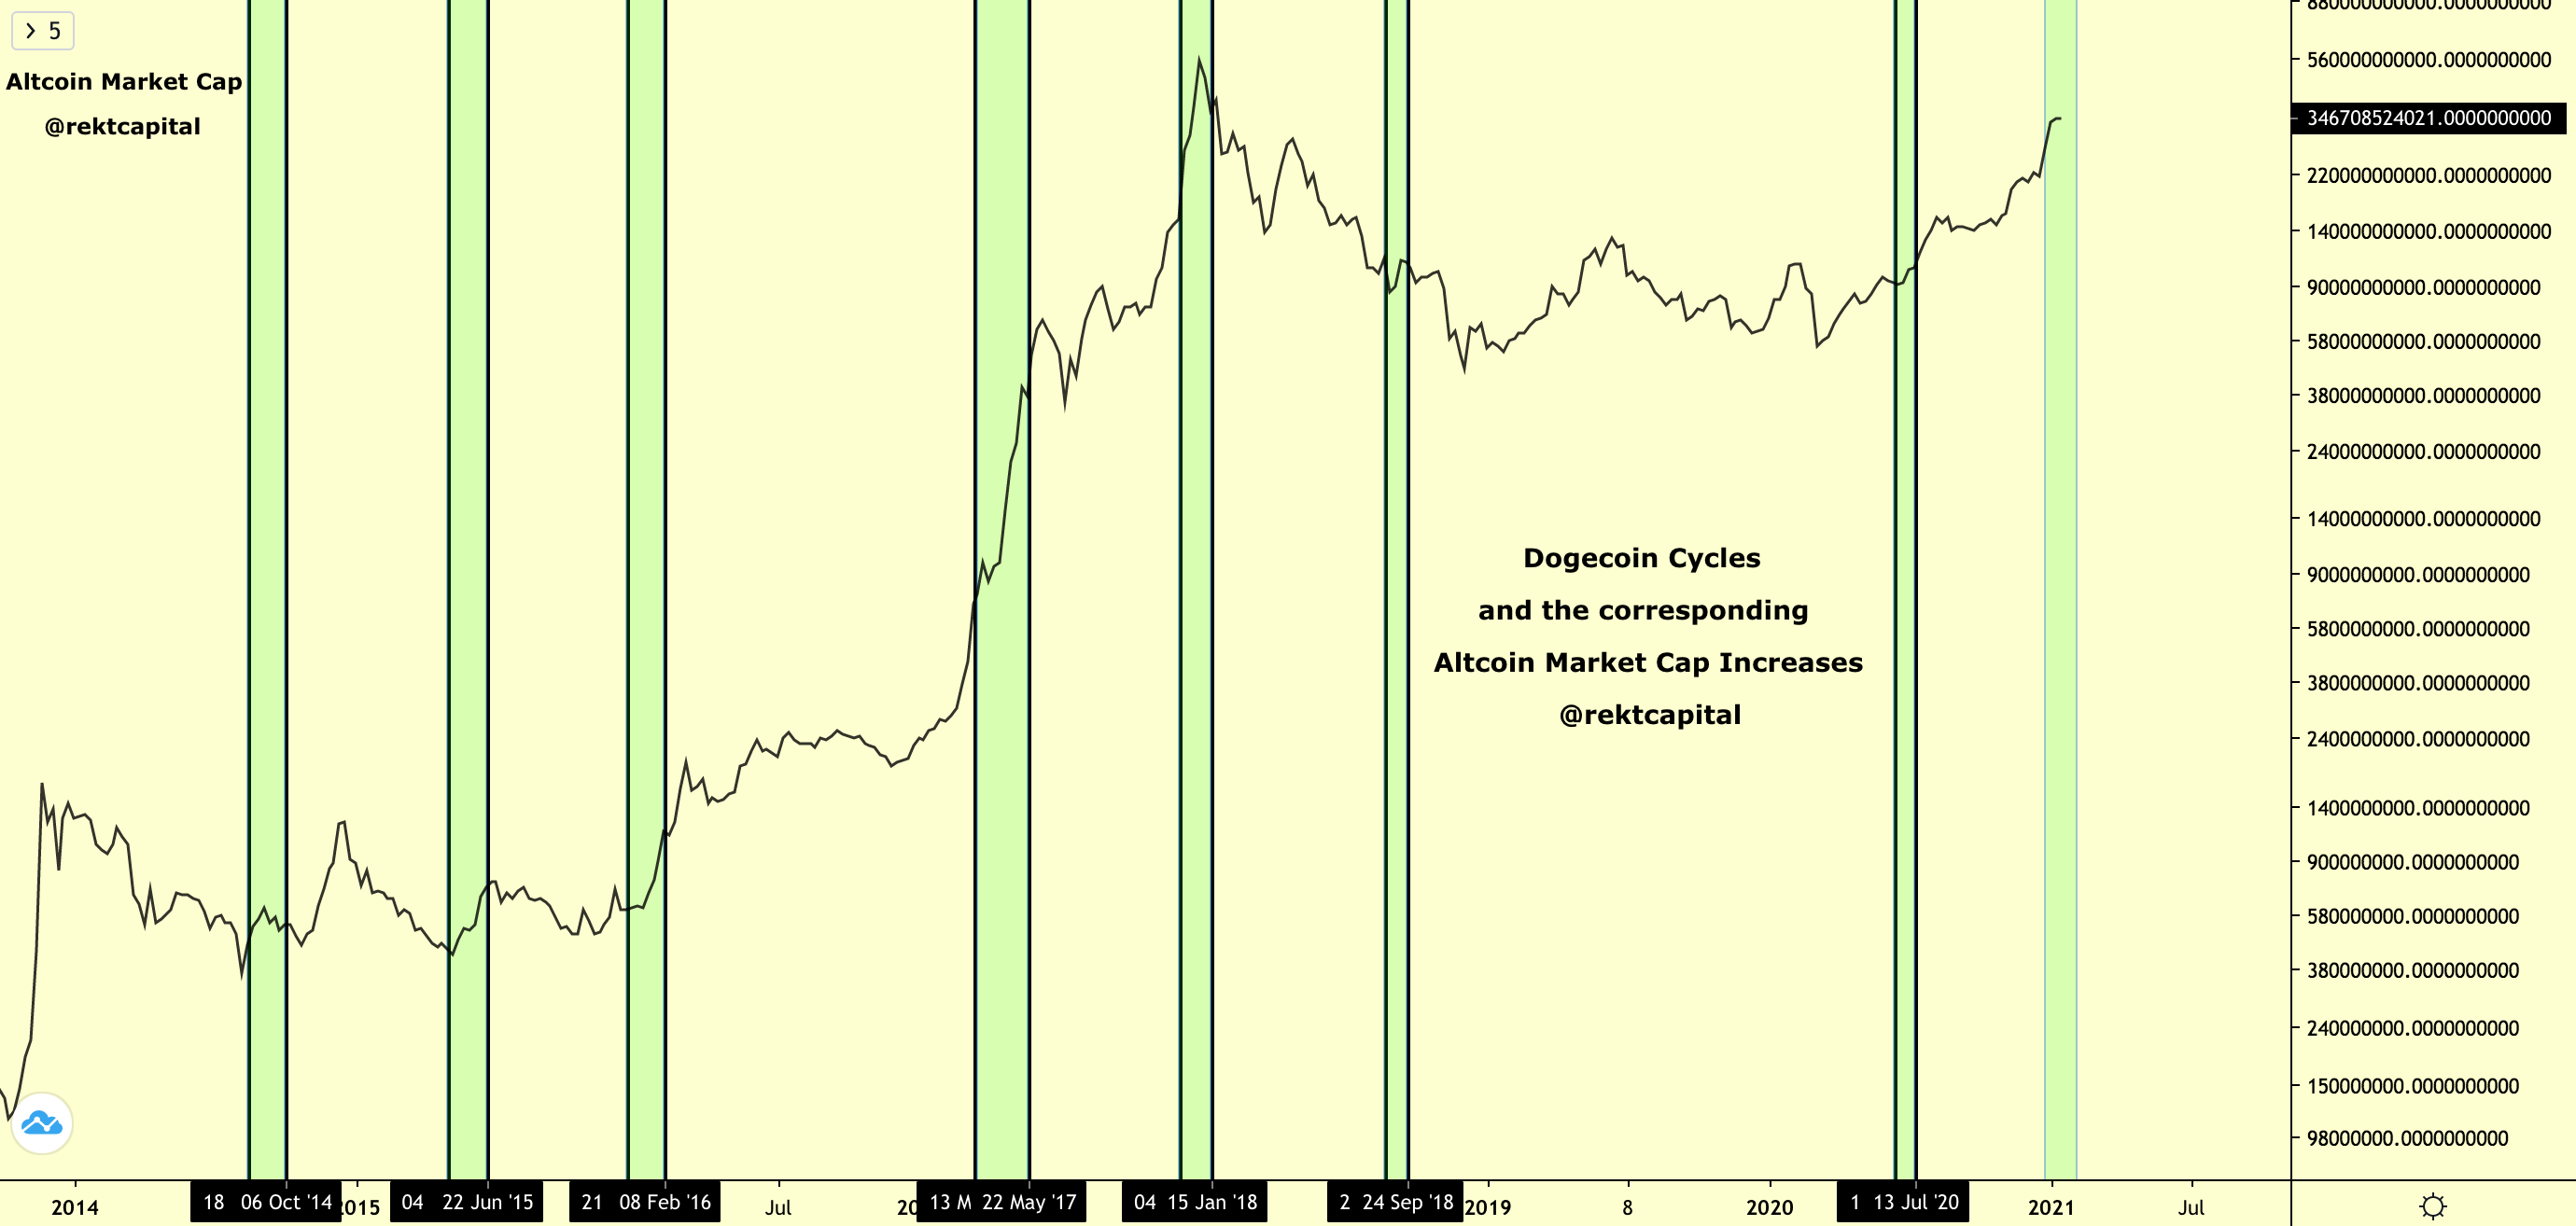
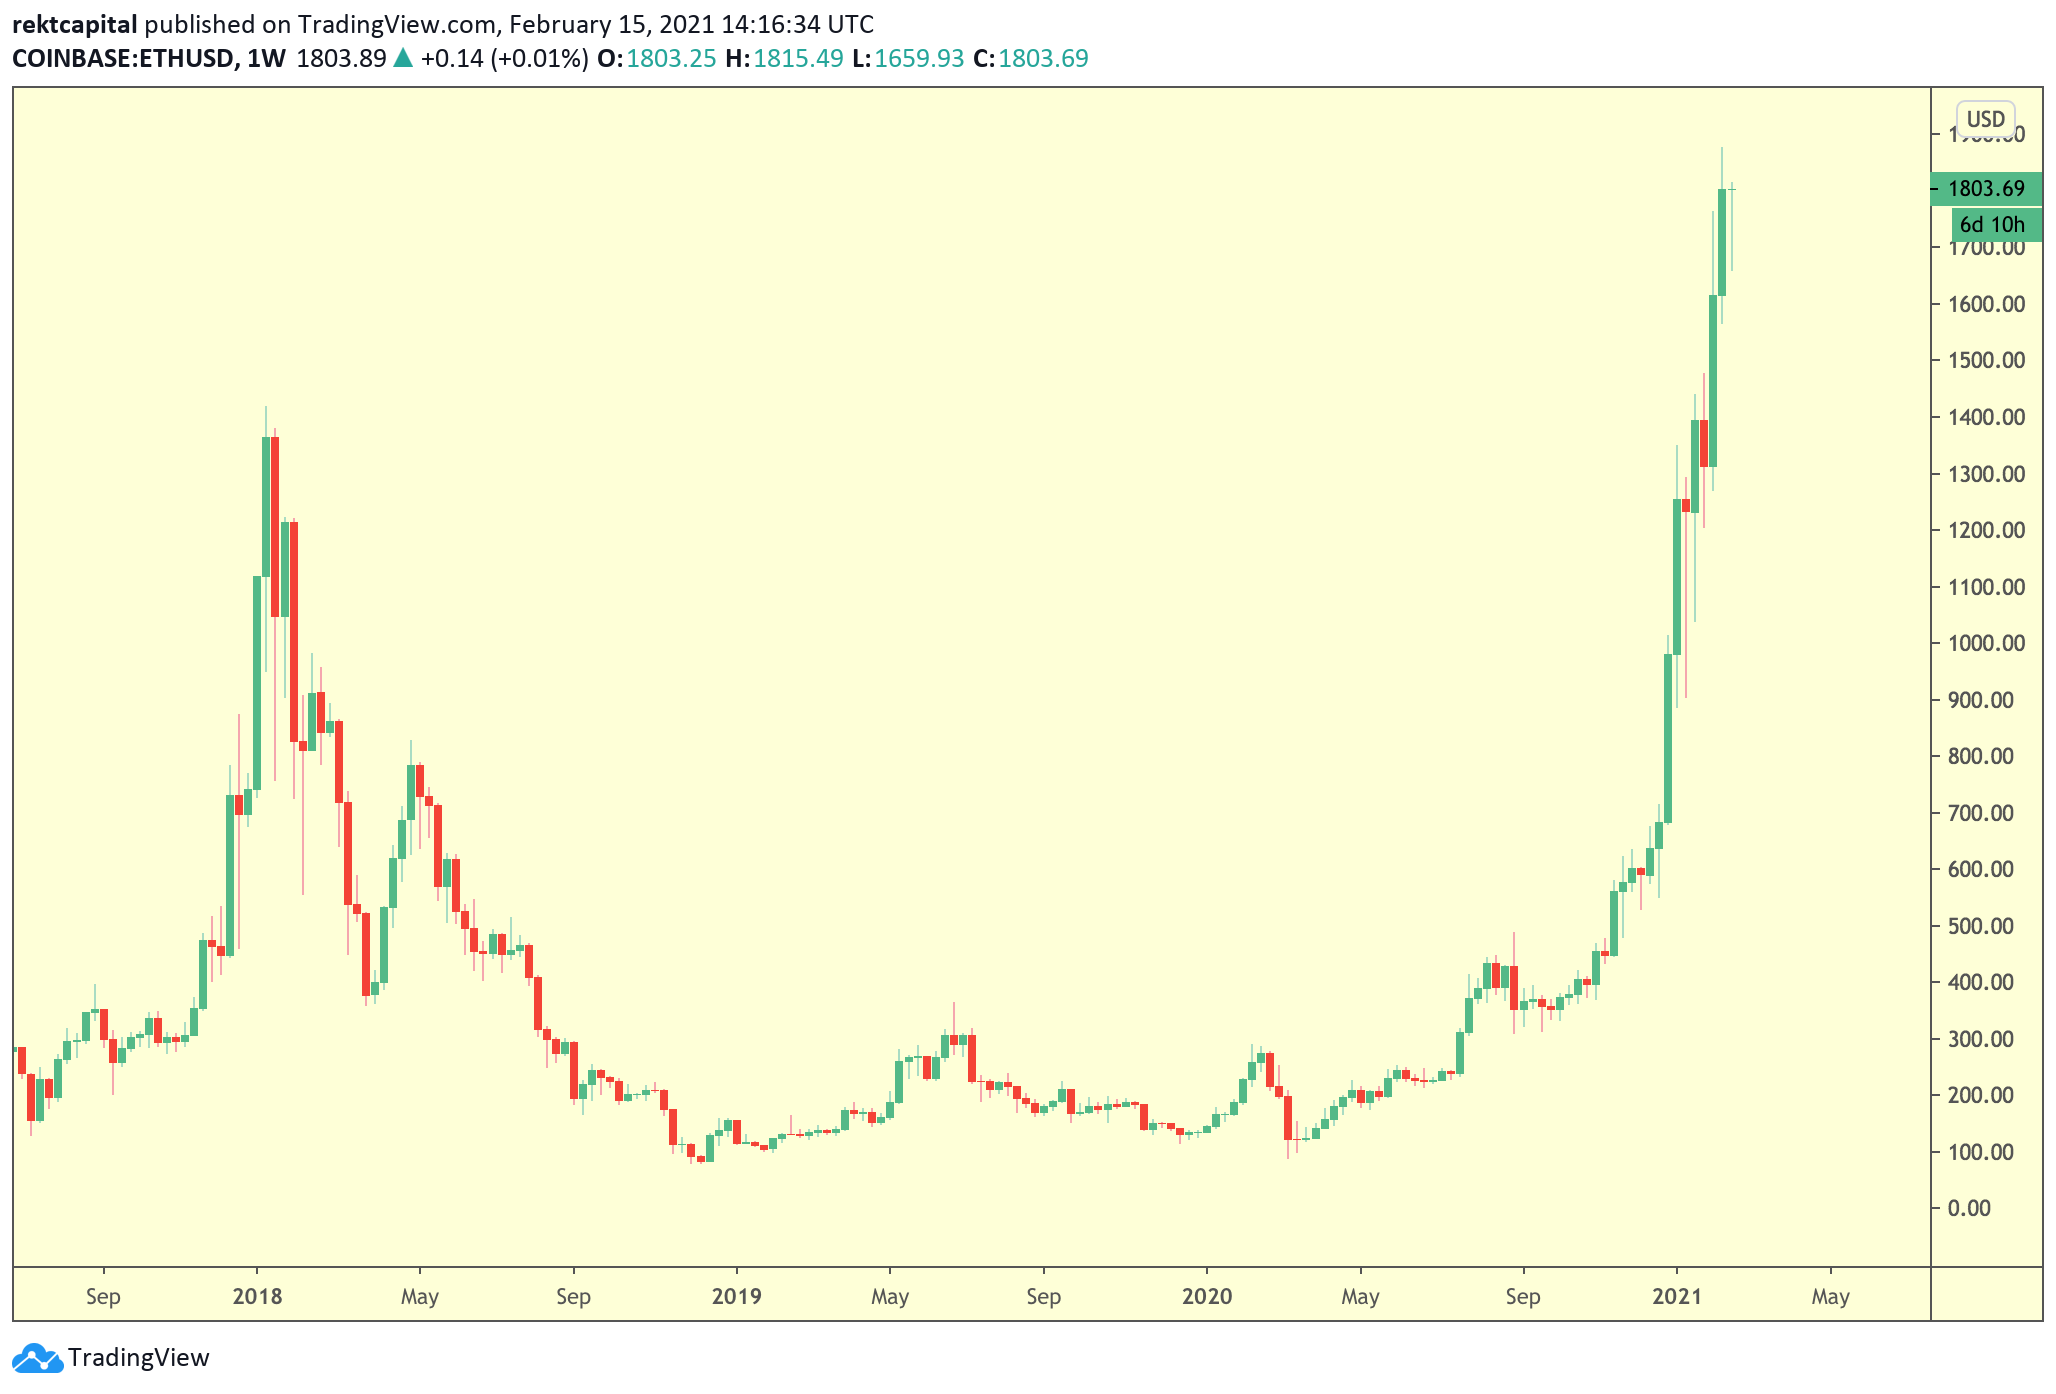
And much like Litecoin, Bitcoin Cash, or DASH - the Altcoin Market Cap chart alone is also following Ethereum.
Here’s the ETH/USD price chart:
And here’s the Altcoin Market Cap chart:
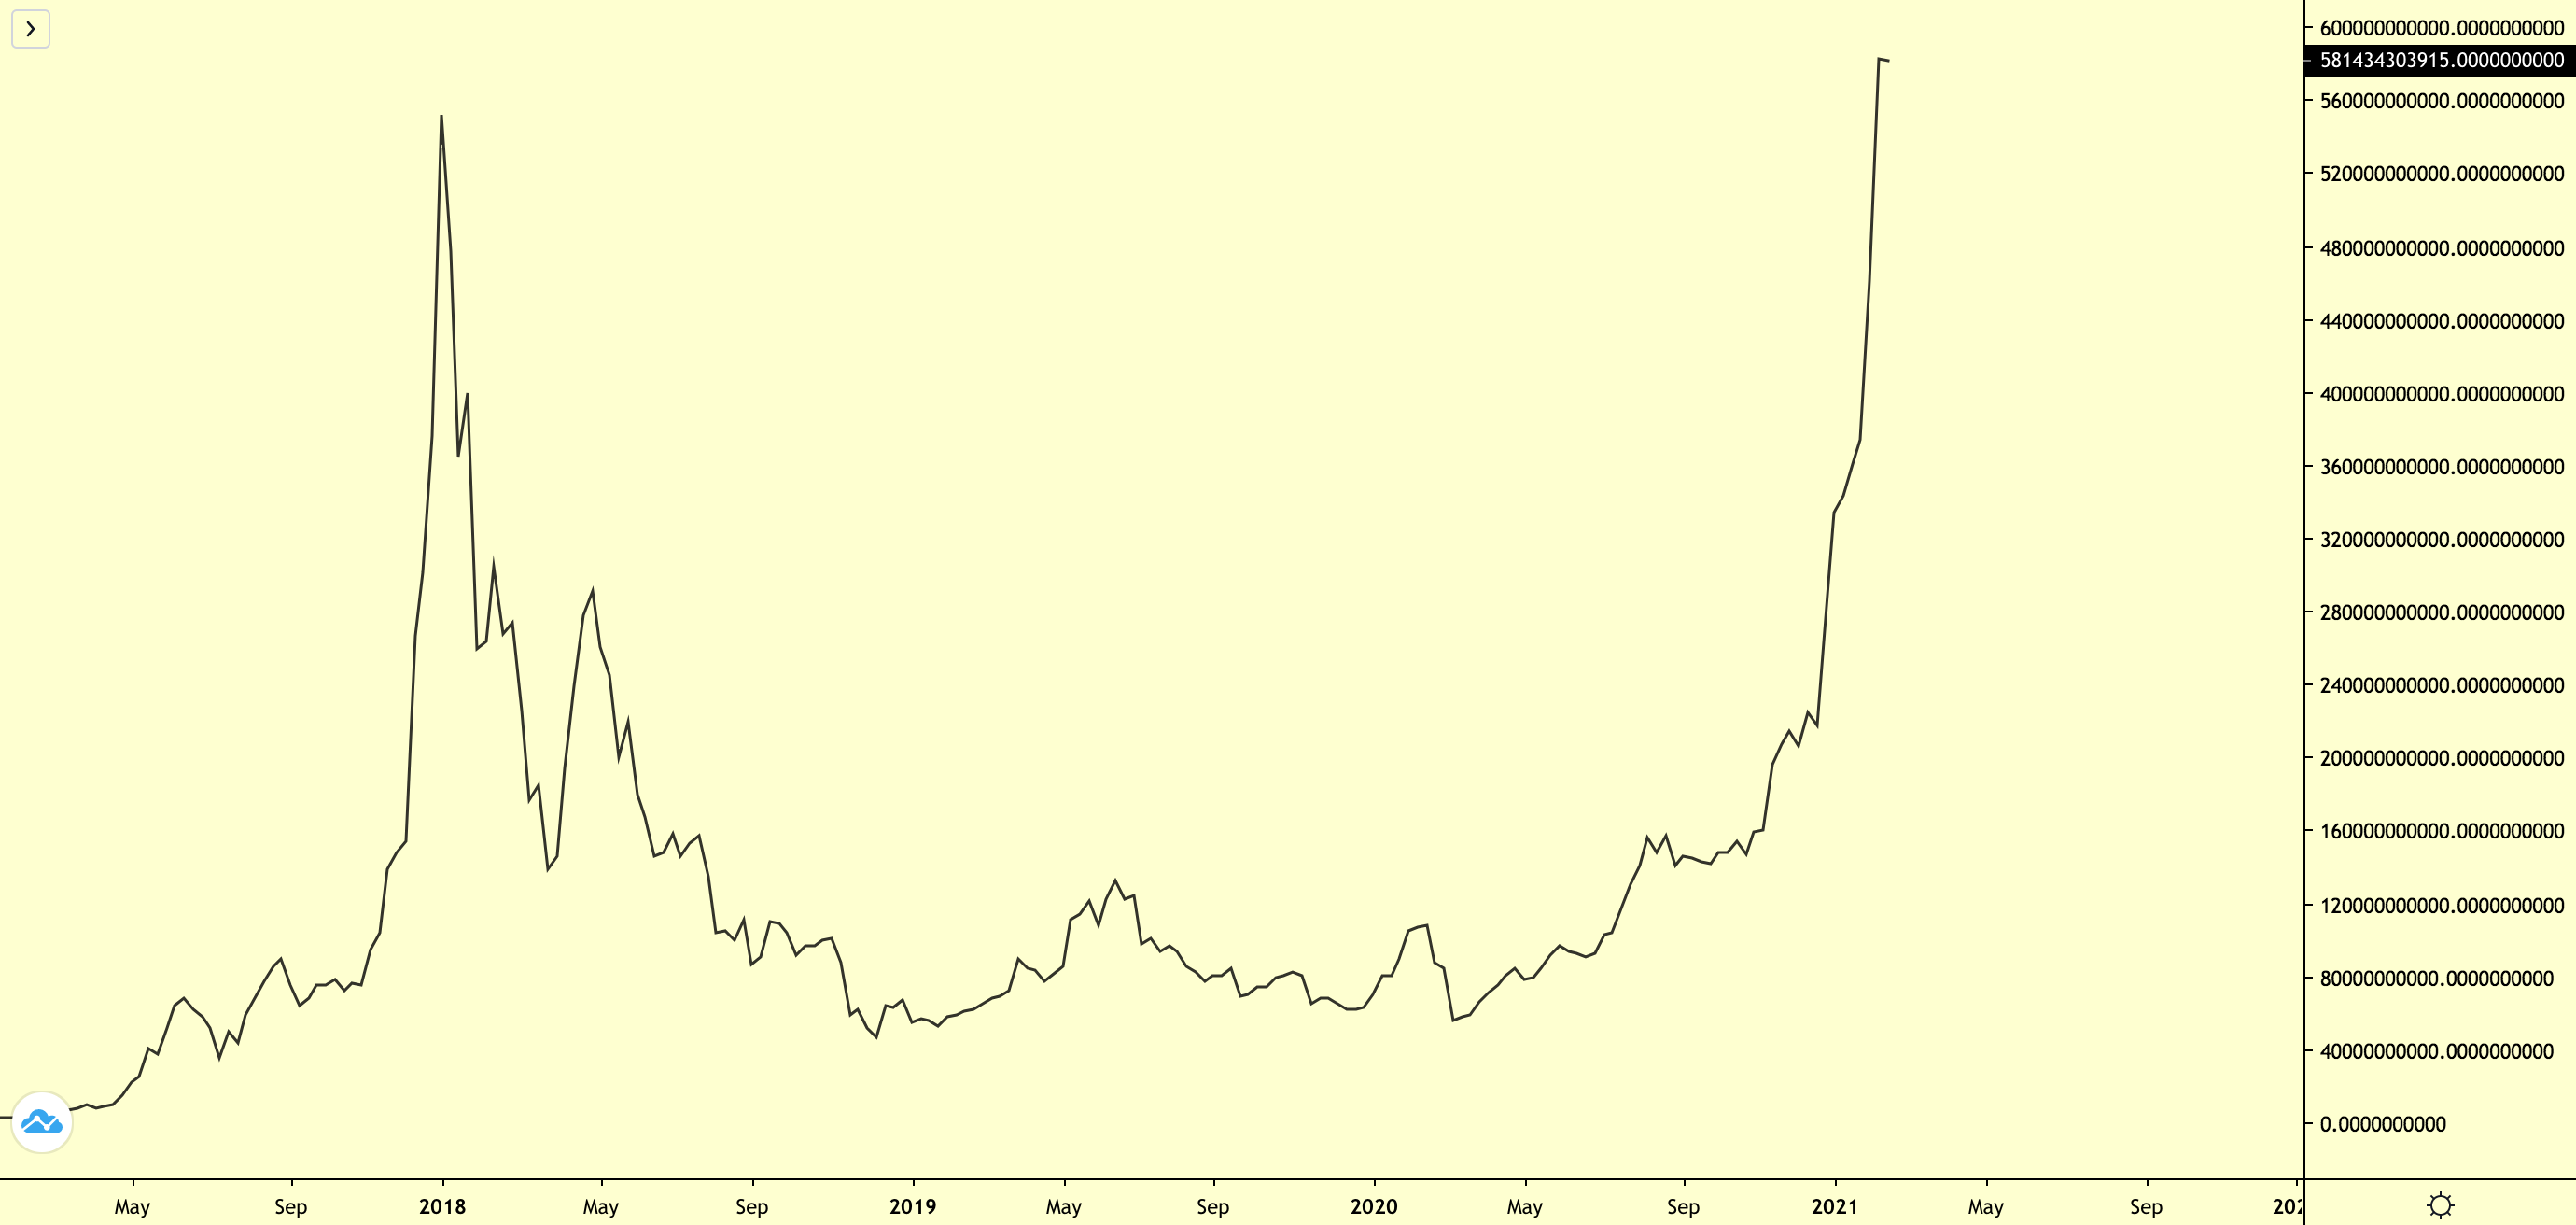
Altcoin Market Cap is almost identical to Ethereum’s price chart. It is lagging behind ETH’s movements, much like LTC, BCH or DASH.
So if Dogecoin cycles confirm increases in Altcoin Market Cap (which is lagging behind ETH/USD’s price movement) then this must also mean that DOGE also kickstarts Money Flow into other Altcoins:
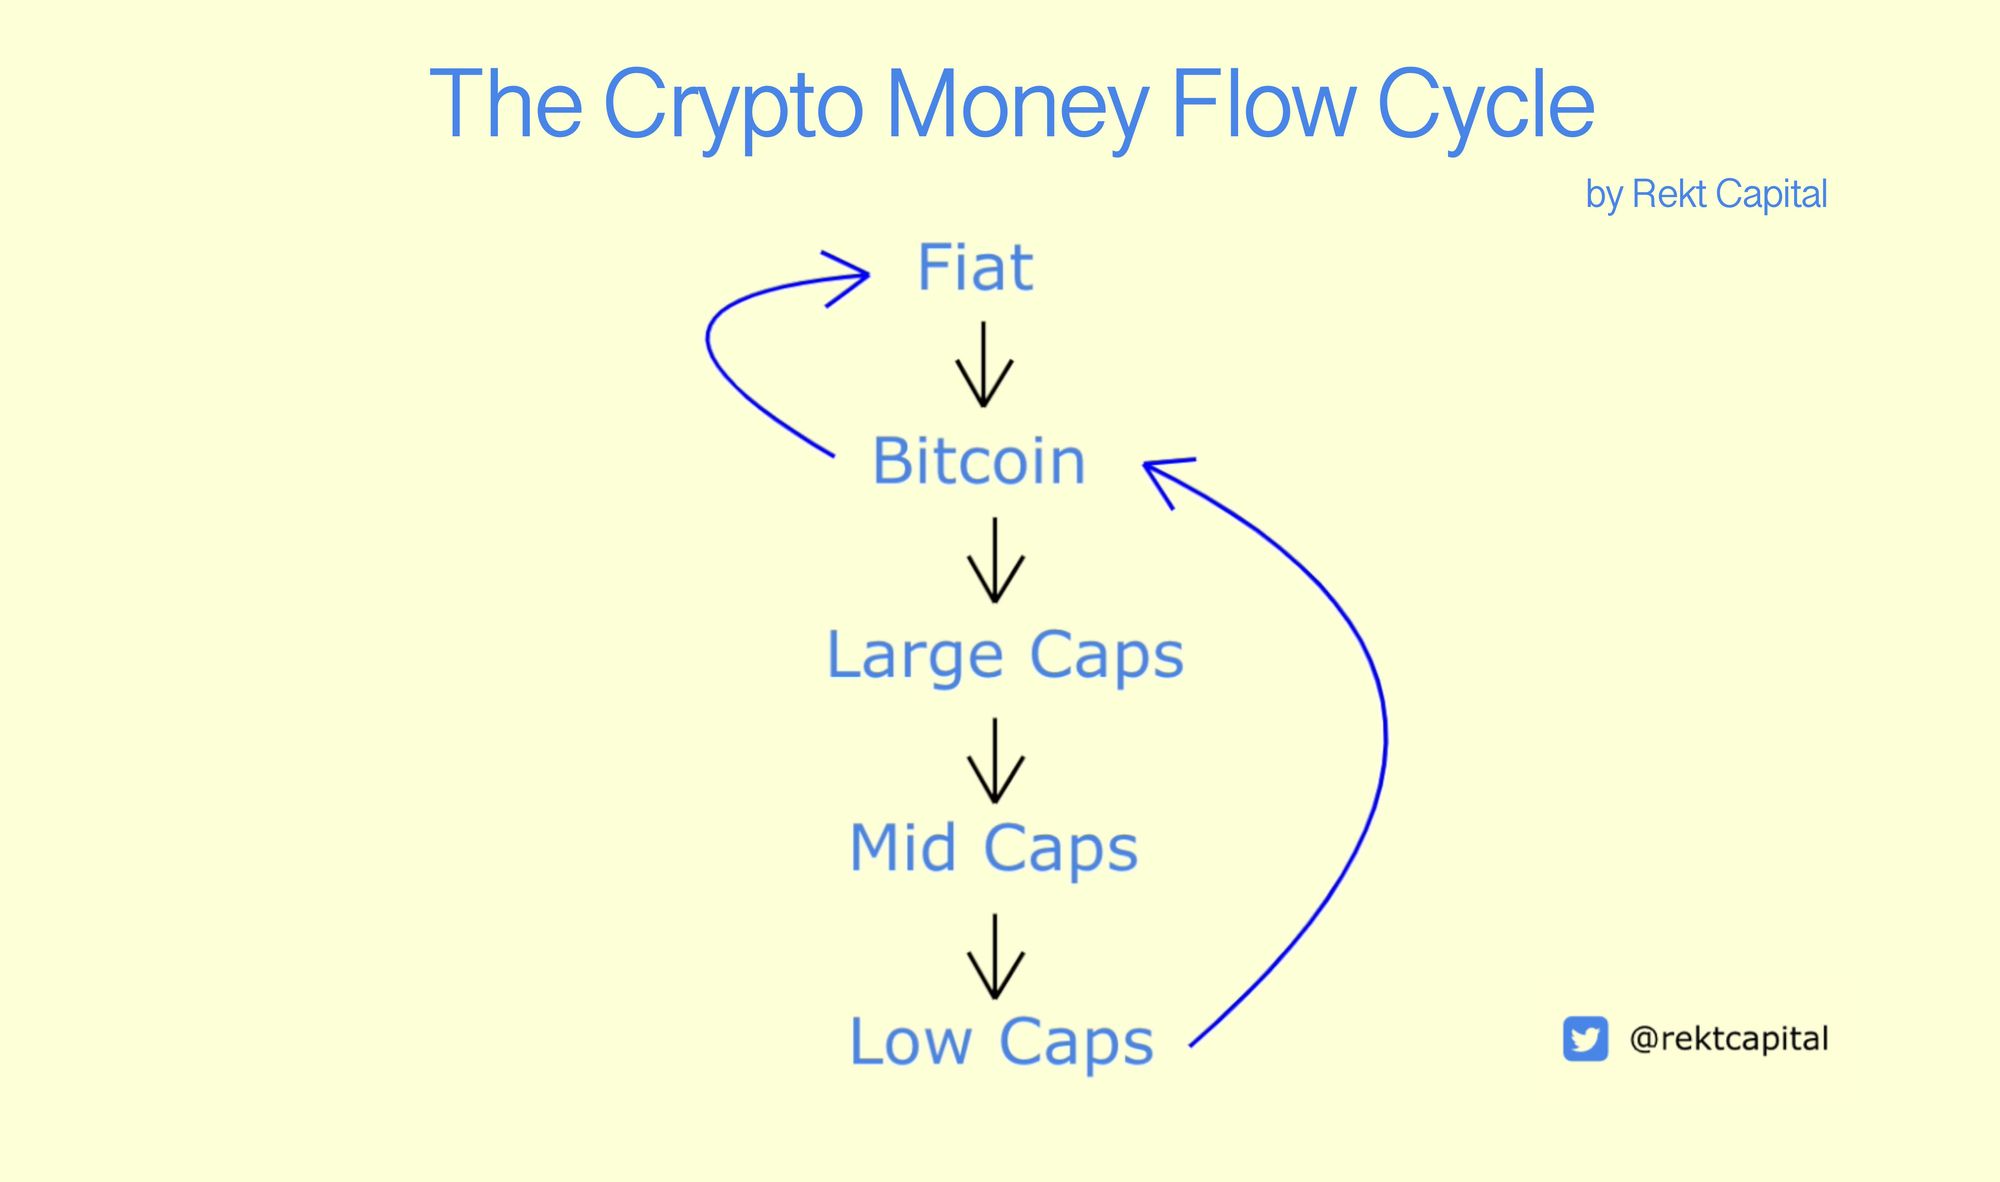
Ever since Bitcoin broke out past its old All Time High of $20000, other Altcoins have been benefiting from investor Money Flow, as per the Crypto Money Flow principles I described in a previous newsletter.
And as Ethereum (i.e. a Large Cap) climbed alongside Bitcoin, once the Dogecoin cycle began - it further confirmed Money Flow into other Large Cap Altcoins and even Mid- and Small-Cap Altcoins as well.
So the fact that the historical cyclicality in the price action of DOGE/USD shares some similarity with the historical cyclicality in DASH/USD is no coincidence:
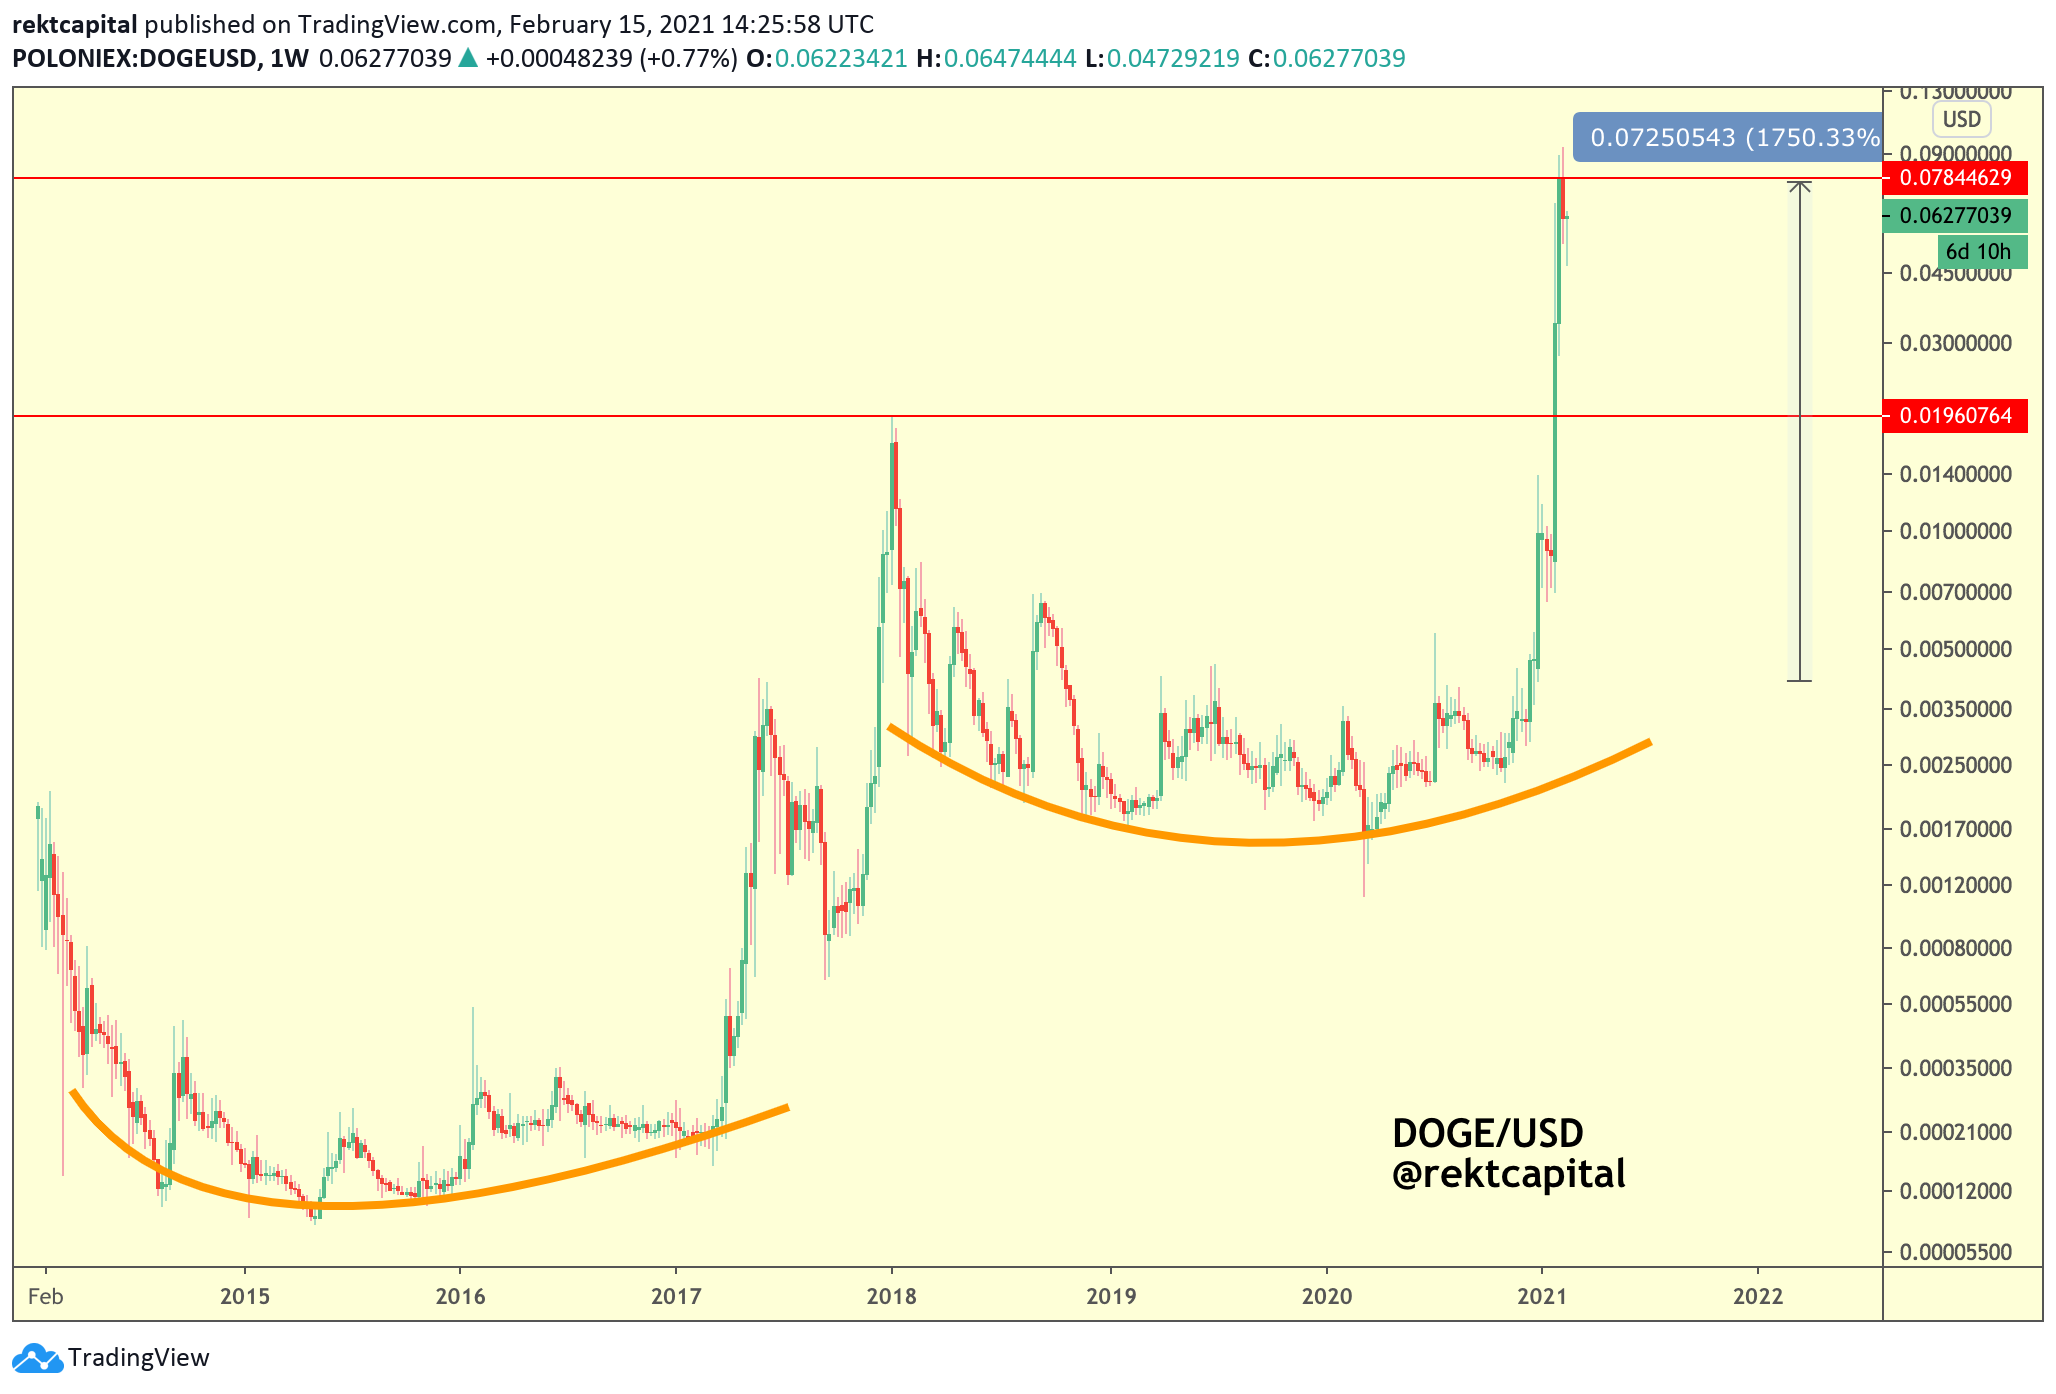
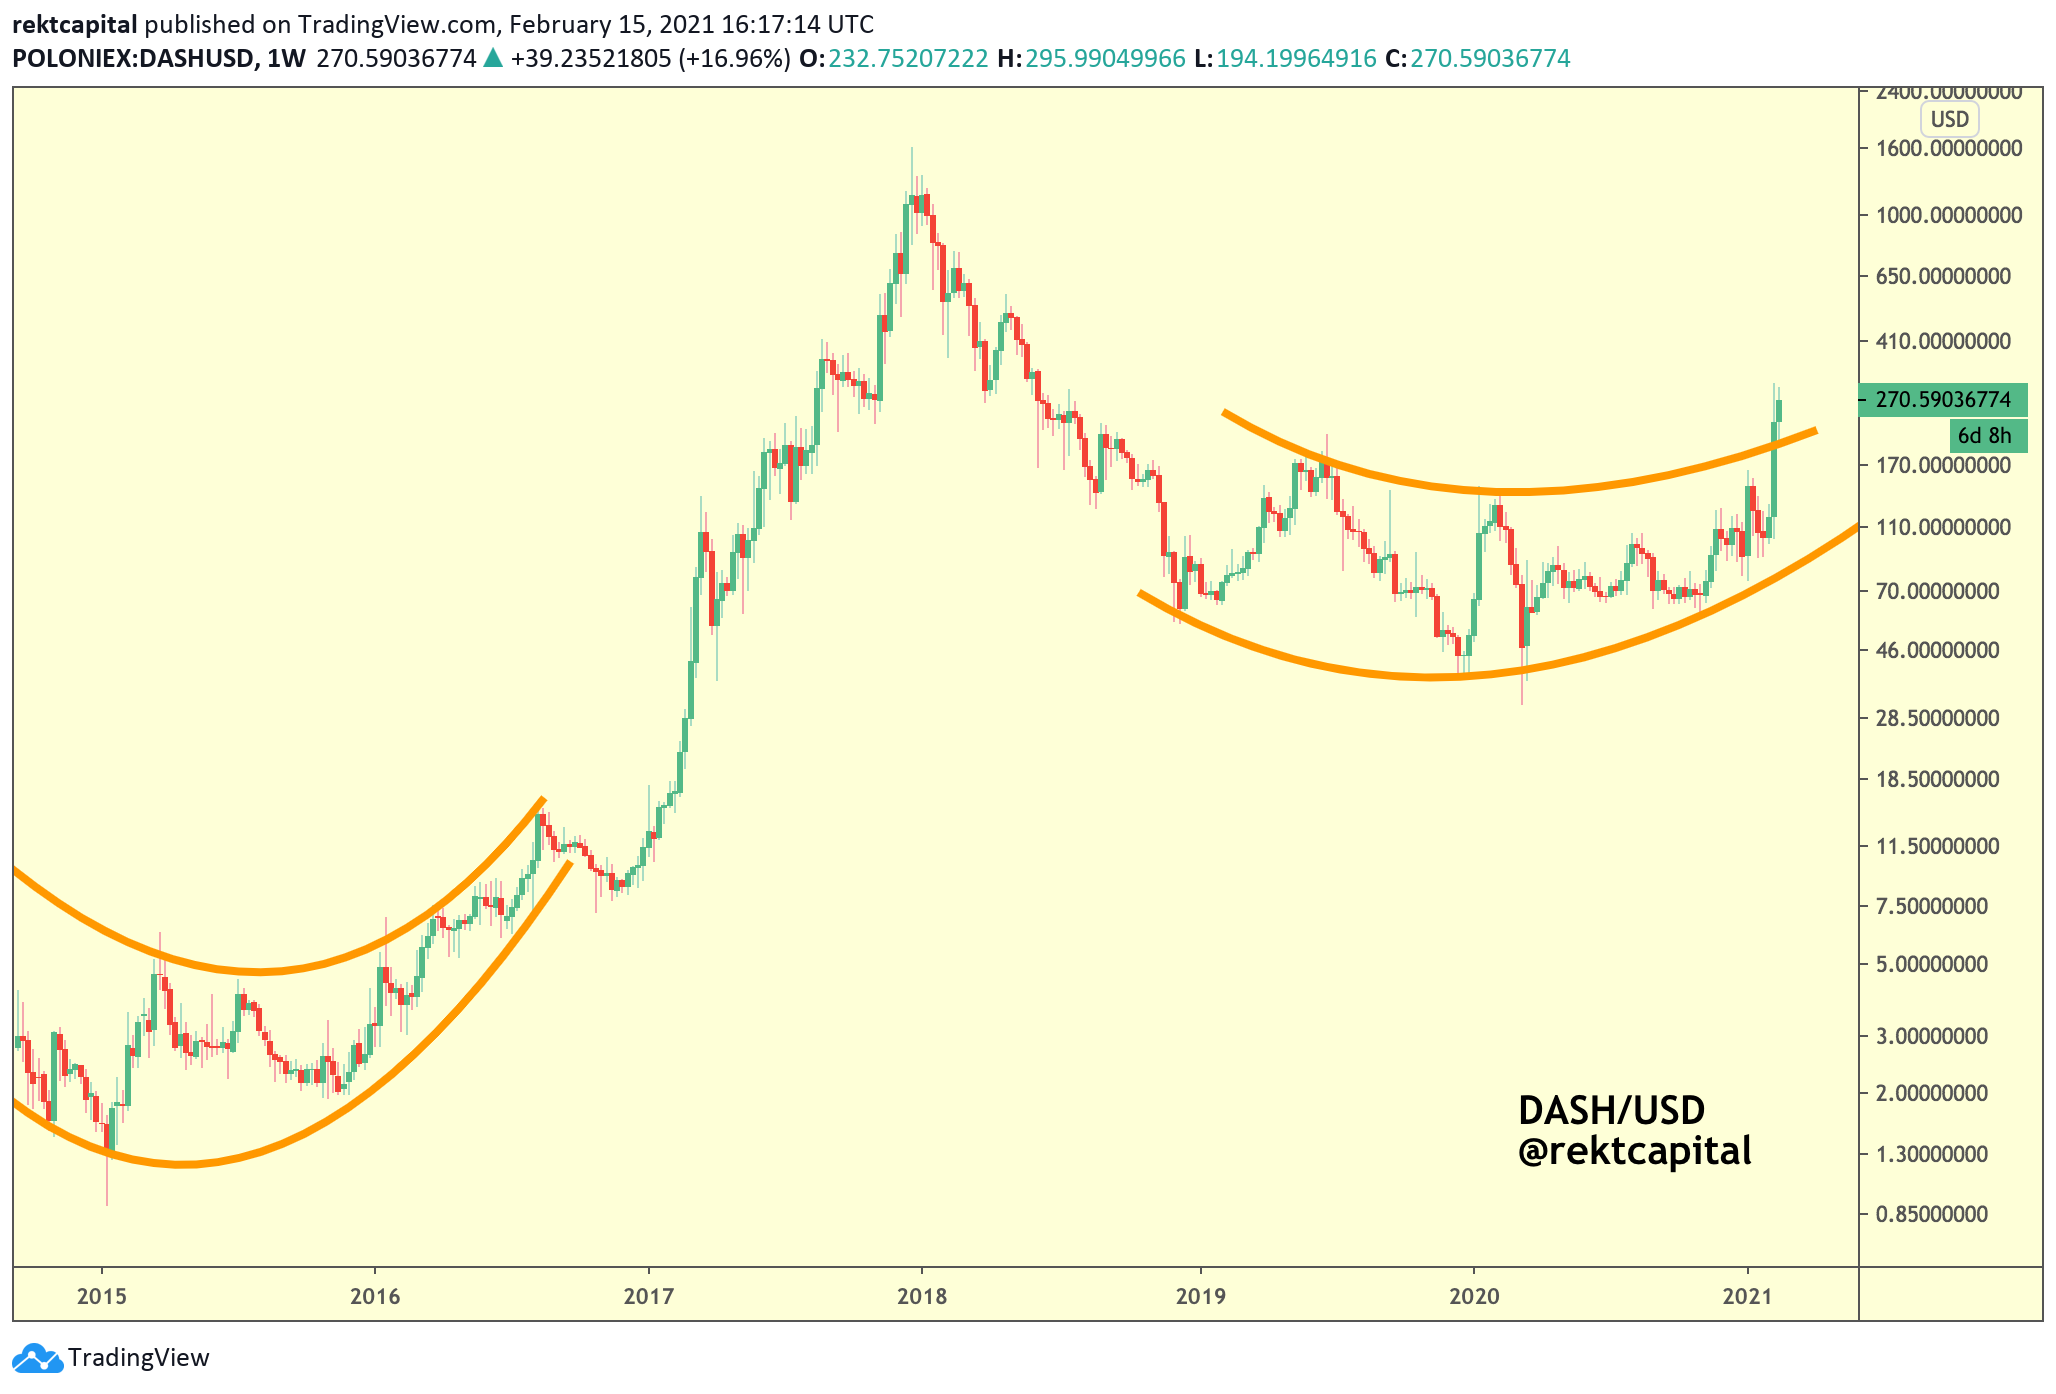
DASH is now in the process of breaking out from its historical almost 800-day parabolic accumulation range.
Let’s take a look at the non-logarithmic price chart to appreciate how pivotal a moment in DASH’s price history this breakout really is:
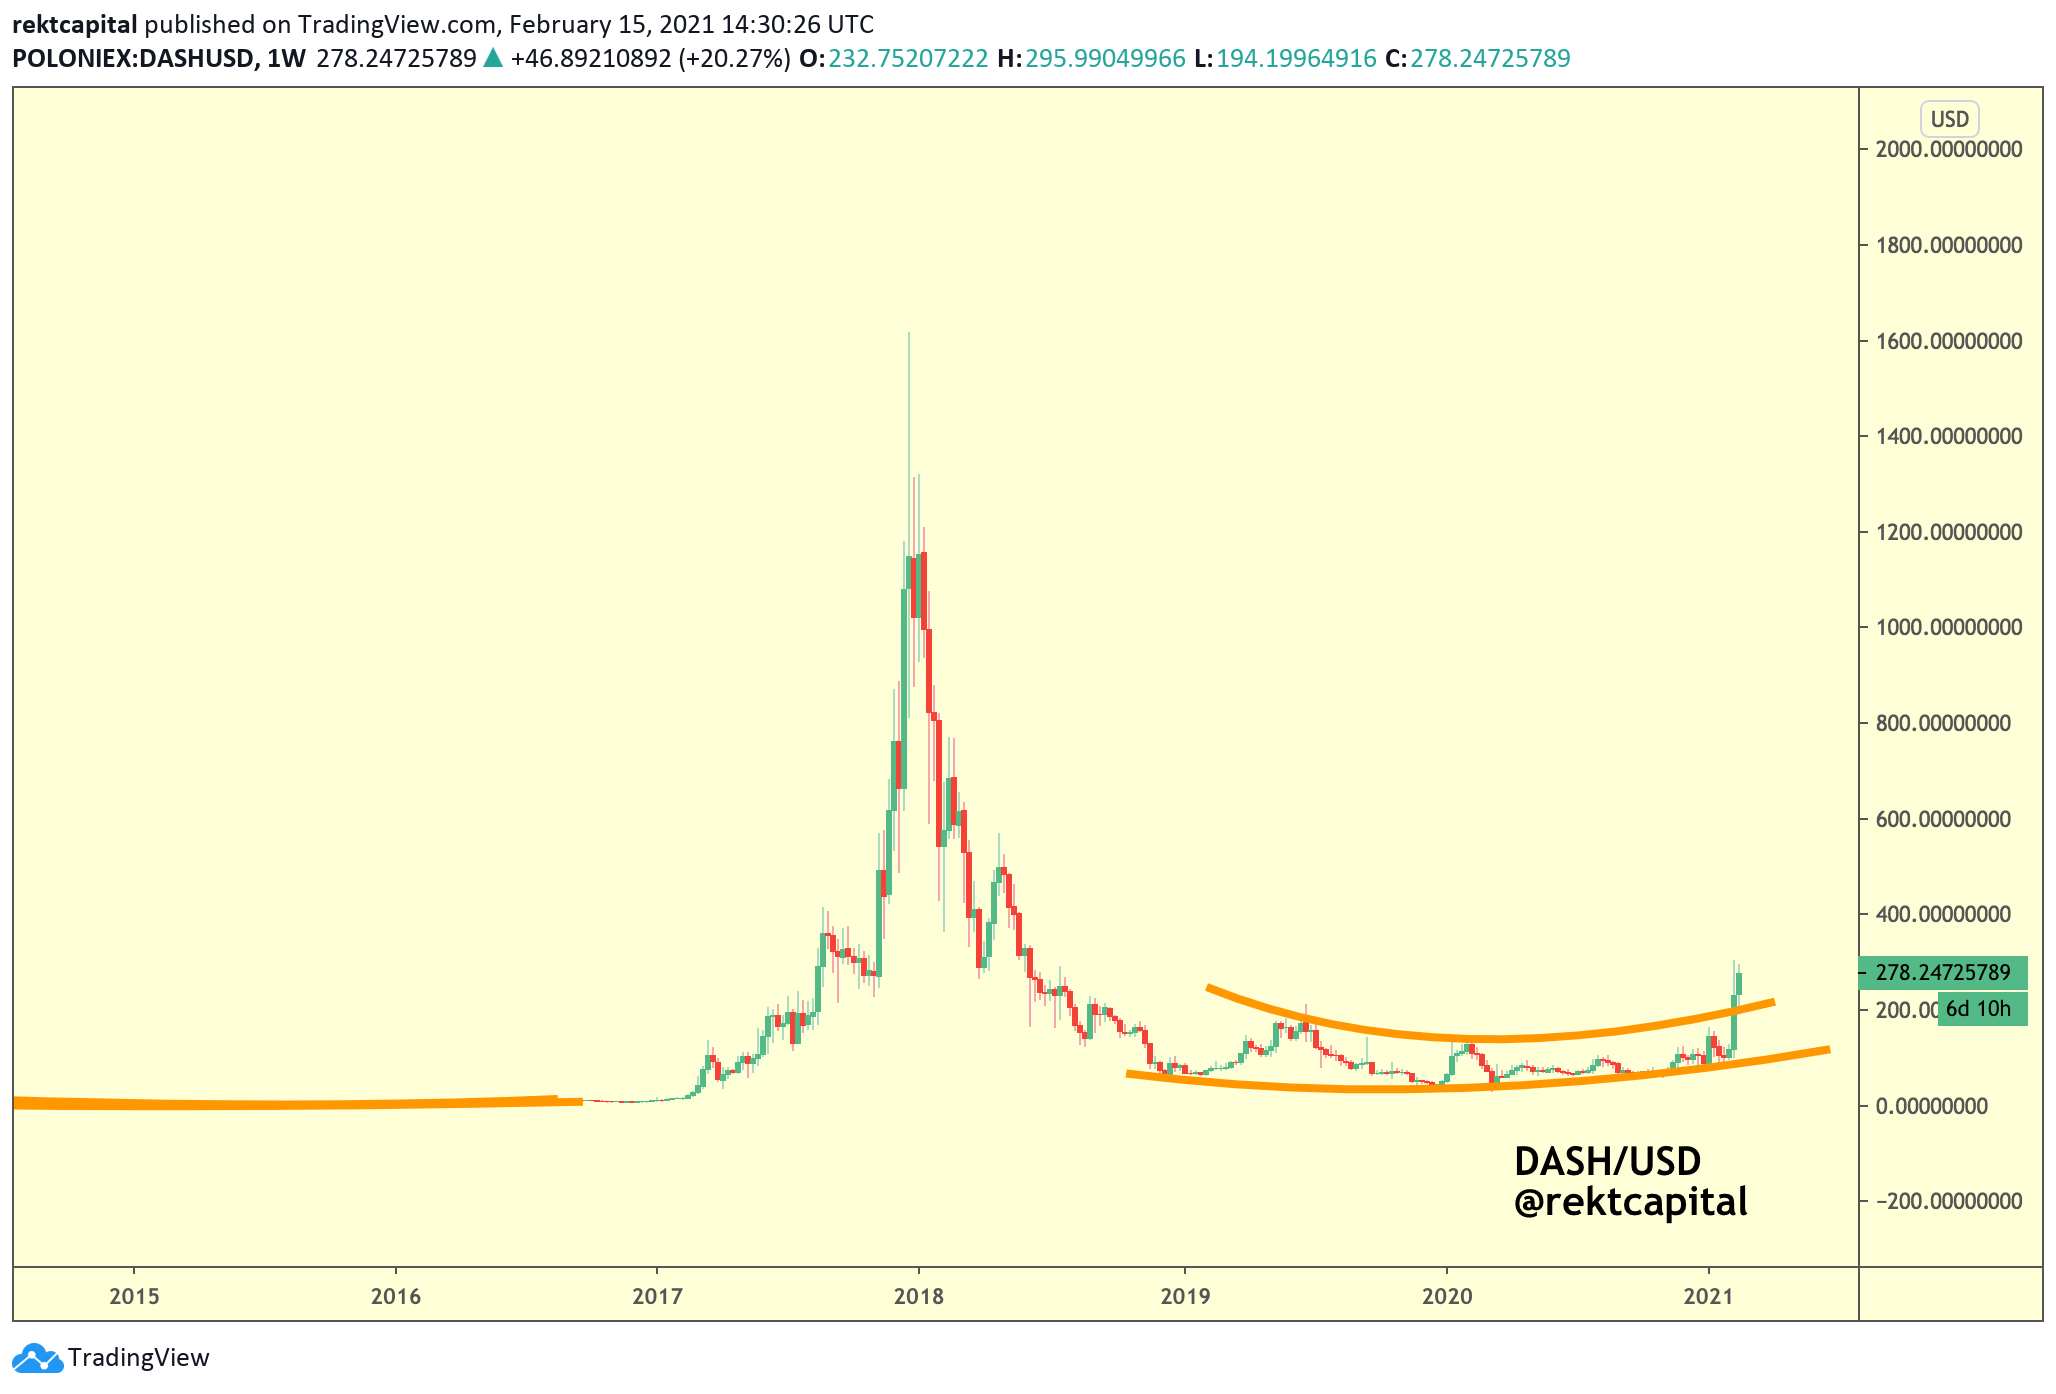
The previous 2014-2016 parabola accumulation range isn’t even visible on the normal view but preceded new All Time Highs for DASH/USD.
DASH is now breaking out from its 2018-2021 parabola accumulation range…
DASH Tokenomics
The technicals underpinning DASH’s price action forecast a bright future for DASH’s newly formed uptrend.
But the tokenomics and on-chain metrics for DASH lend further confluence to the emerging price trend.
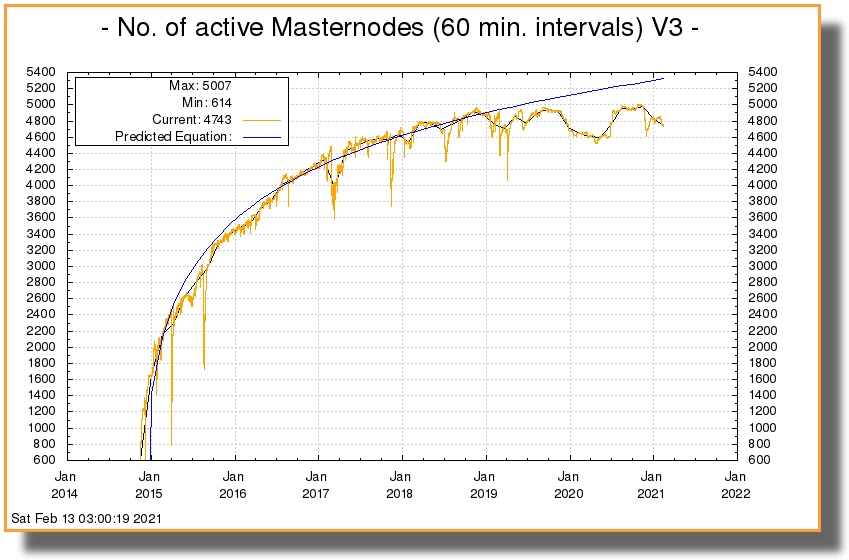
For instance, the fact that around 48% of DASH’s circulating supply is allocated to masternodes means that there is less available supply on exchanges, which has no small impact on the overall scarcity of DASH:
But it’s not just the locked in circulating supply that has an impact on the price action of DASH.
Inevitably, more user adoption will also inspire price increases through sheer demand and active usage.
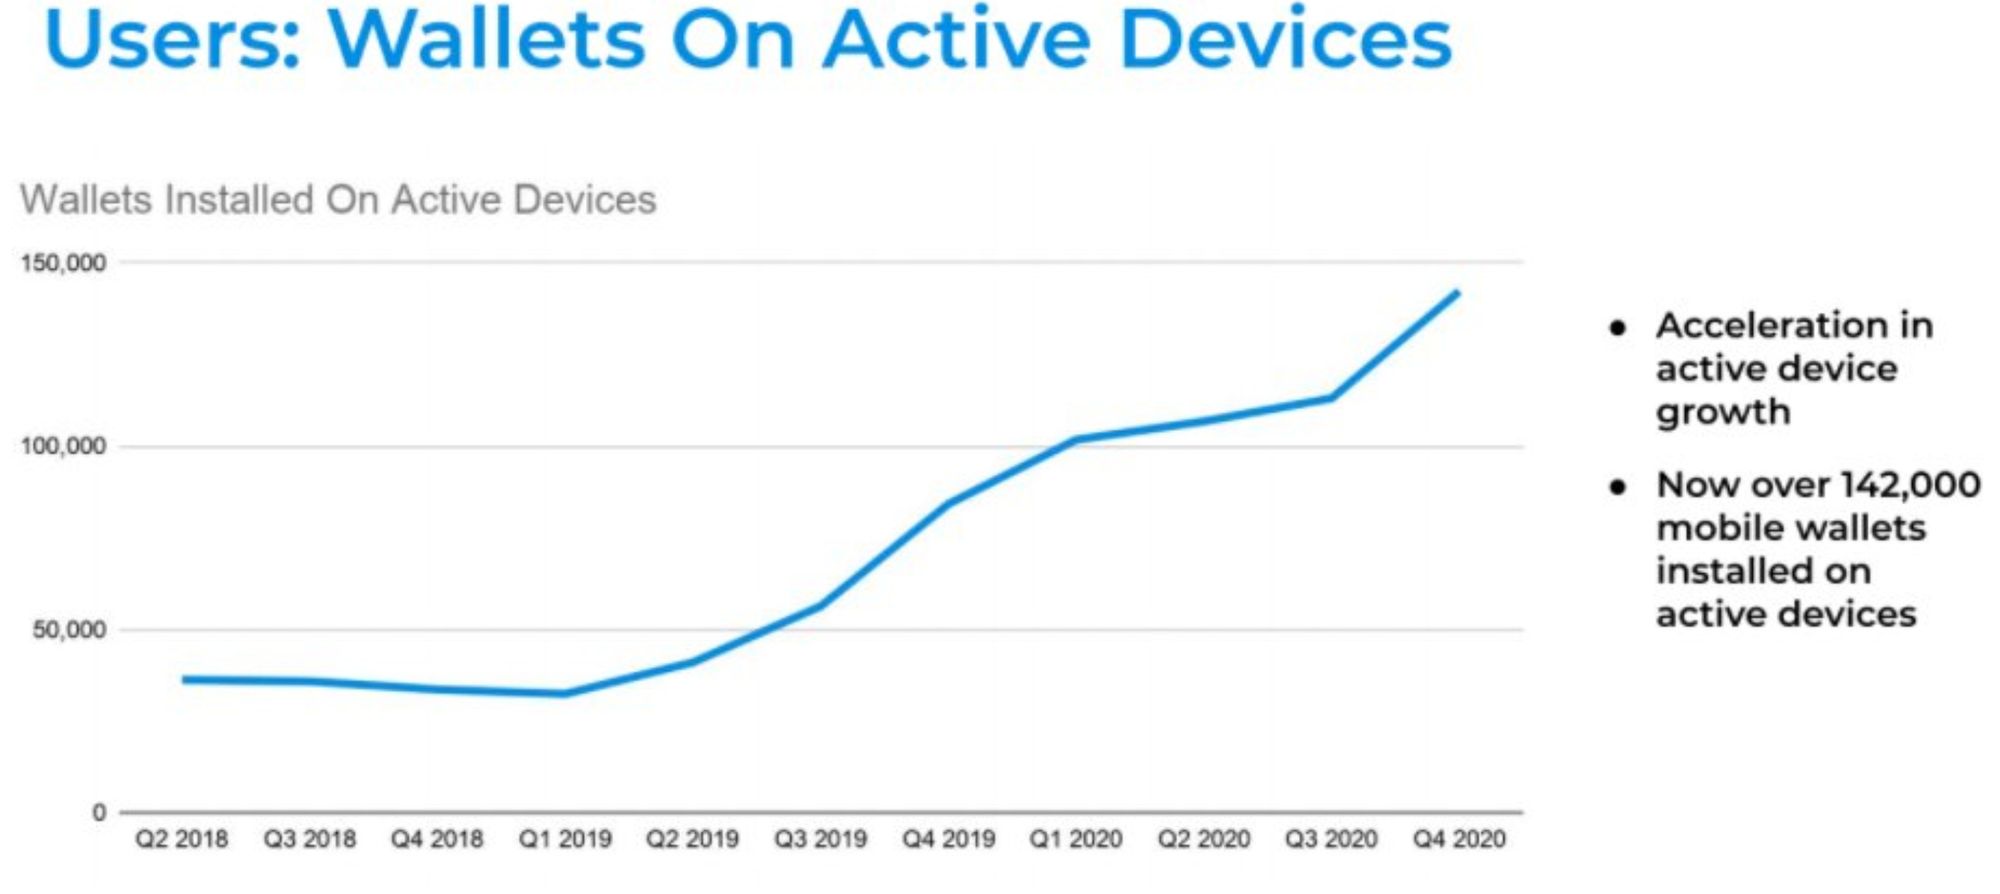
DASH wallets installed on active devices has seen an almost three-fold acceleration since Q3, 2019 lately reaching over 142000 mobile wallets installed on active devices:
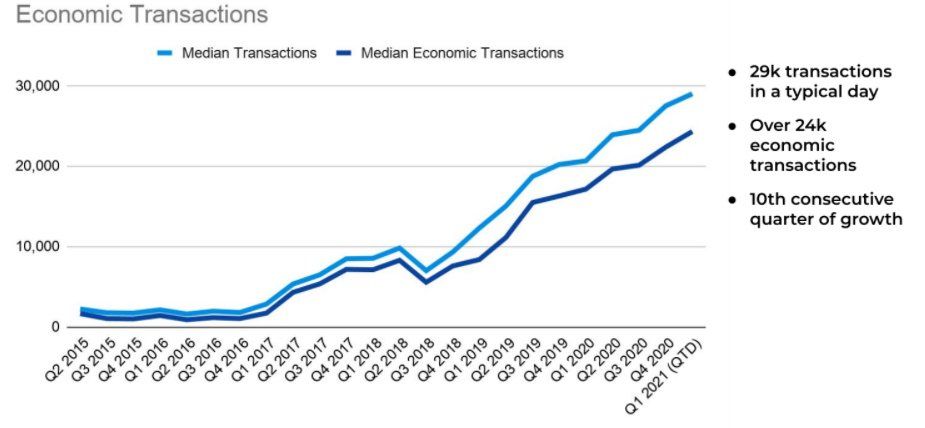
To add to that, over 24000 economic transactions have taken place since 2015, marking a 10th consecutive quarter of growth for DASH usage:
These figures will likely continue to climb, especially given the recent CrayPay partnership that will enable Dash to be spent at over 8x more places than Bitcoin.
In alignment with DASH’s technical price predicament, the CrayPay partnership has arguably acted as a strong fundamental catalyst to fuel the breakout and emerging new trend in DASH’s price action.
Closing Thoughts
The last time Altcoin Market Cap broke its old All Time High in December 2016 (green circle)…
Altcoin Market Cap increased +27,000% by December 2017 (second red circle):
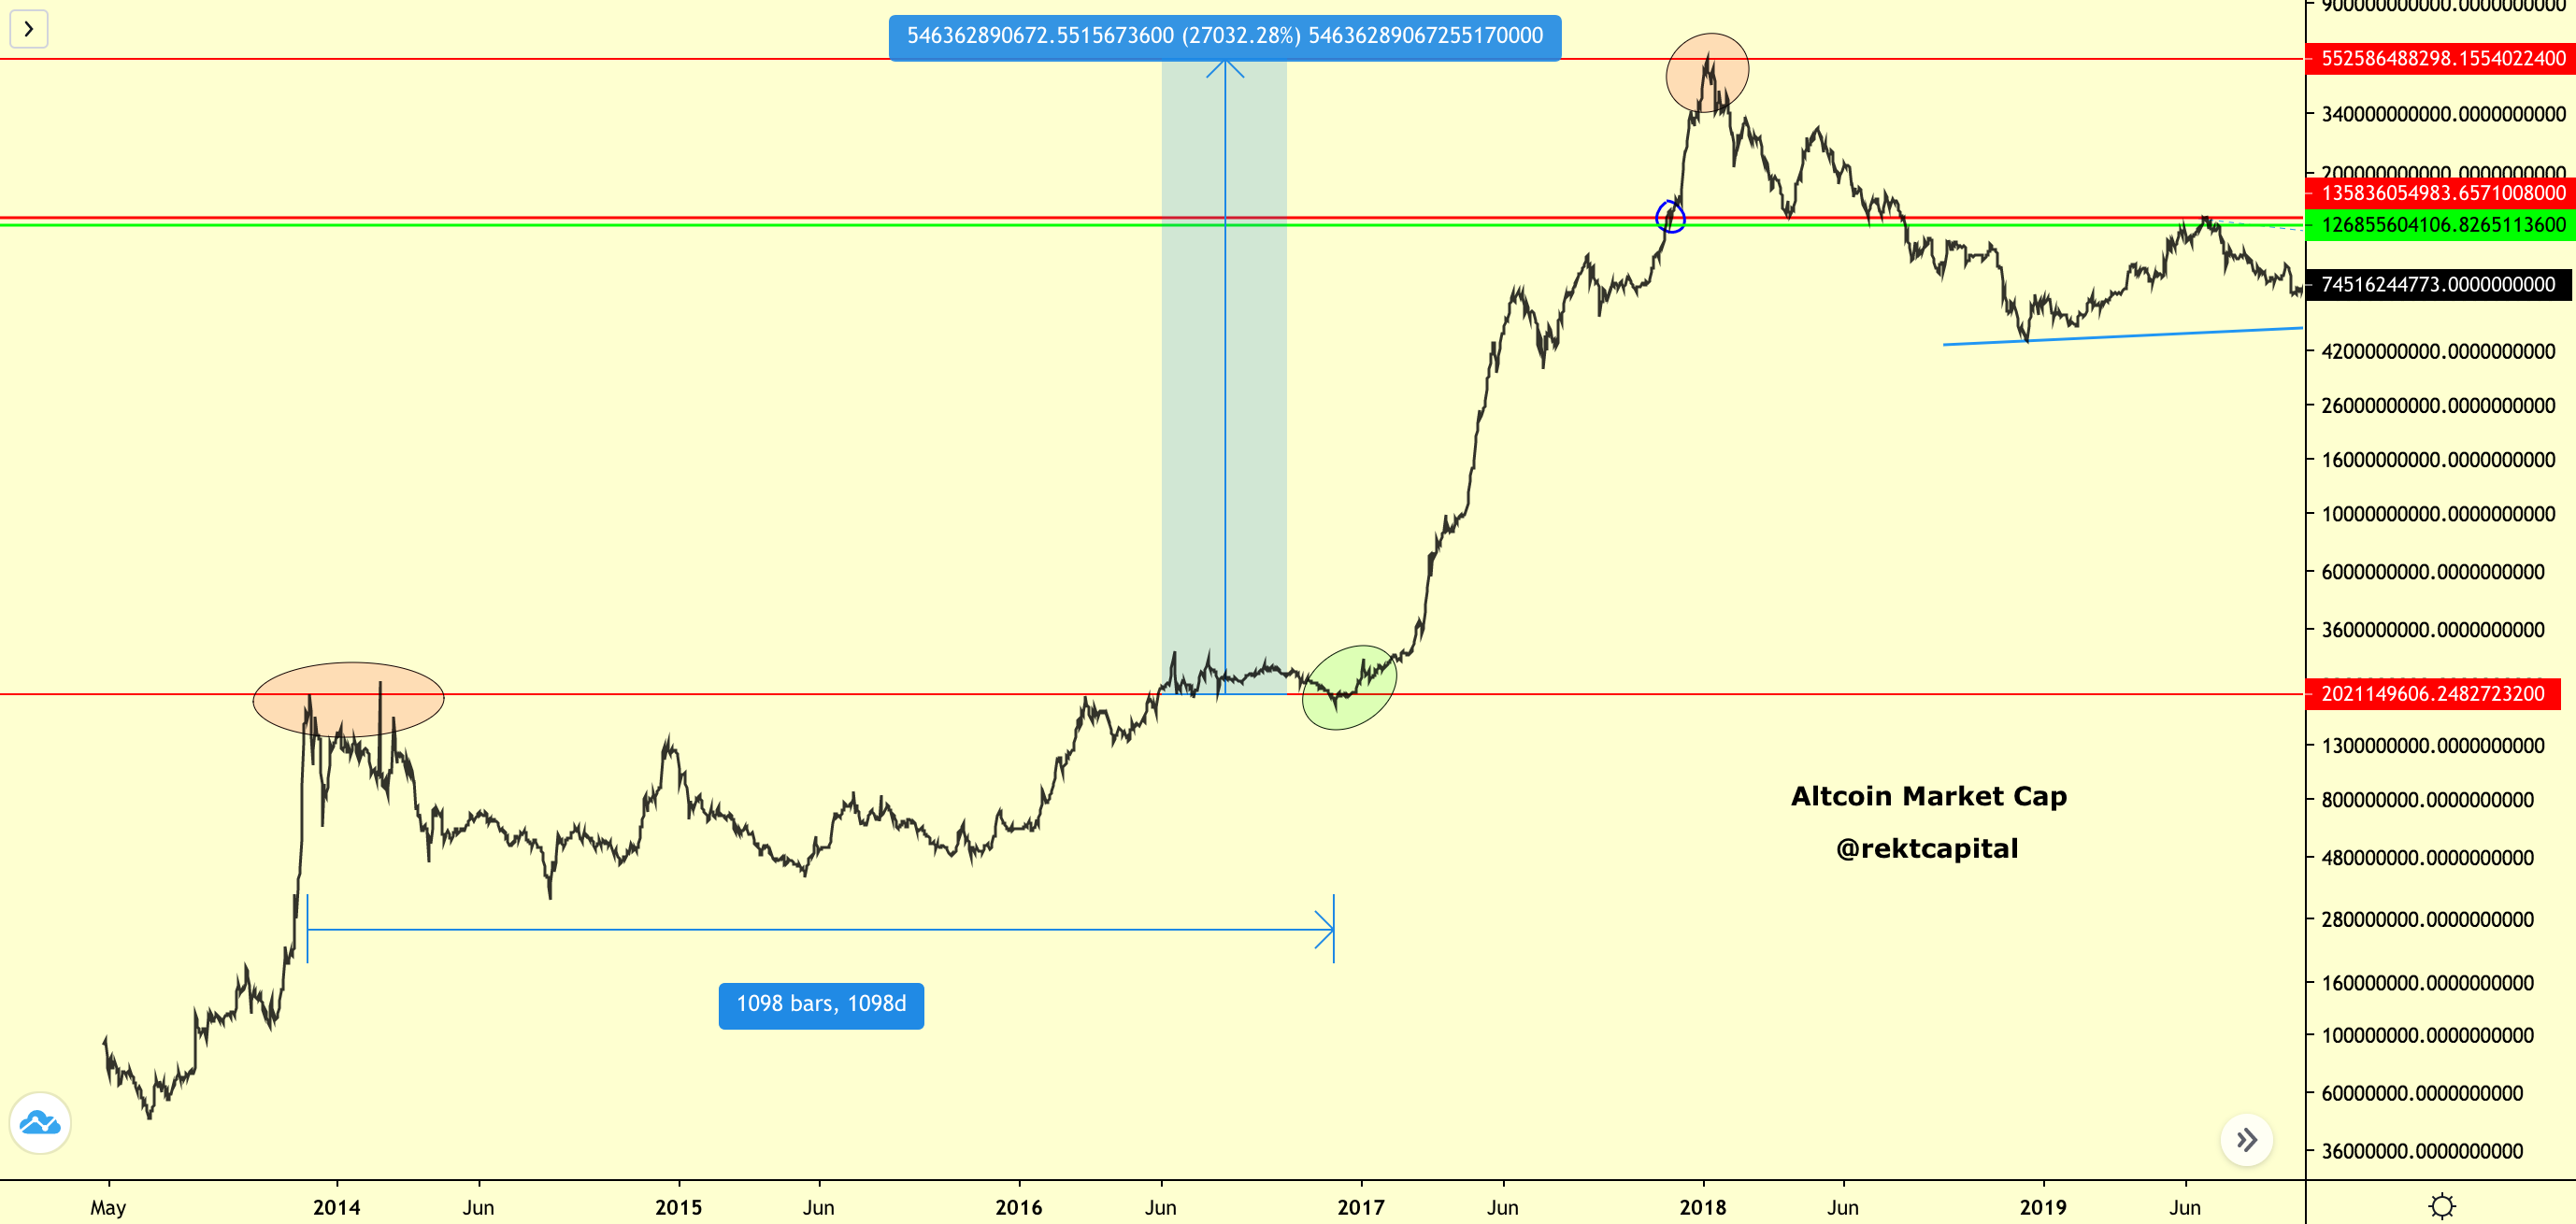
Altcoin Market Cap recently broke its 2017 highs:
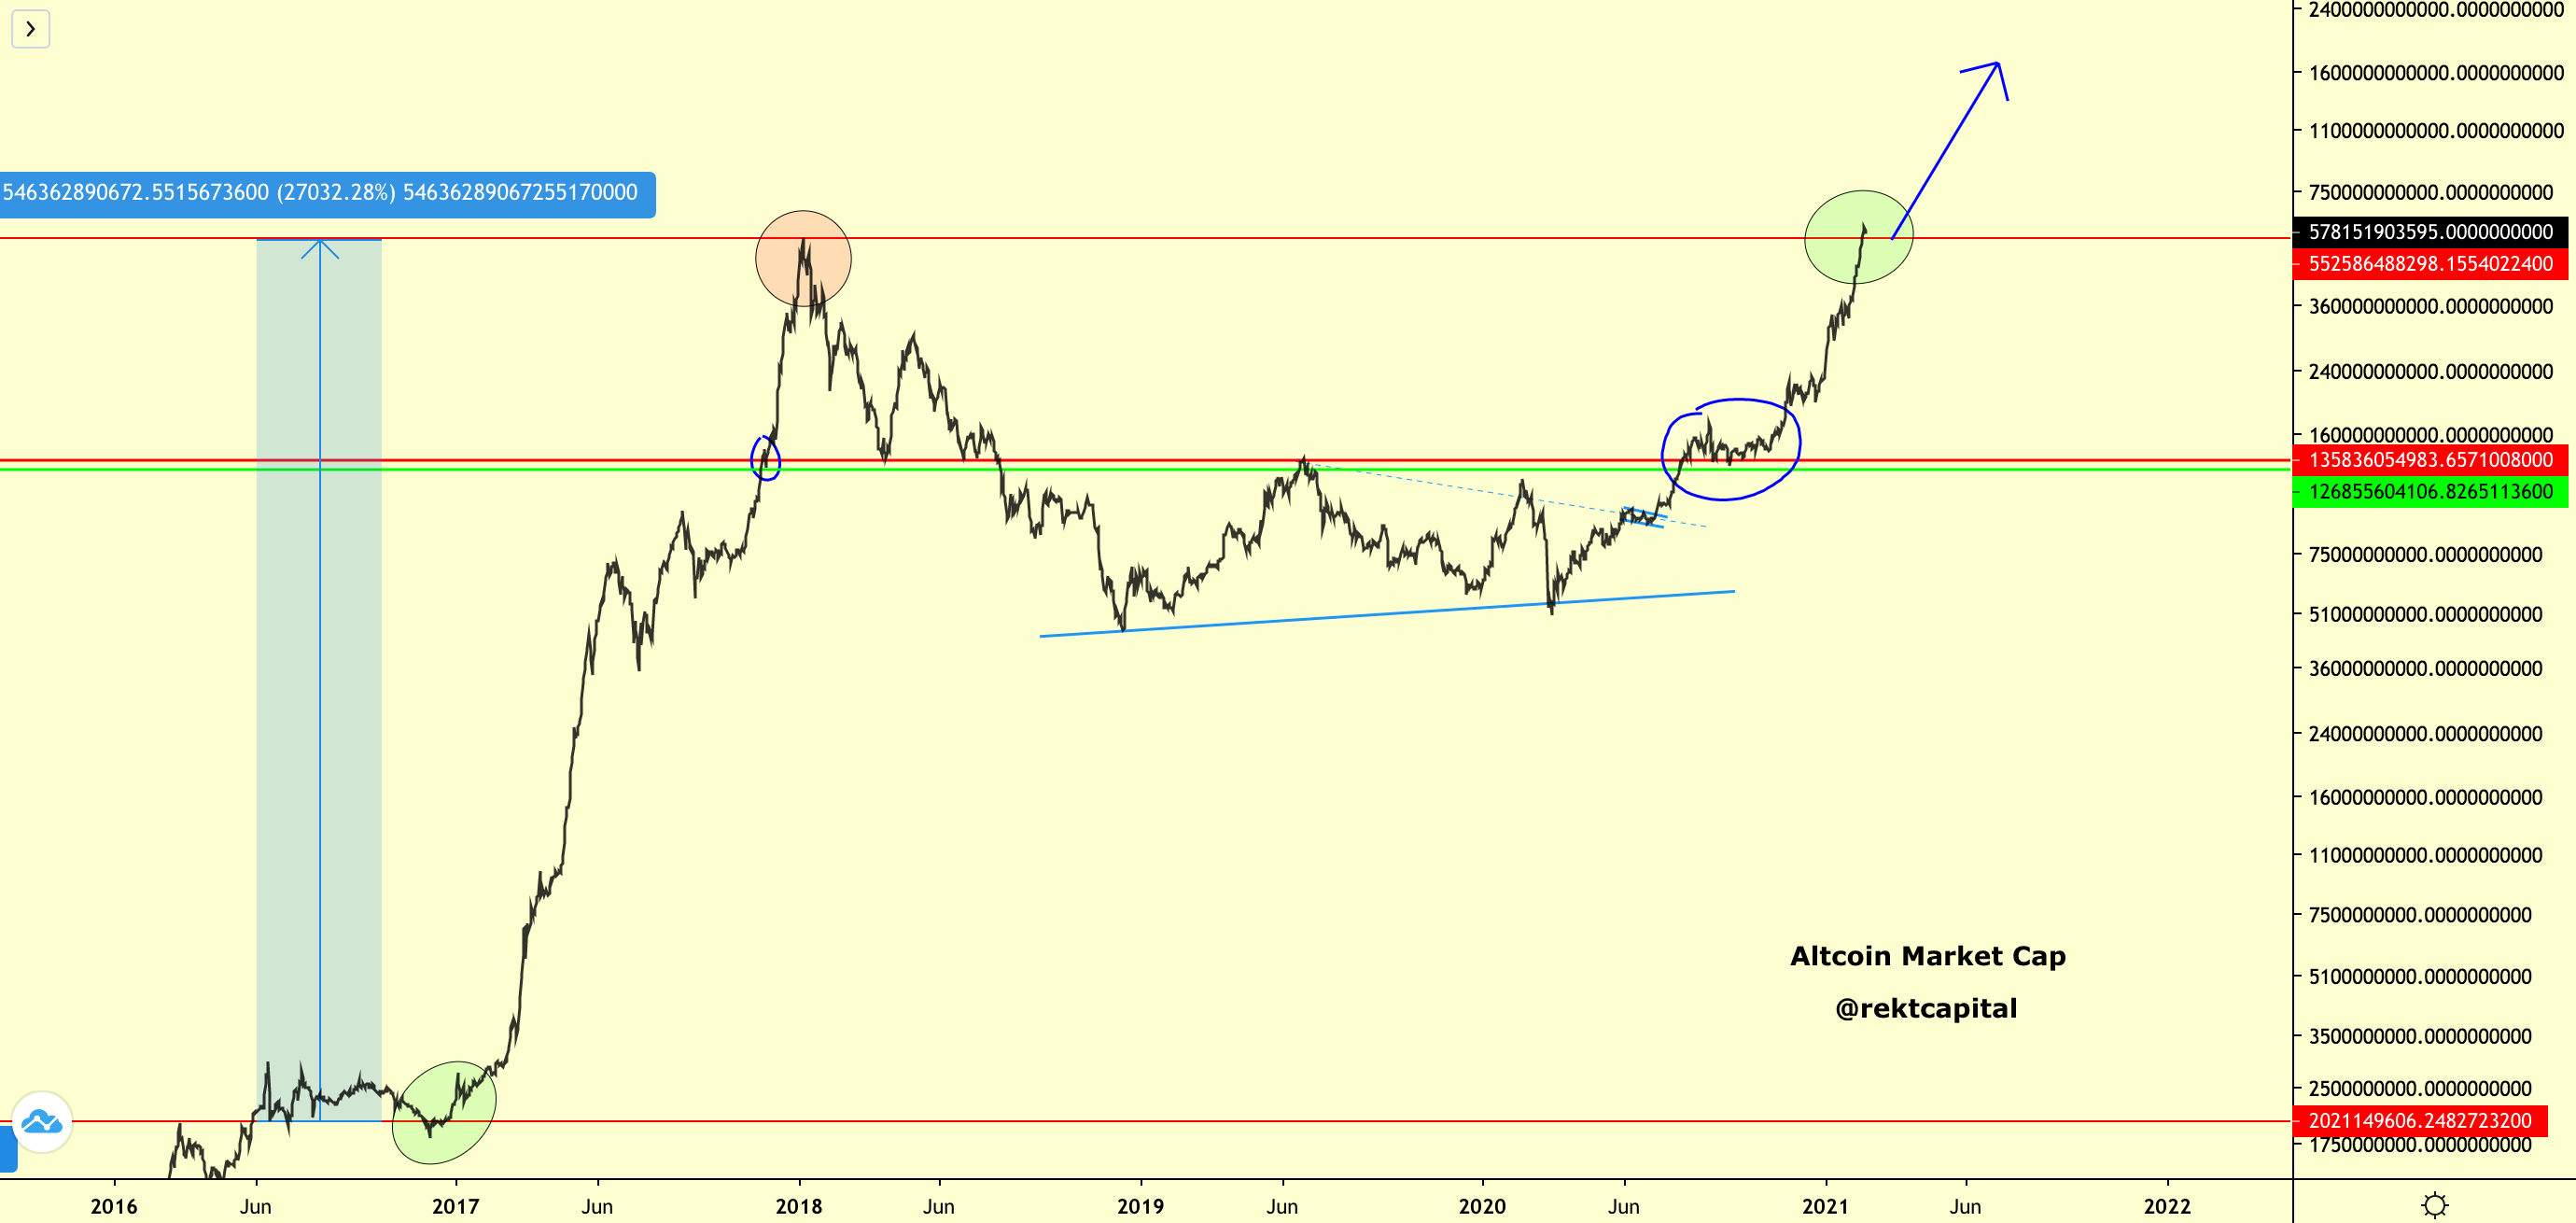
Altcoins are in the very-early stages of a macro Altcoin Bull Market.
And DASH is no exception.
Thank you for reading today’s free issue of the Rekt Capital newsletter. Let me know your feedback in the comments!
I write research articles like this every Monday for subscribers of the newsletter. Upcoming Monday editions will be available to paid Subscribers only.
If you’d like to receive cutting-edge research like this straight to your inbox, feel free to subscribe for an early-bird discount of $6.99 a month: