Altseason Special
Altcoin TA Session #17. TA Request Session on 10 different Altcoins.
Welcome to the Rekt Capital newsletter, a resource for people who want to better navigate the crypto markets with the help of cutting-edge crypto research and unbiased market analysis.
Every Friday, I host an Altcoin TA session where I share my exclusive commentary on the price action of a wide variety of coins requested by valued supporters of the newsletter.
Today’s edition is an Altcoin Season Special and is free to everybody to read.
If you’d like to receive cutting-edge research like this straight to your inbox during this Altseason - feel free to subscribe for $6.99:
In today’s Altcoin TA session, I cover 10 different Altcoins, specifically:
- Algorand (ALGO/USDT & ALGO/BTC)
- Chainlink (LINK/USD & LINK/BTC)
- Stellar (XLM/USD)
- Coti (COTI/BTC)
- Ocean Protocol (OCEAN/BTC)
- VeChain (VET/BTC)
- Reserve Rights (RSR/USDT)
- Harmony (ONE/USD)
- Hedera Hashgraph (HBAR/USD)
- REN (REN/BTC)
Important: this edition of the newsletter is quite lengthy. So if you’re reading it on email - a portion of it may be cut. Feel free to read the full version on the newsletter website.
Let’s dive straight into it:
ALGO/USDT & ALGO/BTC - Algorand
In an Altcoin TA session from late January, I shared how ALGO/USDT was forming a macro triangle:
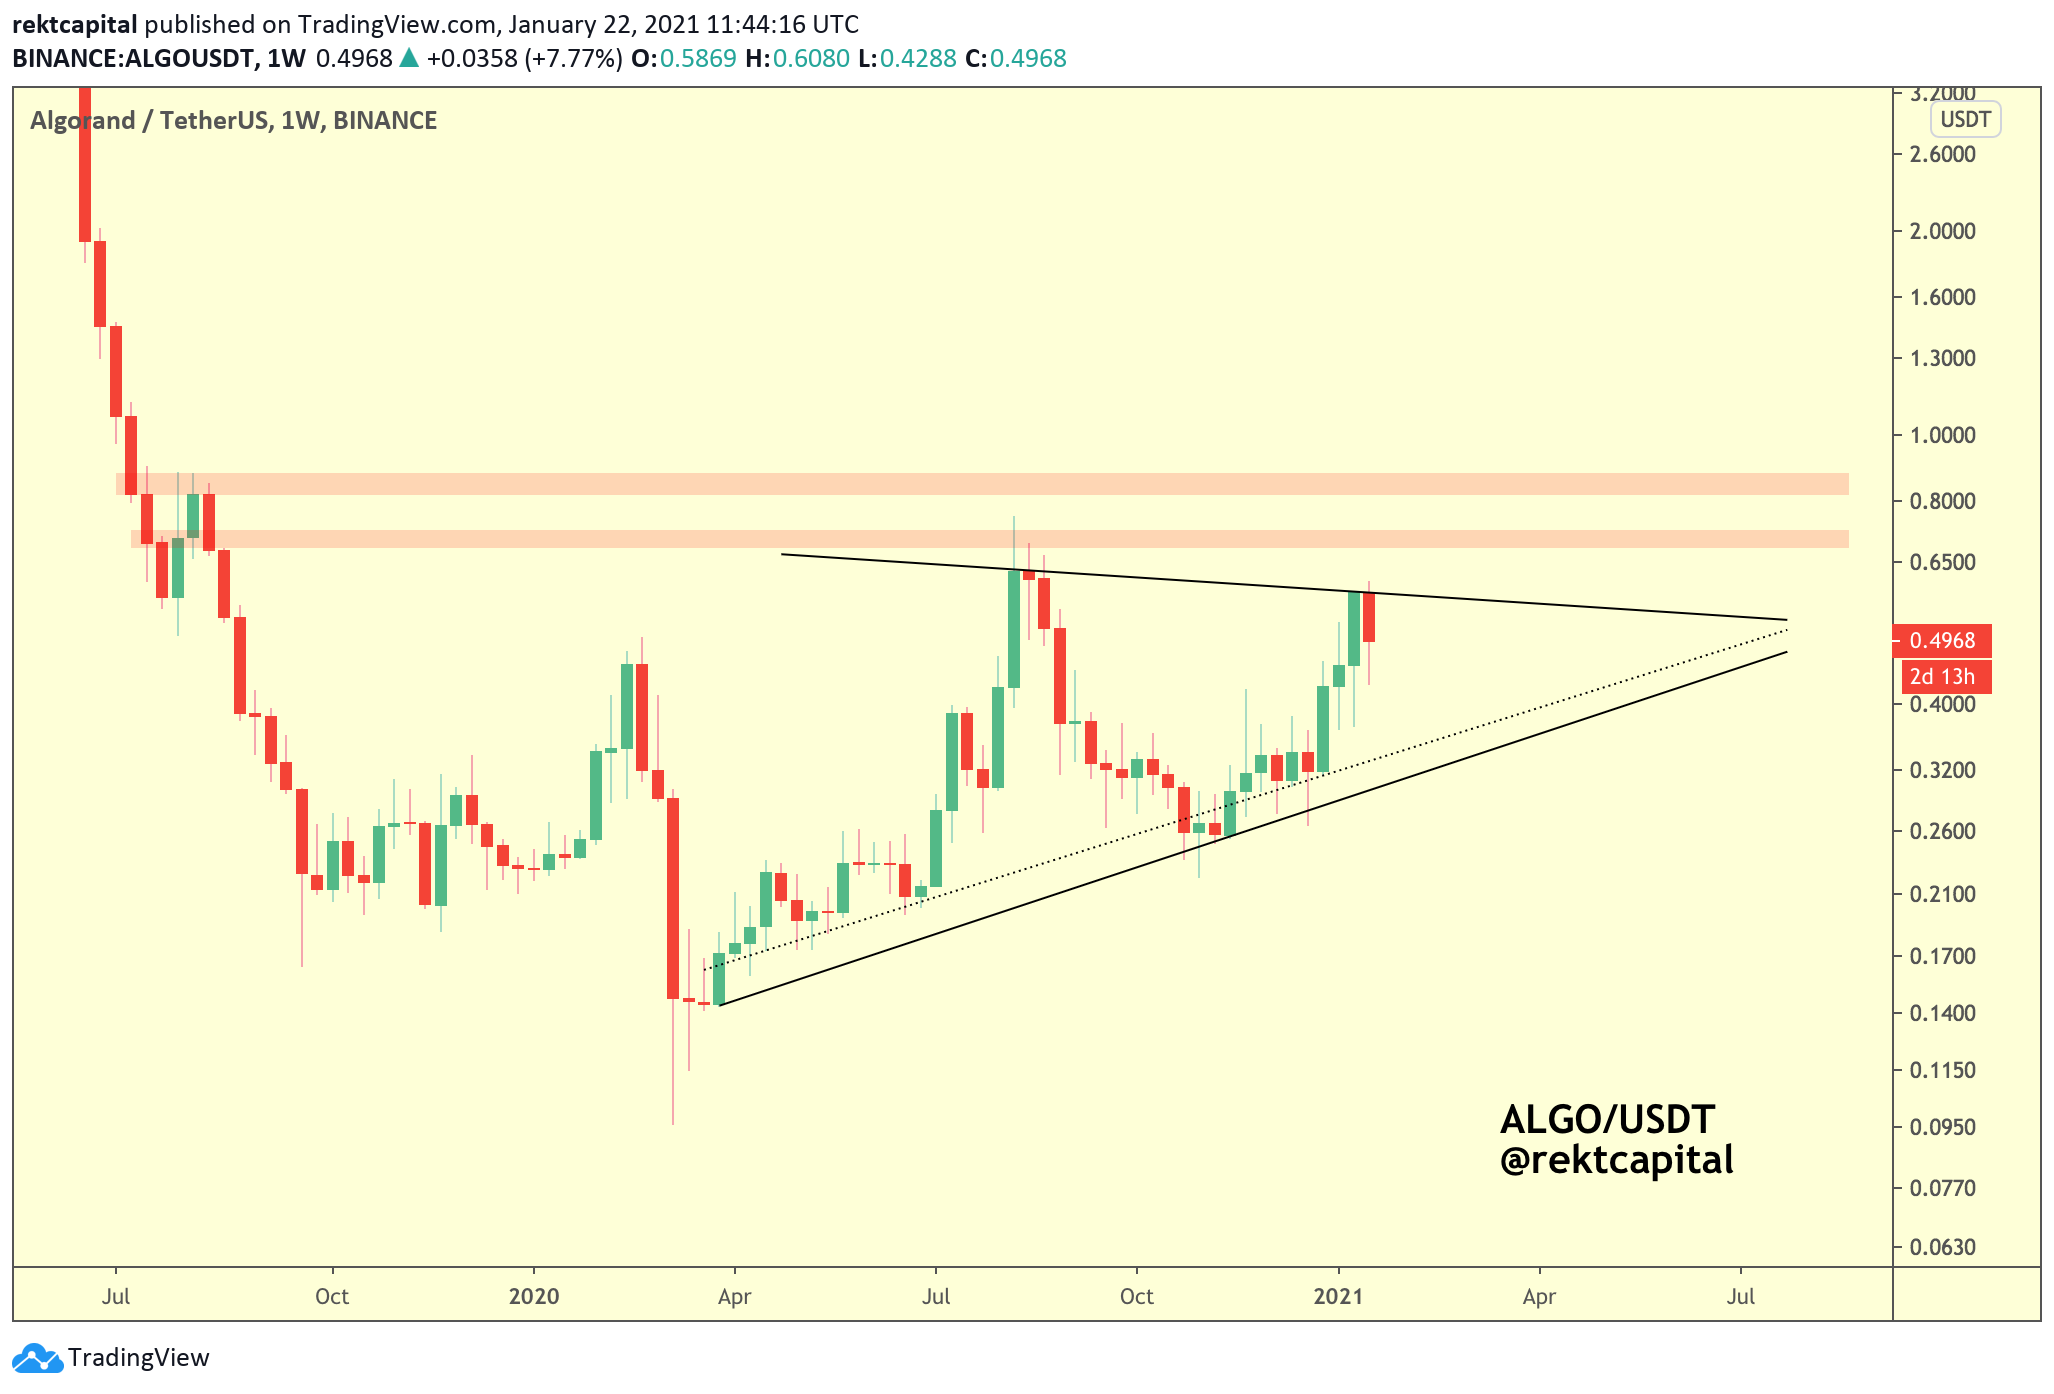
Macro triangle precede macro trends:
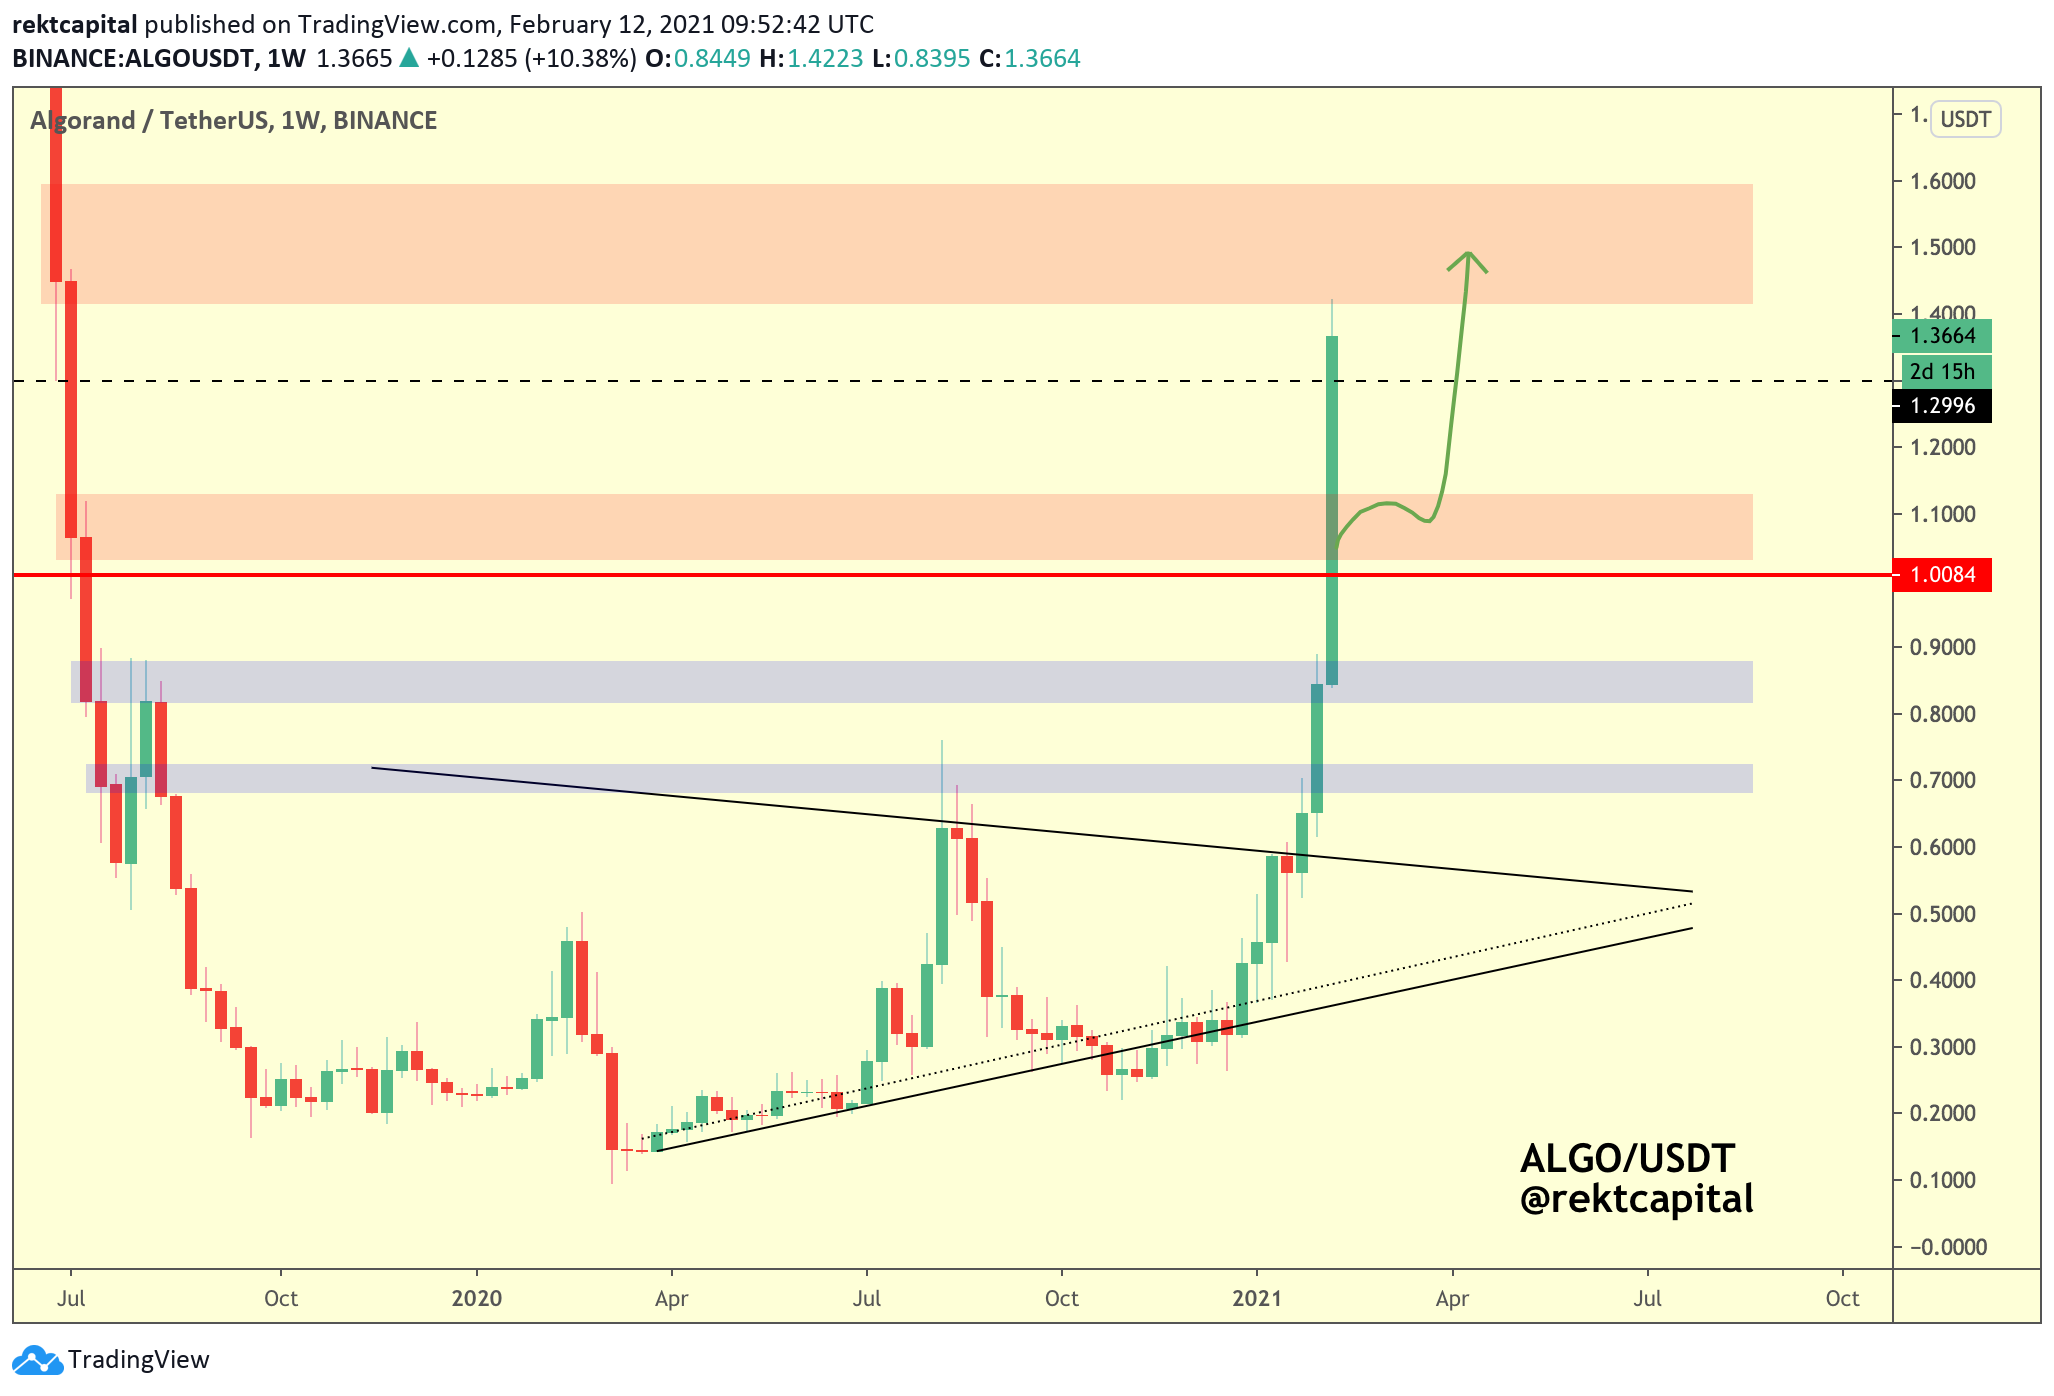
ALGO/USDT has rallied almost +200% since late January. Checkout my latest ALGO tweet for more info about the USDT pair.
That said - let’s focus on the ALGO/BTC pair:
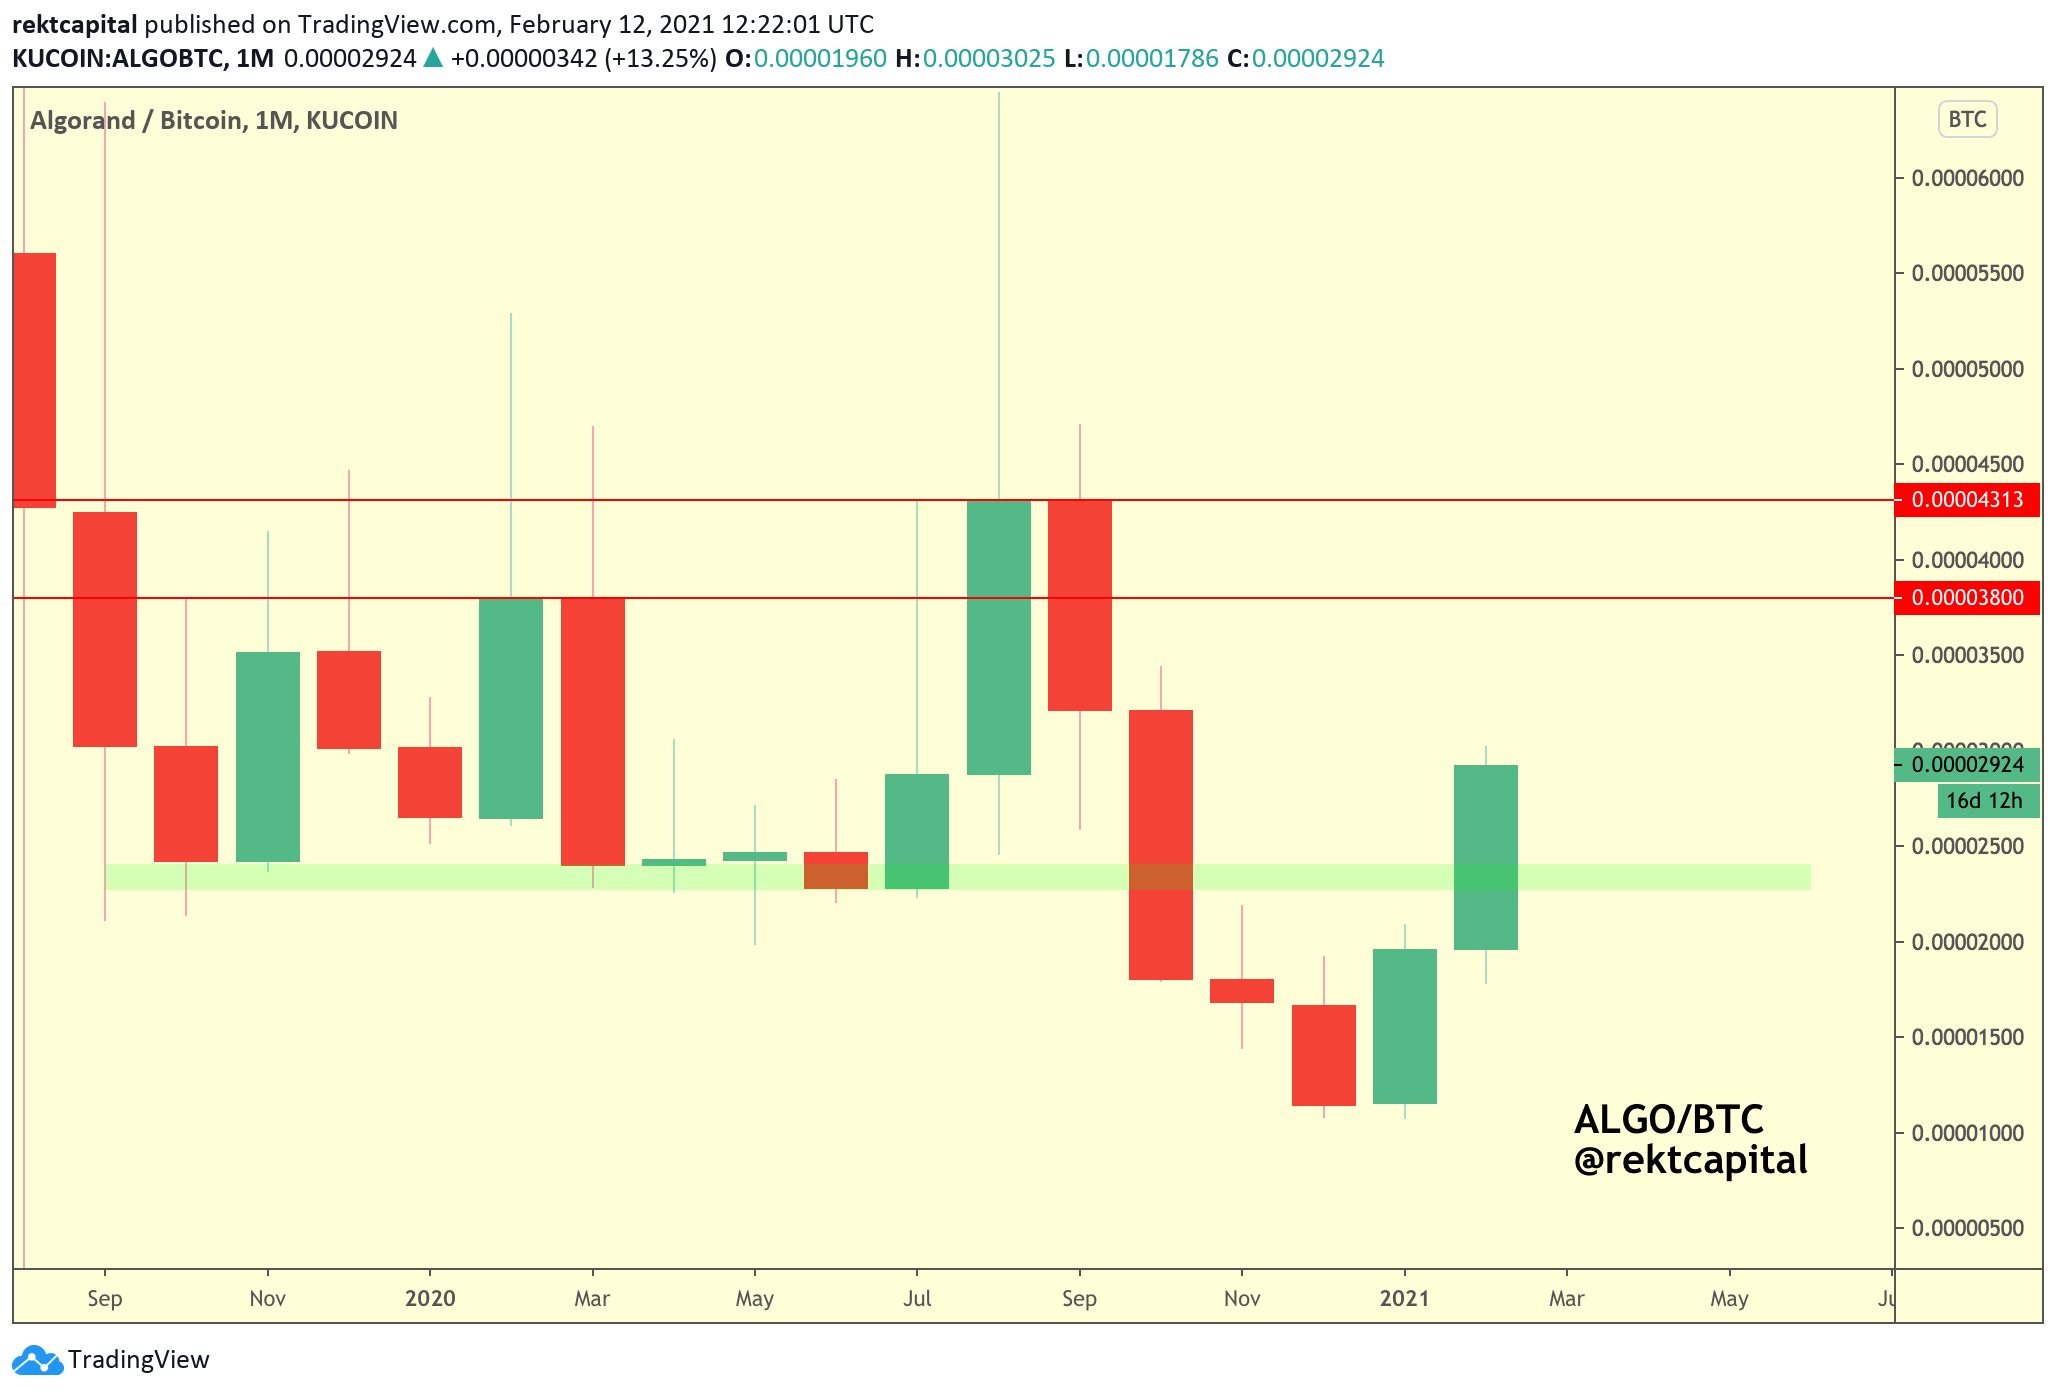
ALGO is now inside a green-red range, with the two red levels being areas that typically see upside volatility (i.e. FOMO wicks).
Now that ALGO is inside this Monthly range, ALGO should continue towards the upper levels of said range over time.
Question now is - is a dip possible before then?
If we ever get it, a dip into green would be a phenomenal opportunity.
Given limited price action, I can’t say how likely this is (though I have a feeling not very).
What’s more likely however would be a dip into one of the black levels:

But this really depends on how price Weekly Closes relative to these black levels.
Overall, the trend is up - question of how deep could ALGO dip before moving higher.
LINK/USD & LINK/BTC - Chainlink
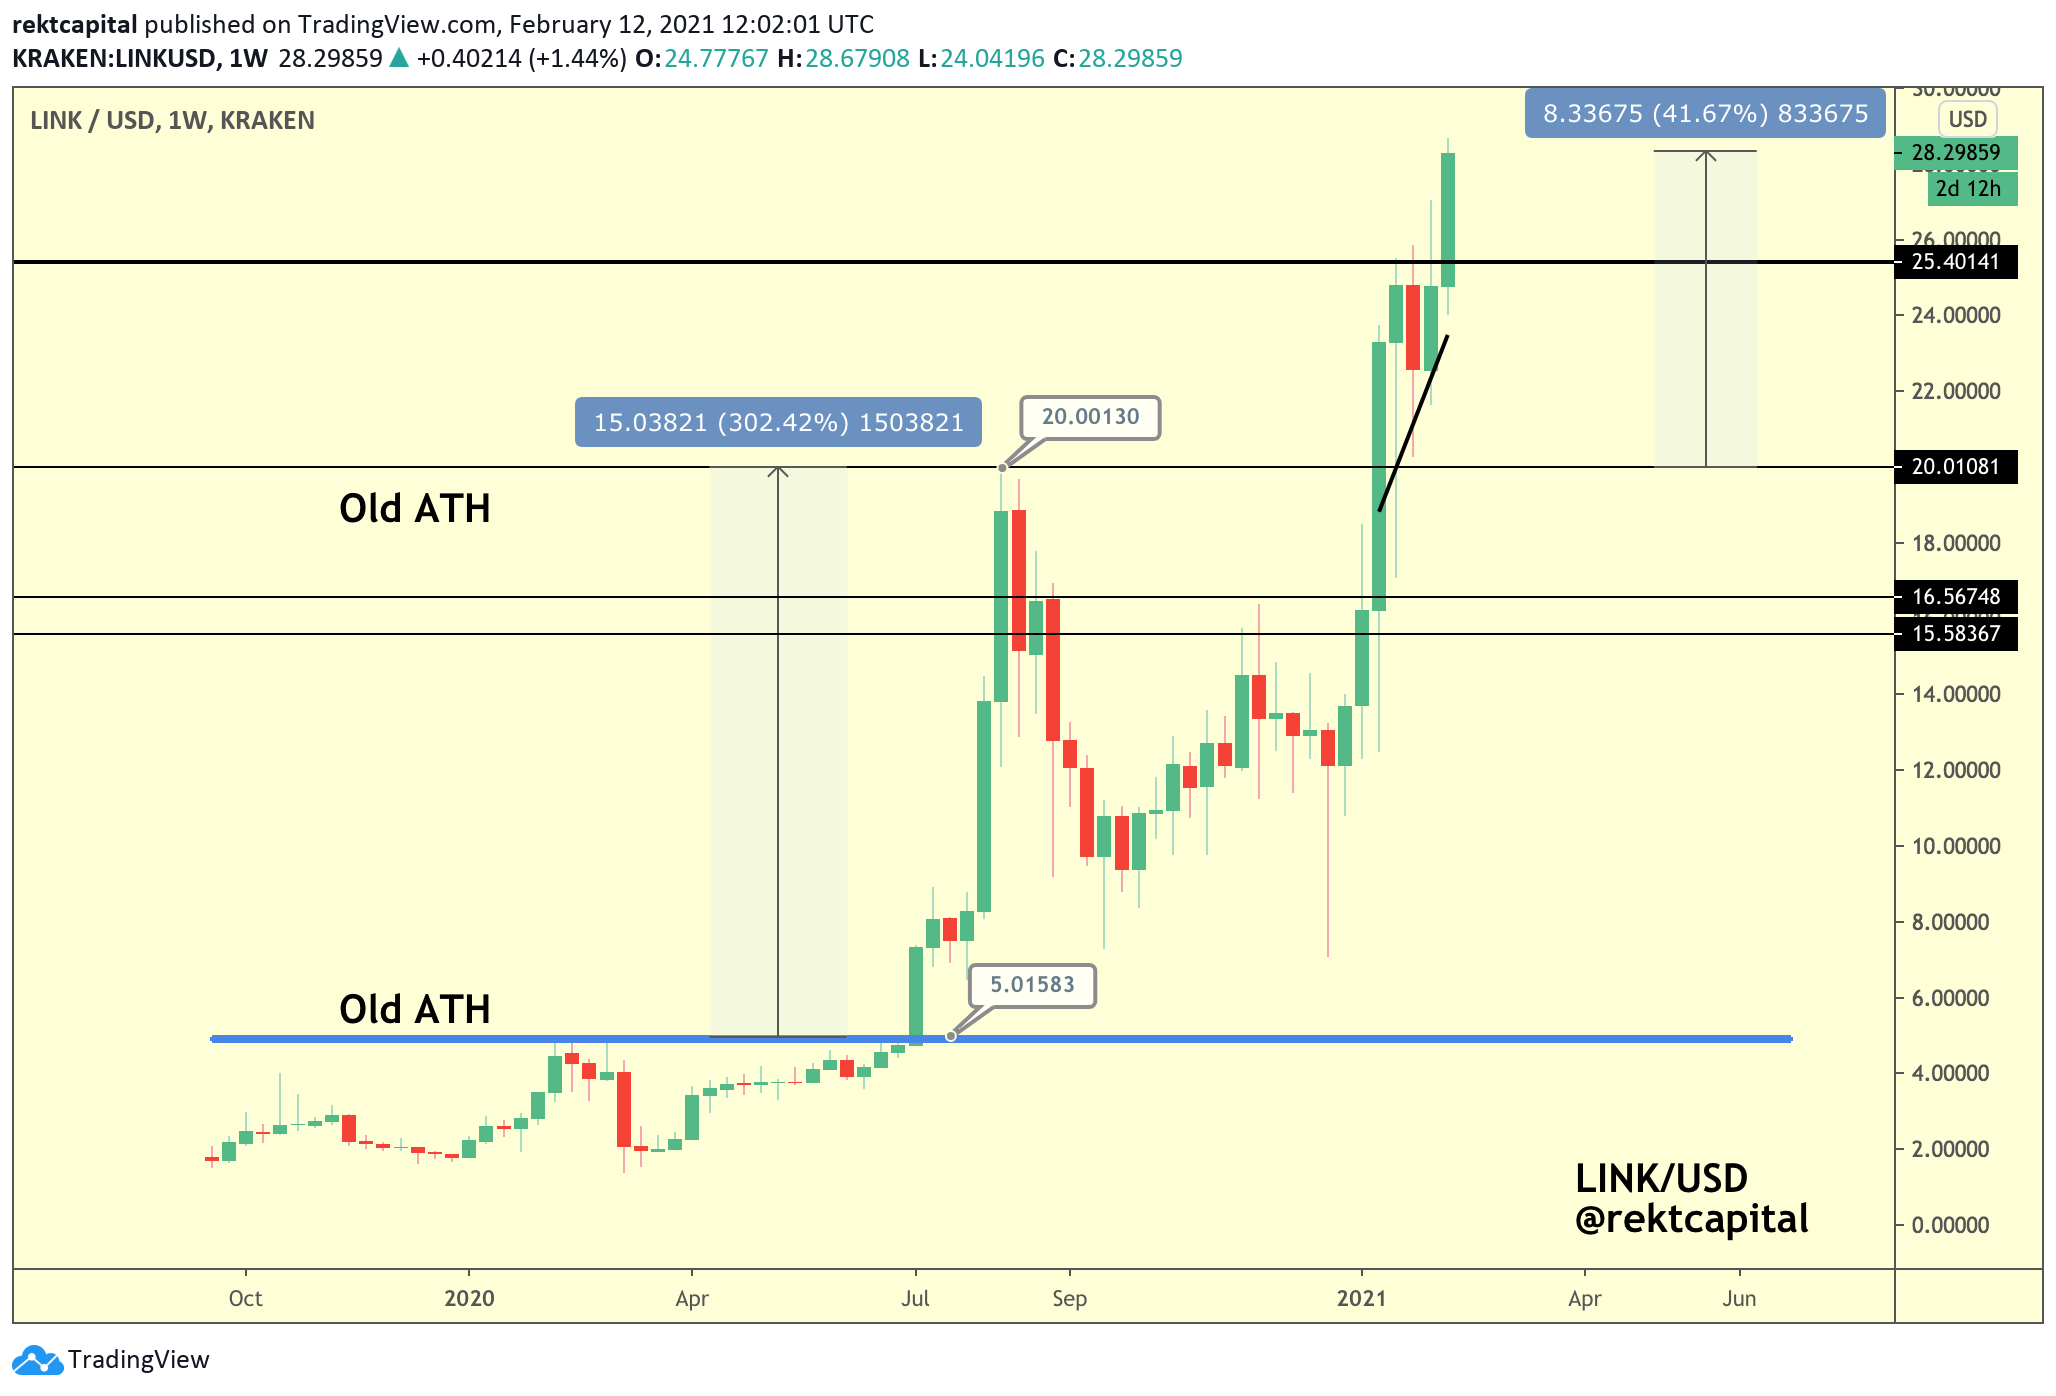
The last time LINK/USD broke its old ATH - it rallied over +300%.
LINK/USD is currently in Price Discovery, having rallied only +41% thus far.
It’s likely LINK will continue to rise over time.
The LINK/BTC pair has a different price predicament:
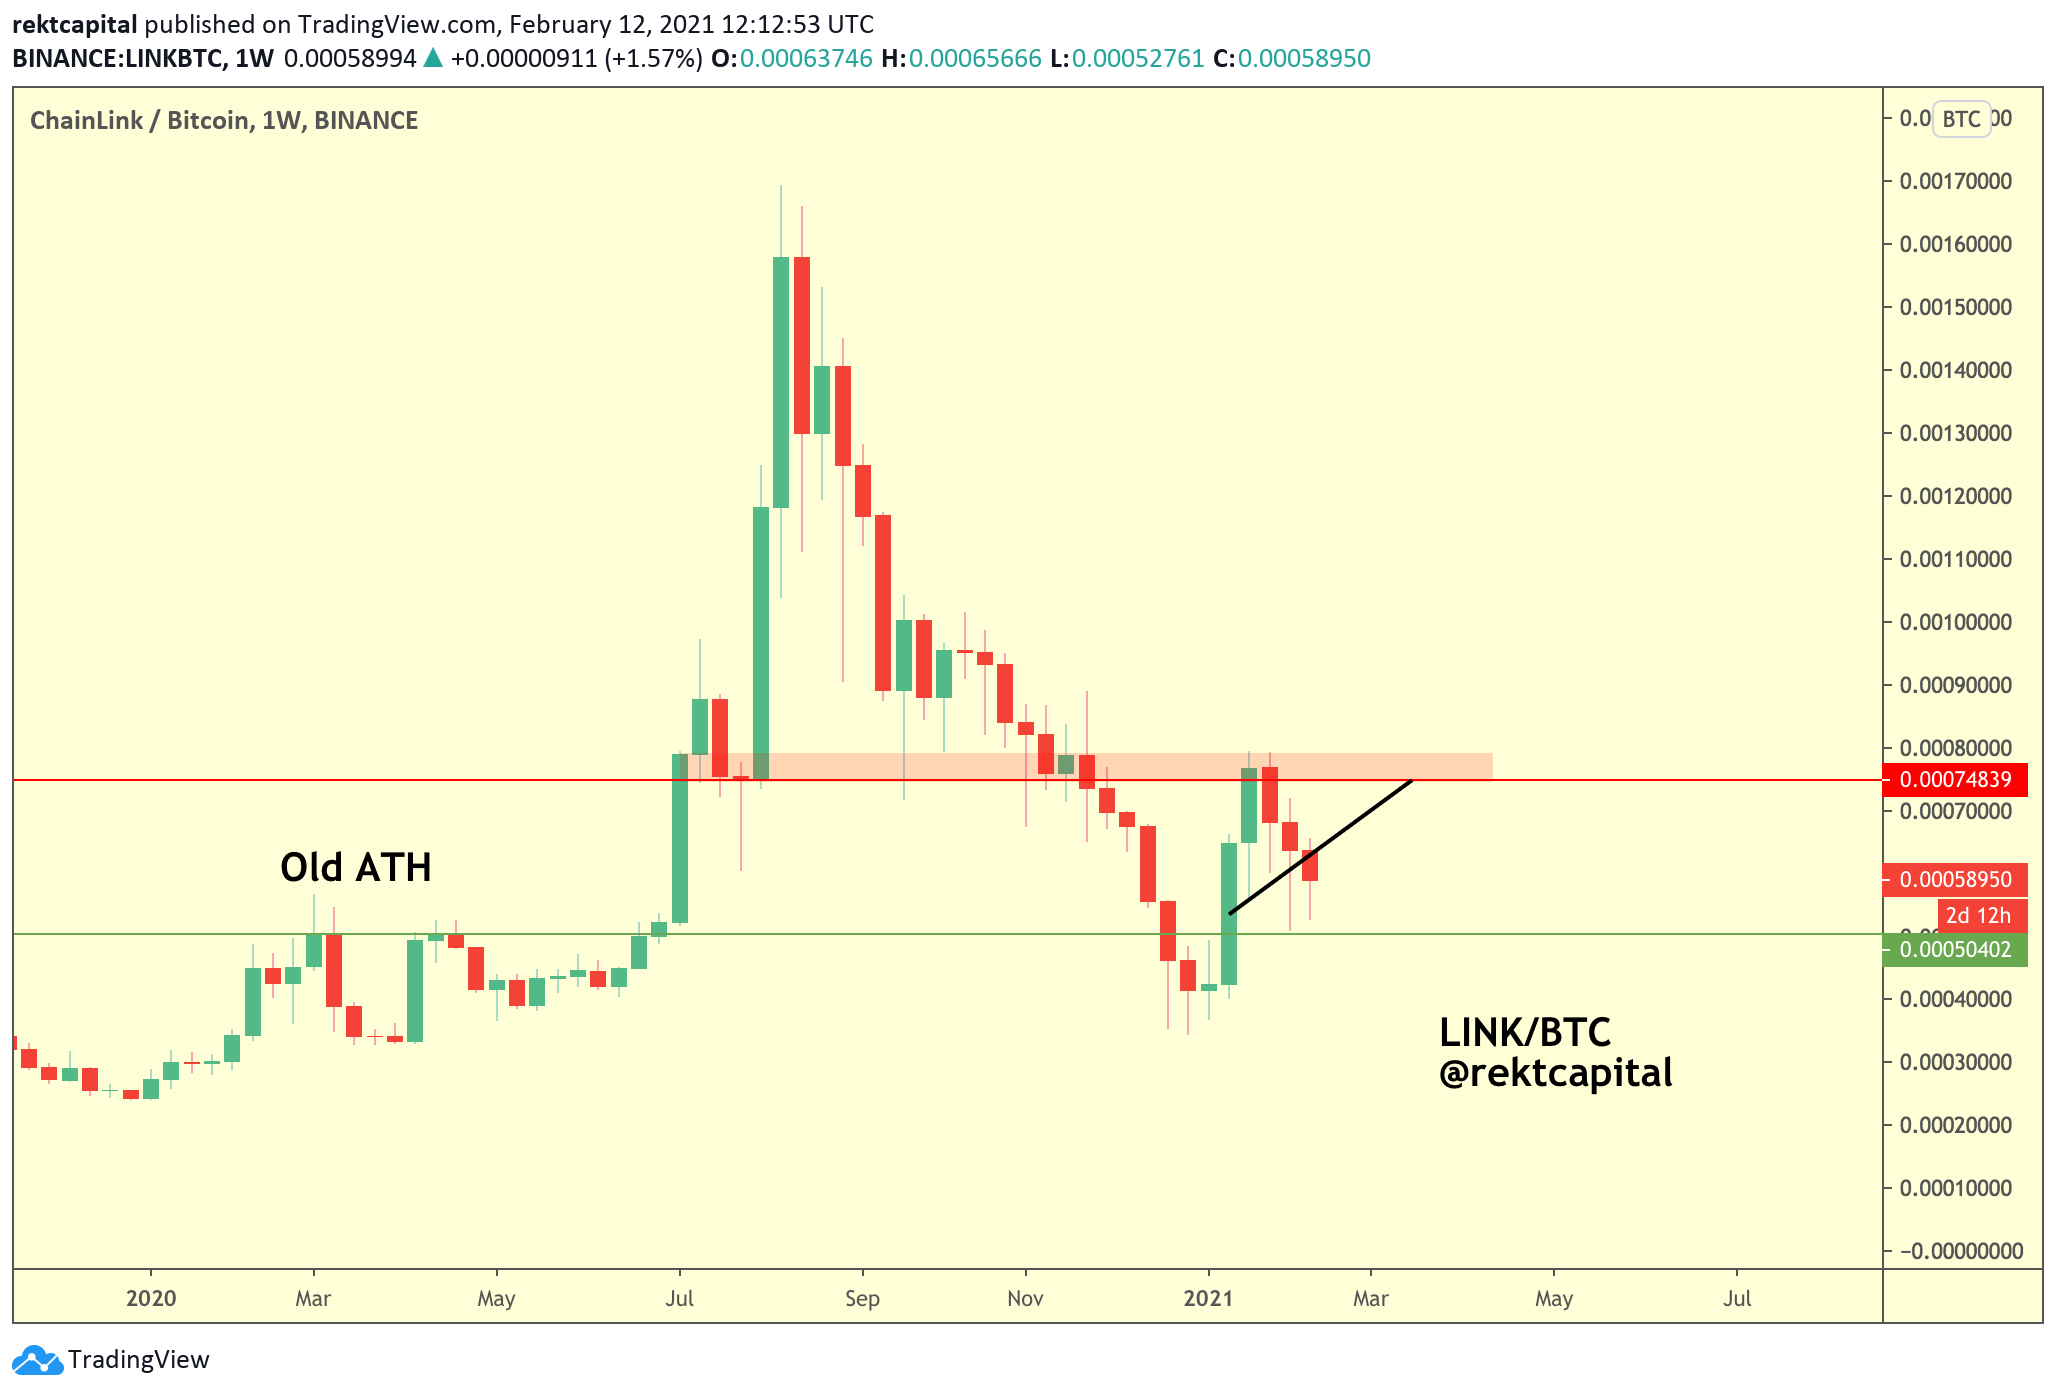
Recently lost the black uptrend line, LINK/BTC is inside the green-red range.
It is now testing the old ATH on the BTC pair (green) as support.
In fact, this current Weekly candle may be forming an early Higher Low relative to last week’s candle which saw a long downward wick.
These are typical signs that showcase slowing in the sell-side momentum.
Let’s see if the Weekly Close confirms this wick as it is today.
XLM/USD - Stellar
Here’s an excerpt from an early January Altcoin TA session:
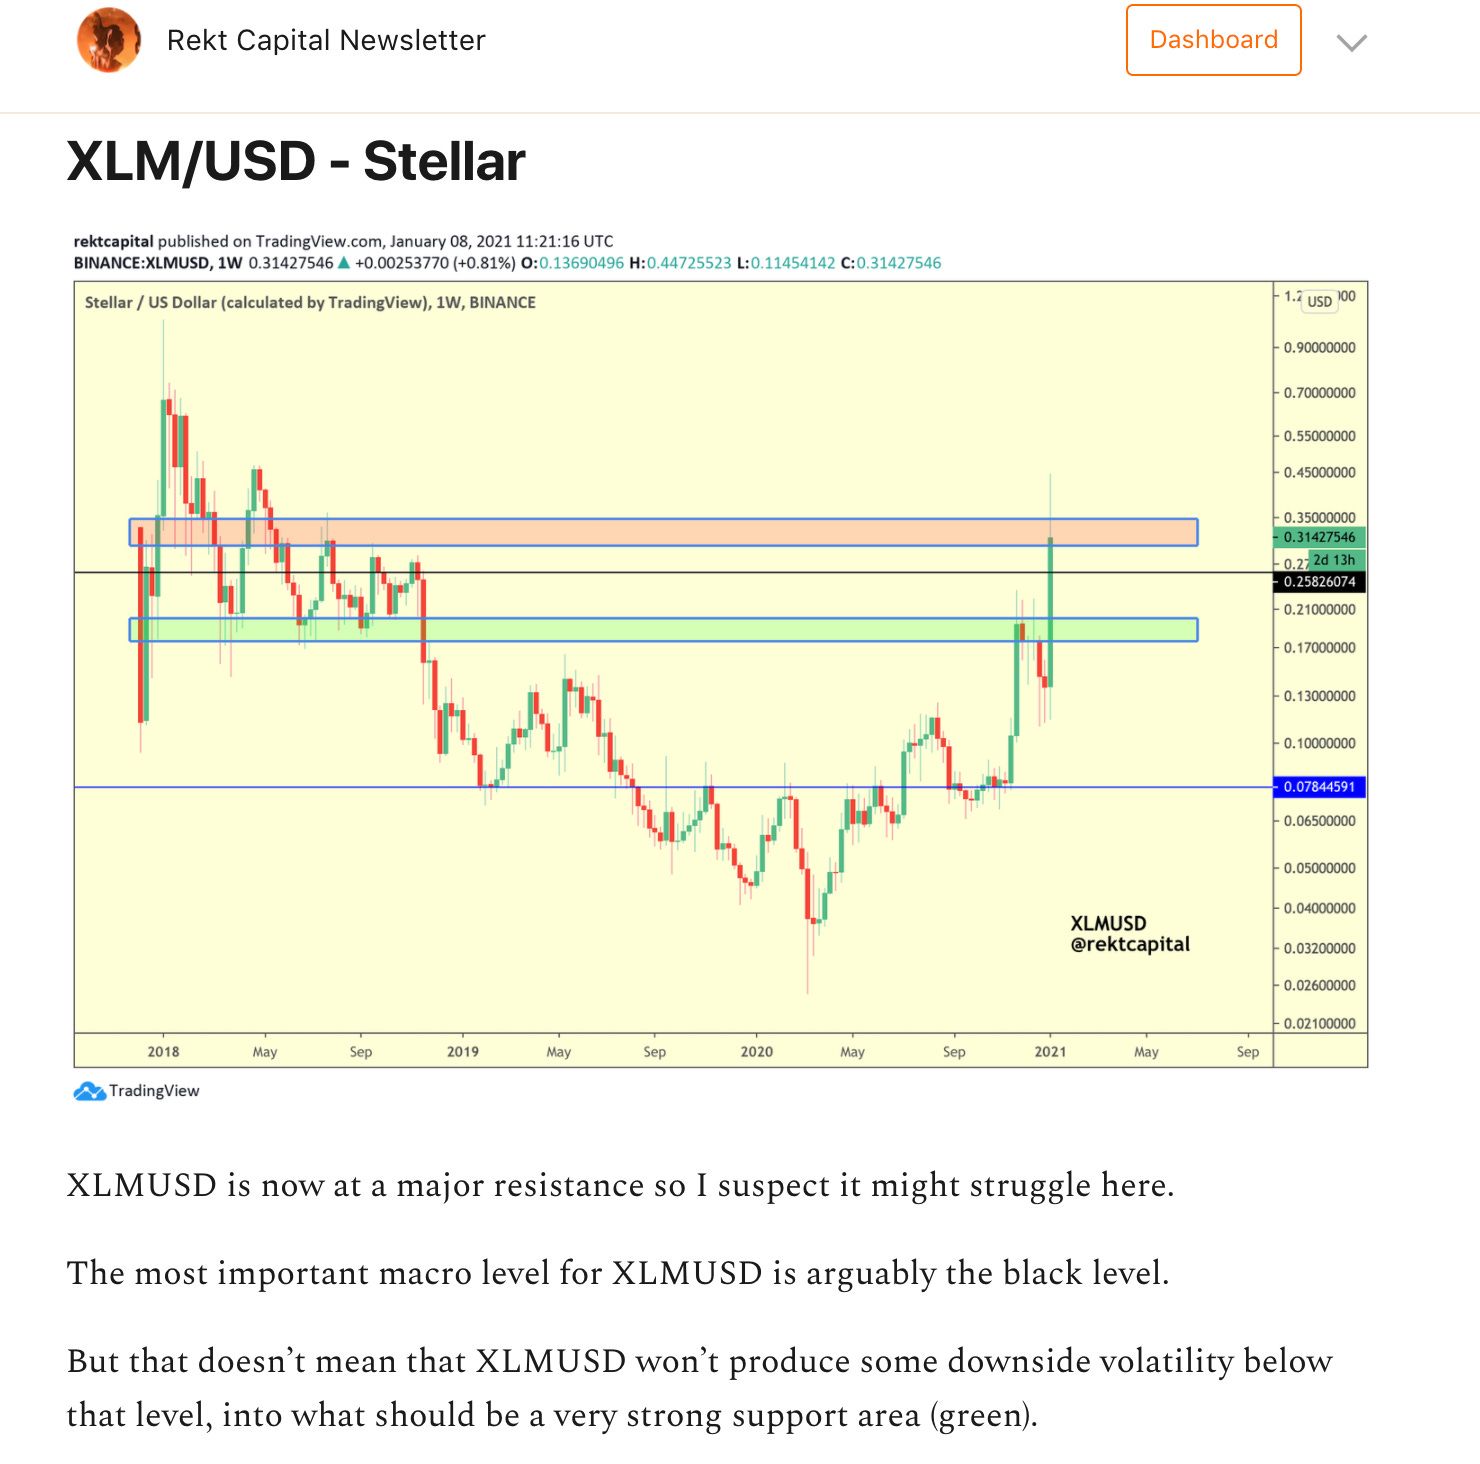
And here’s today’s update:
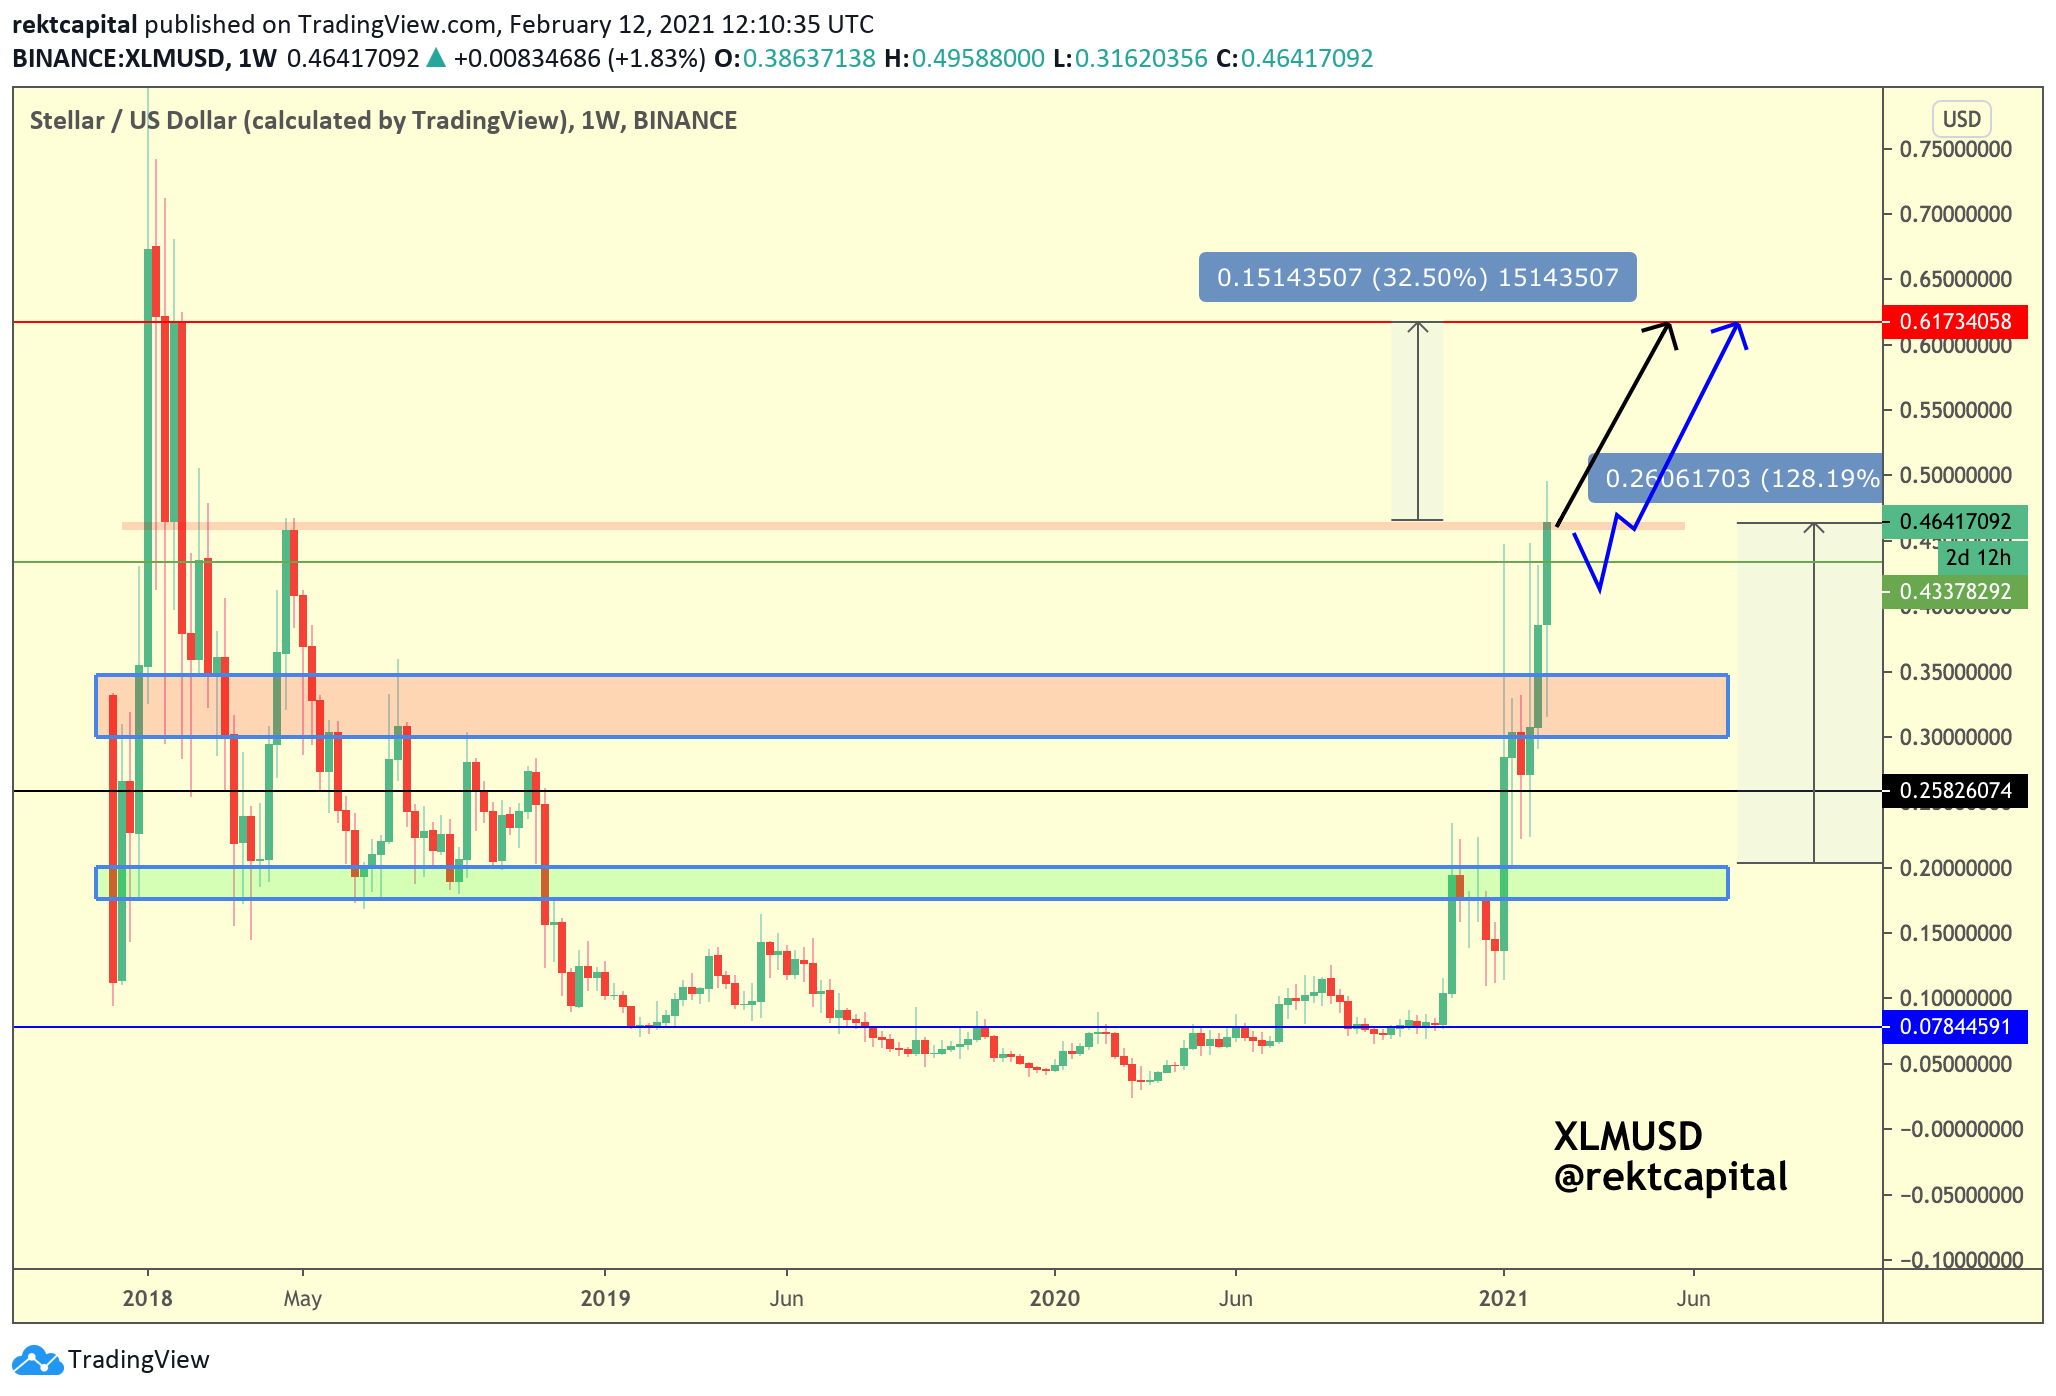
If XLM can turn the local red resistance into support, an over +30% rally awaits via the black pathway.
But if XLM needs to dip first before turning red into support, it would take the blue pathway instead.
Important this current candle doesn’t end up as a wick below the green level, so needs to keep it as support heading into the Weekly Close.
COTI/BTC - COTI
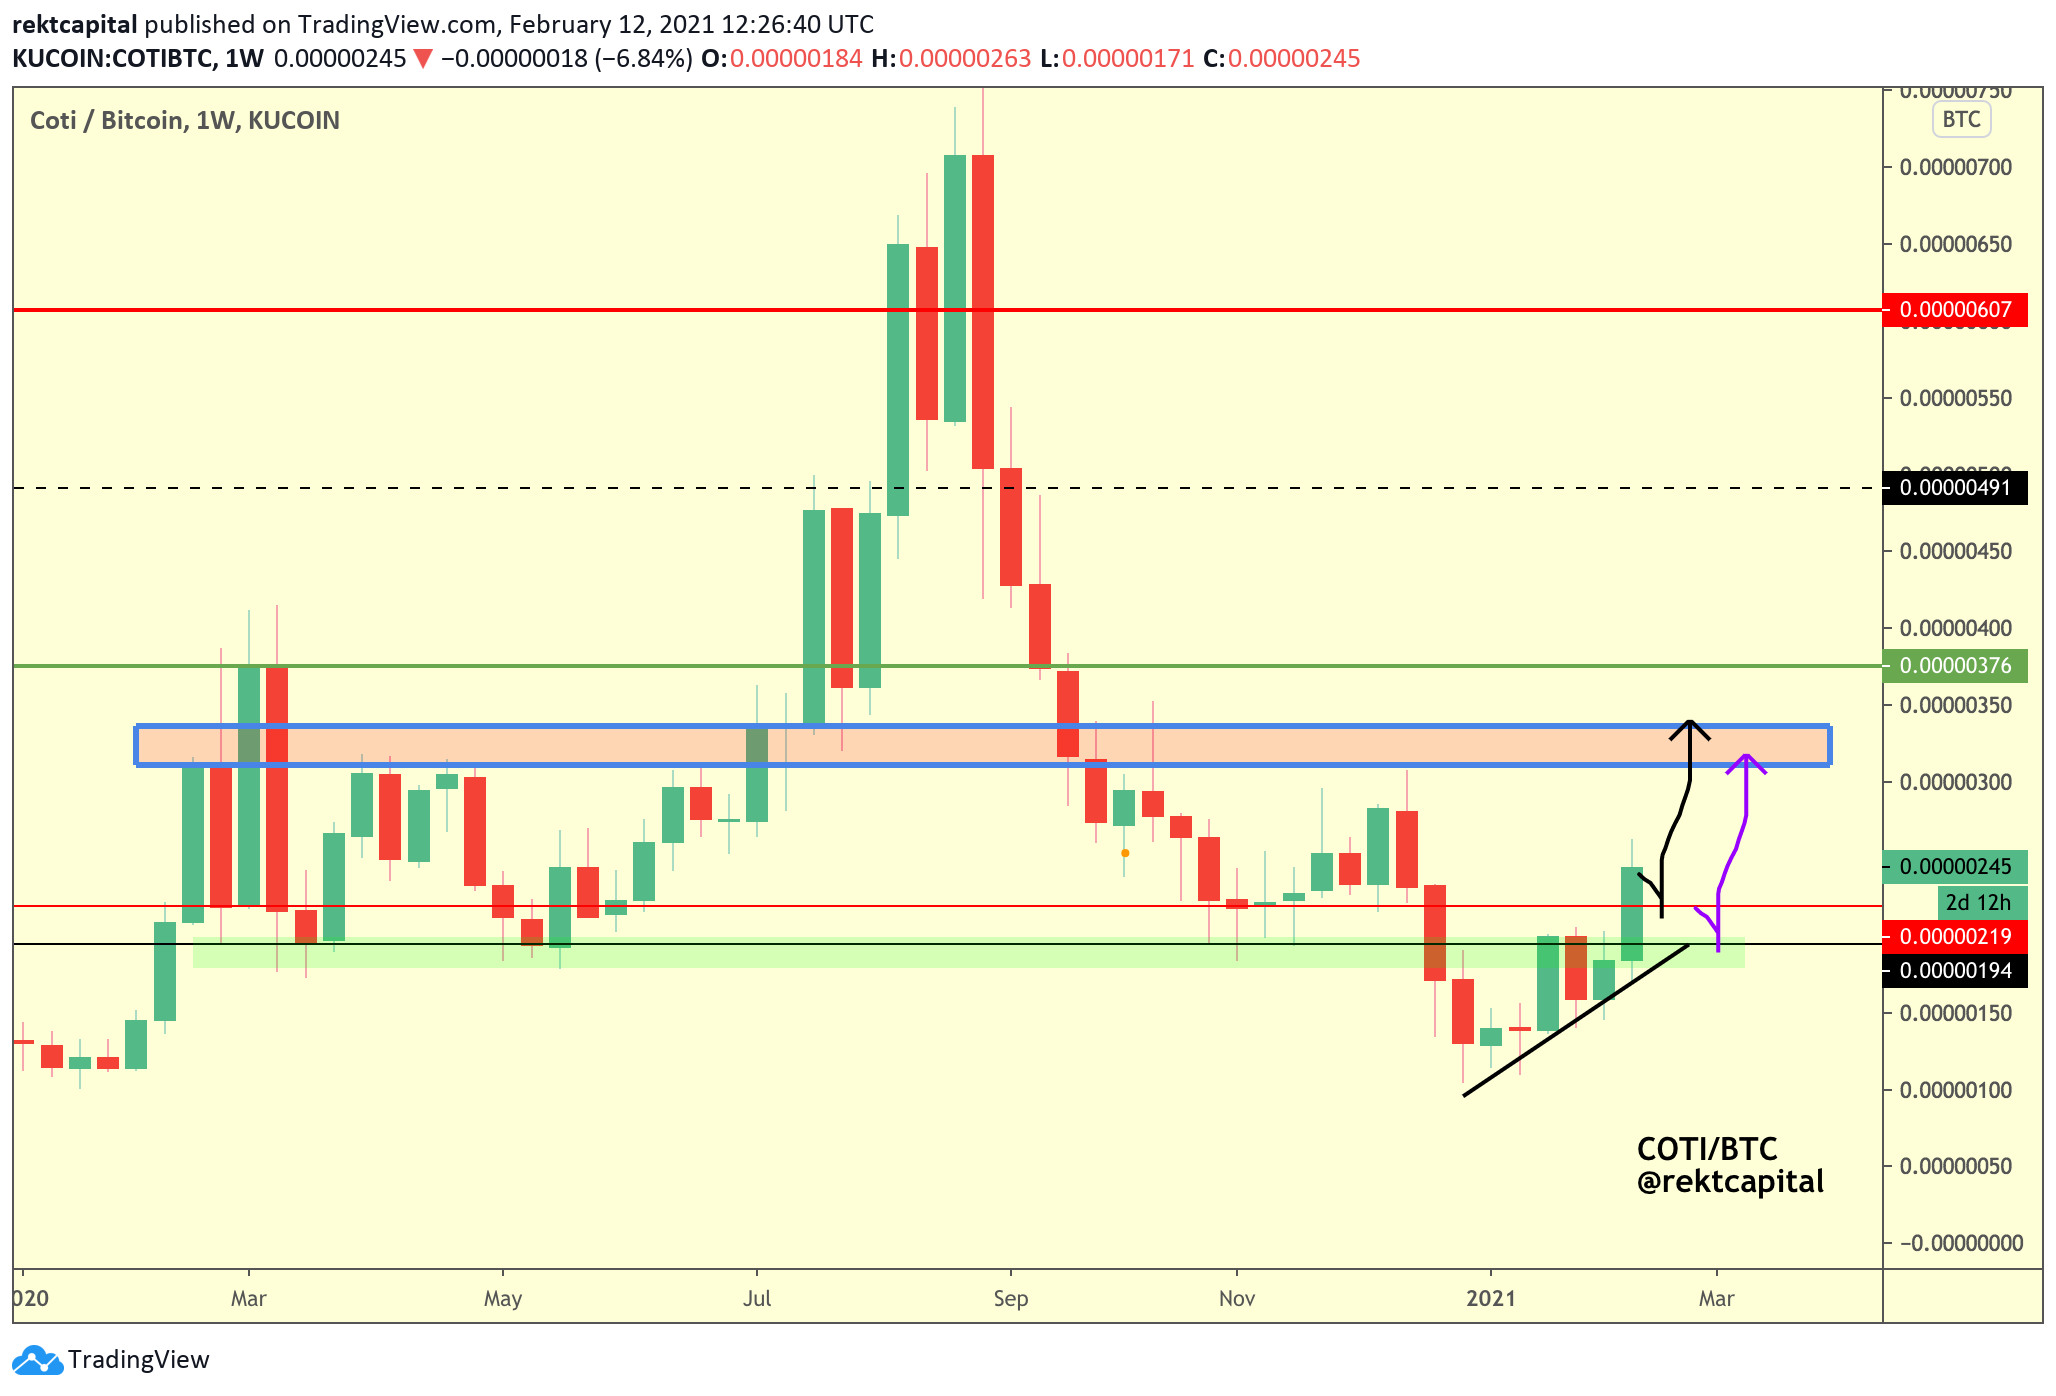
COTI recently broke out from a macro Ascending Triangle.
Question now is - where is it going to dip?
COTI tends to be quite volatile on dips given its market cap and so a pullback into green via the purple pathway isn’t out of the question.
The most important thing however is that COTI maintains itself above the local red level on the Weekly.
However deep the dip - COTI looks well positioned for further upside via either the black or purple pathways.
OCEAN/BTC - Ocean Protocol
Earlier this month, I shared on Twitter that OCEAN was forming a Bull Flag:
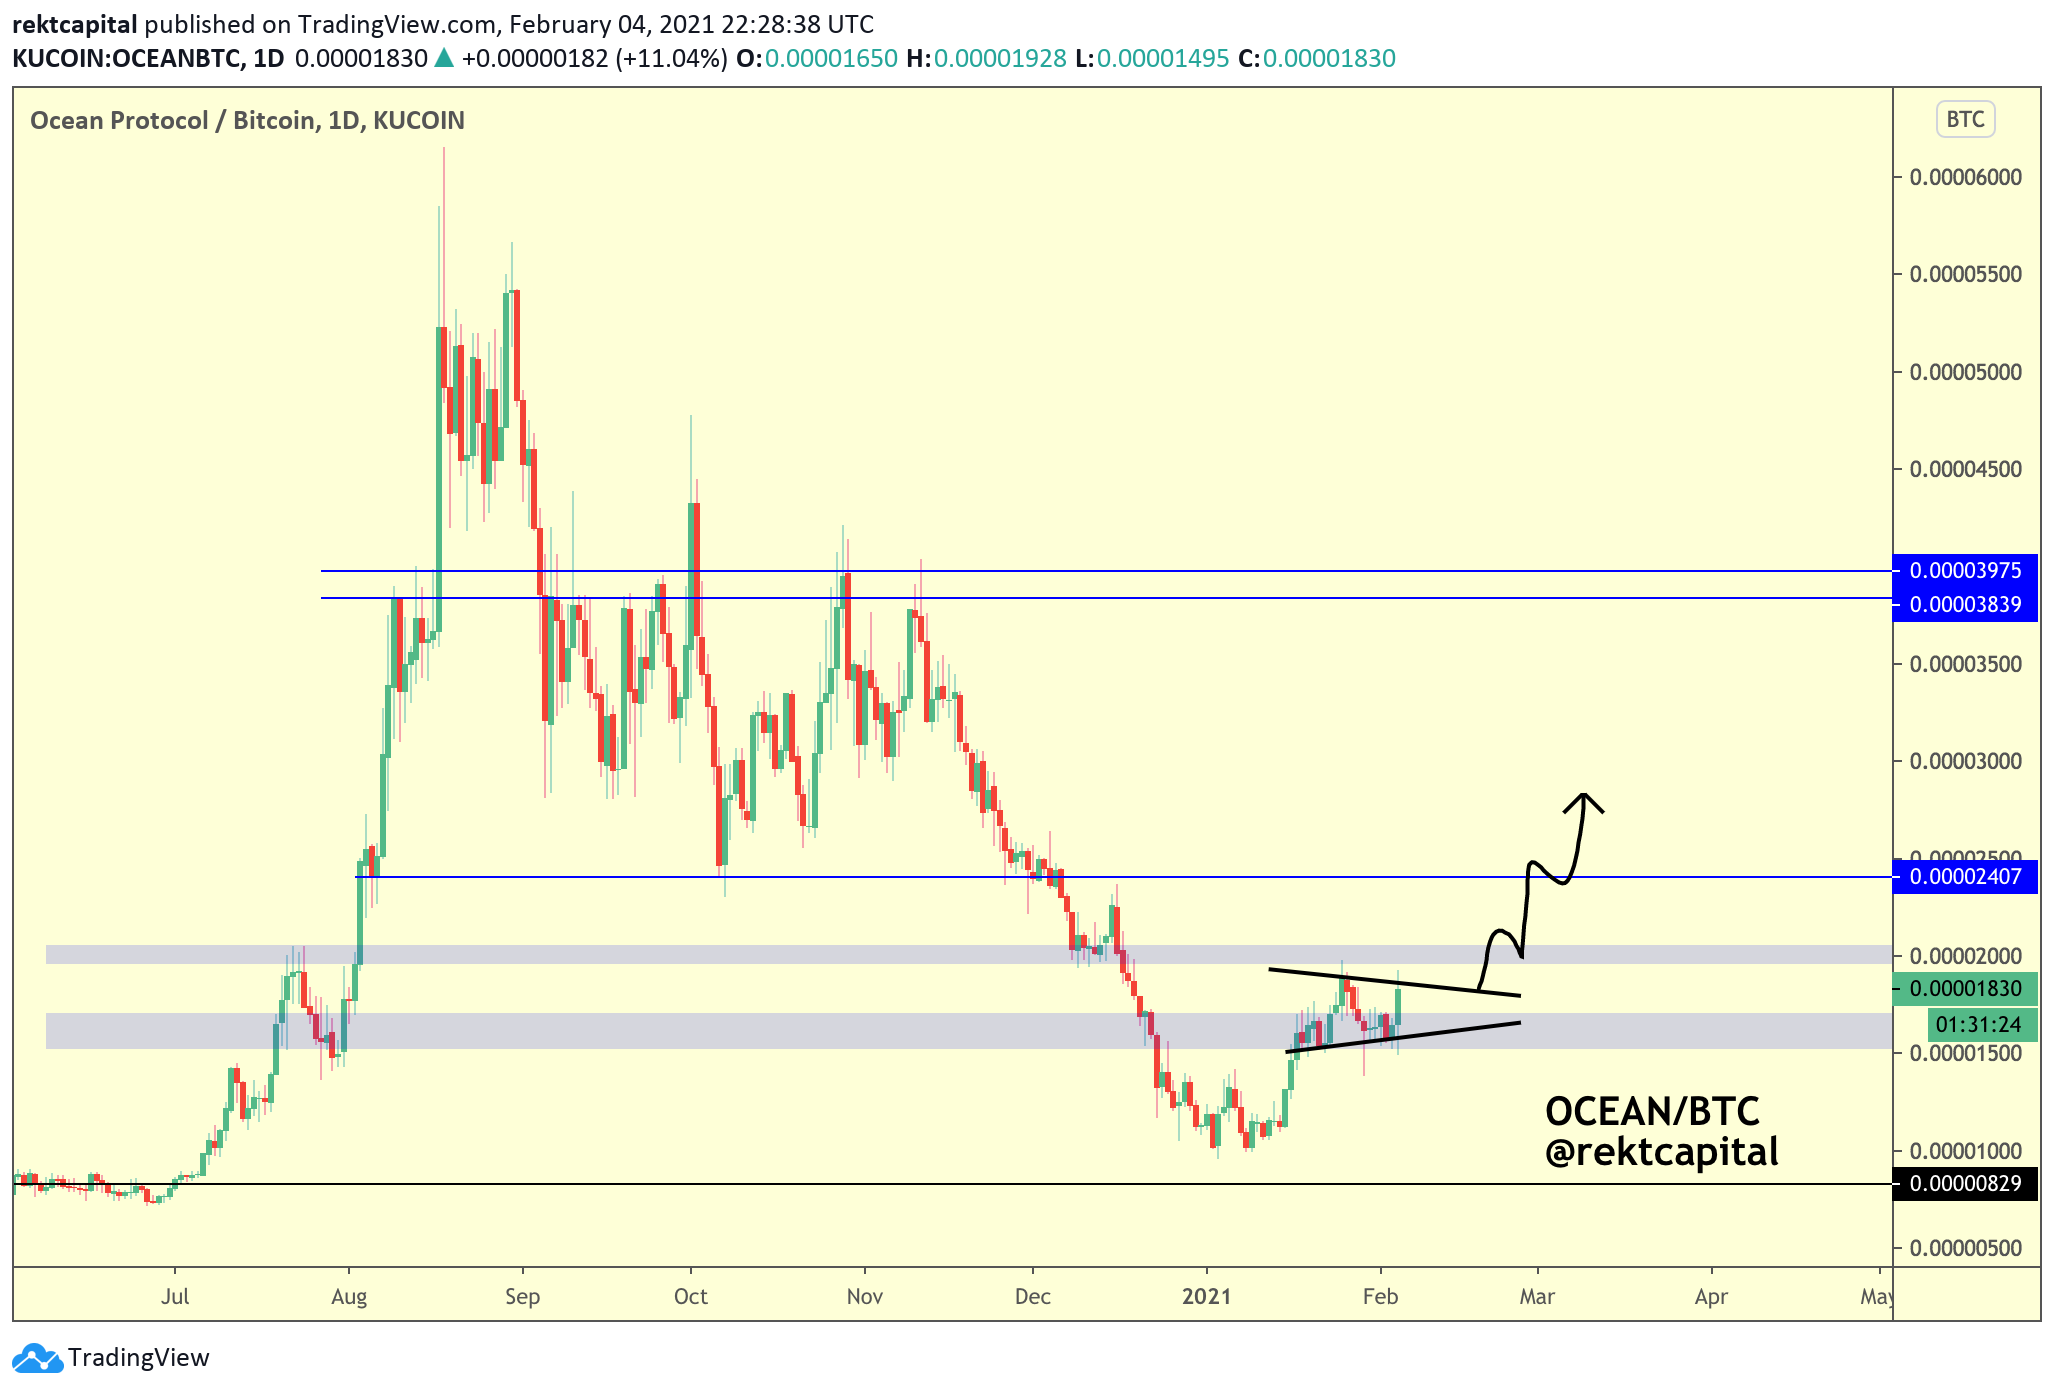
Since then, OCEAN has broken out into an over +30% rally, following the black pathway perfectly:

At this stage, I’m simply watching for OCEAN to potentially pullback into the local blue level as per the black pathway.
Should the Weekly candle close above the blue level, that would be the confirmation OCEAN needs to revisit the red area again.
Breaching that red area and OCEAN will be able to revisit the top of the blue range over time.

I’m excited to share that the Rekt Capital Technical Analysis Course has reached over 50 Five-Star ratings!
I am incredibly proud of this educational resource and am happy to hear it makes Students feel more confident and prepared to make the most of this exciting Bull Market.
Feel free to check out the Rekt Capital Technical Analysis course to learn all the tools you need to succeed in the Crypto market.
Designed for both beginner and intermediate traders and investors.
Rated 5/5 stars by Students.
VET/BTC - VeChain
In a mid-January edition of the newsletter, I shared this Falling Wedge on VET:
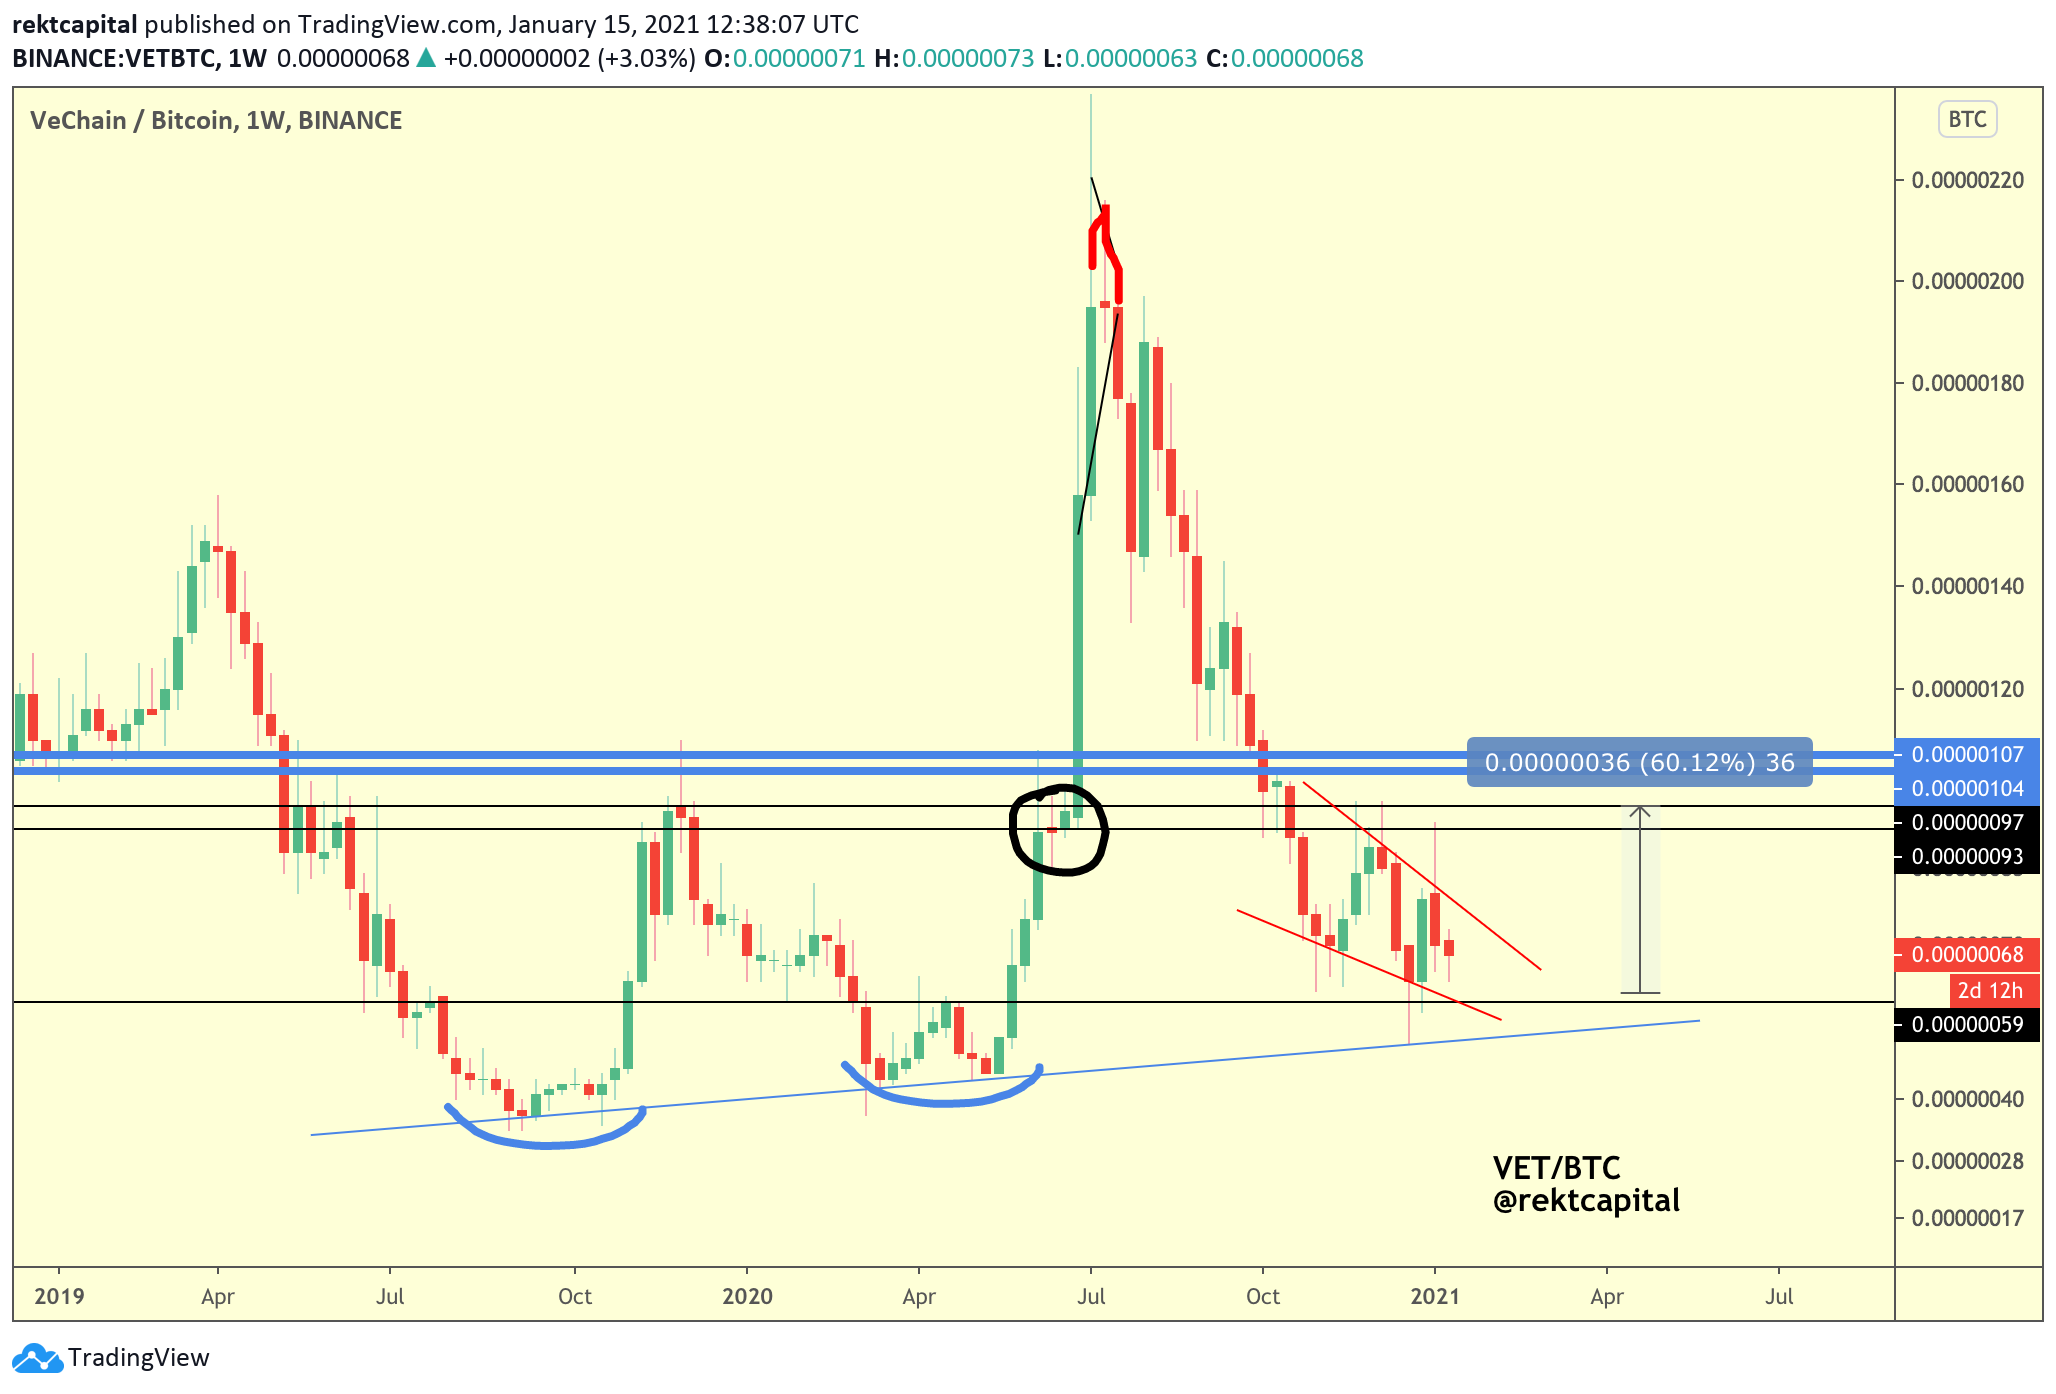
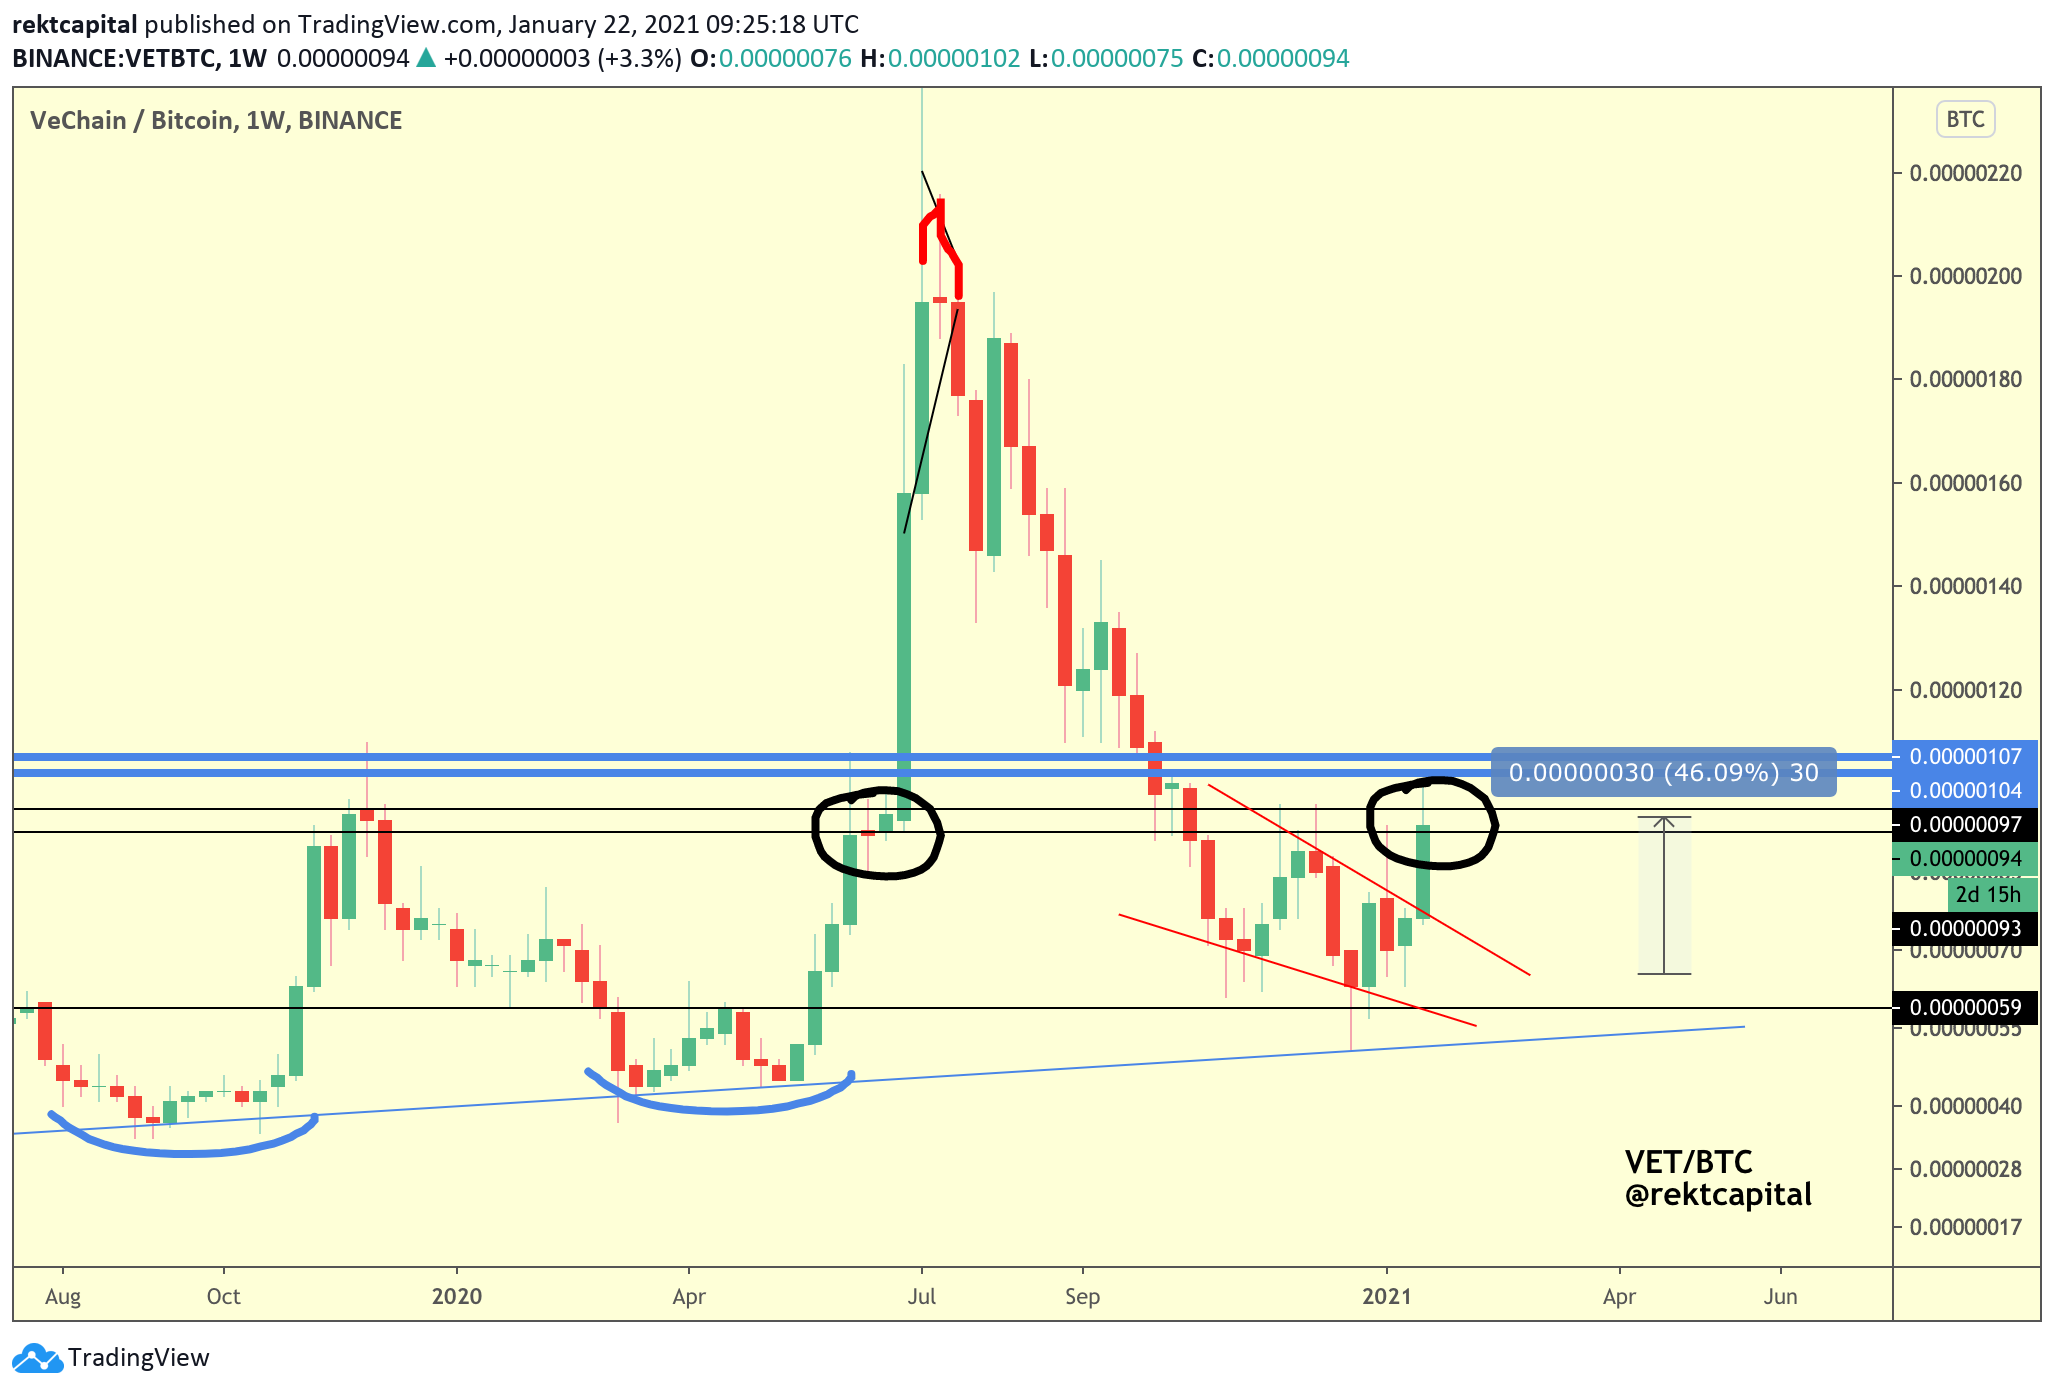
And if VET were able to turn the black circled area into support - the new trend would continue further.
But it didn’t a few weeks ago:
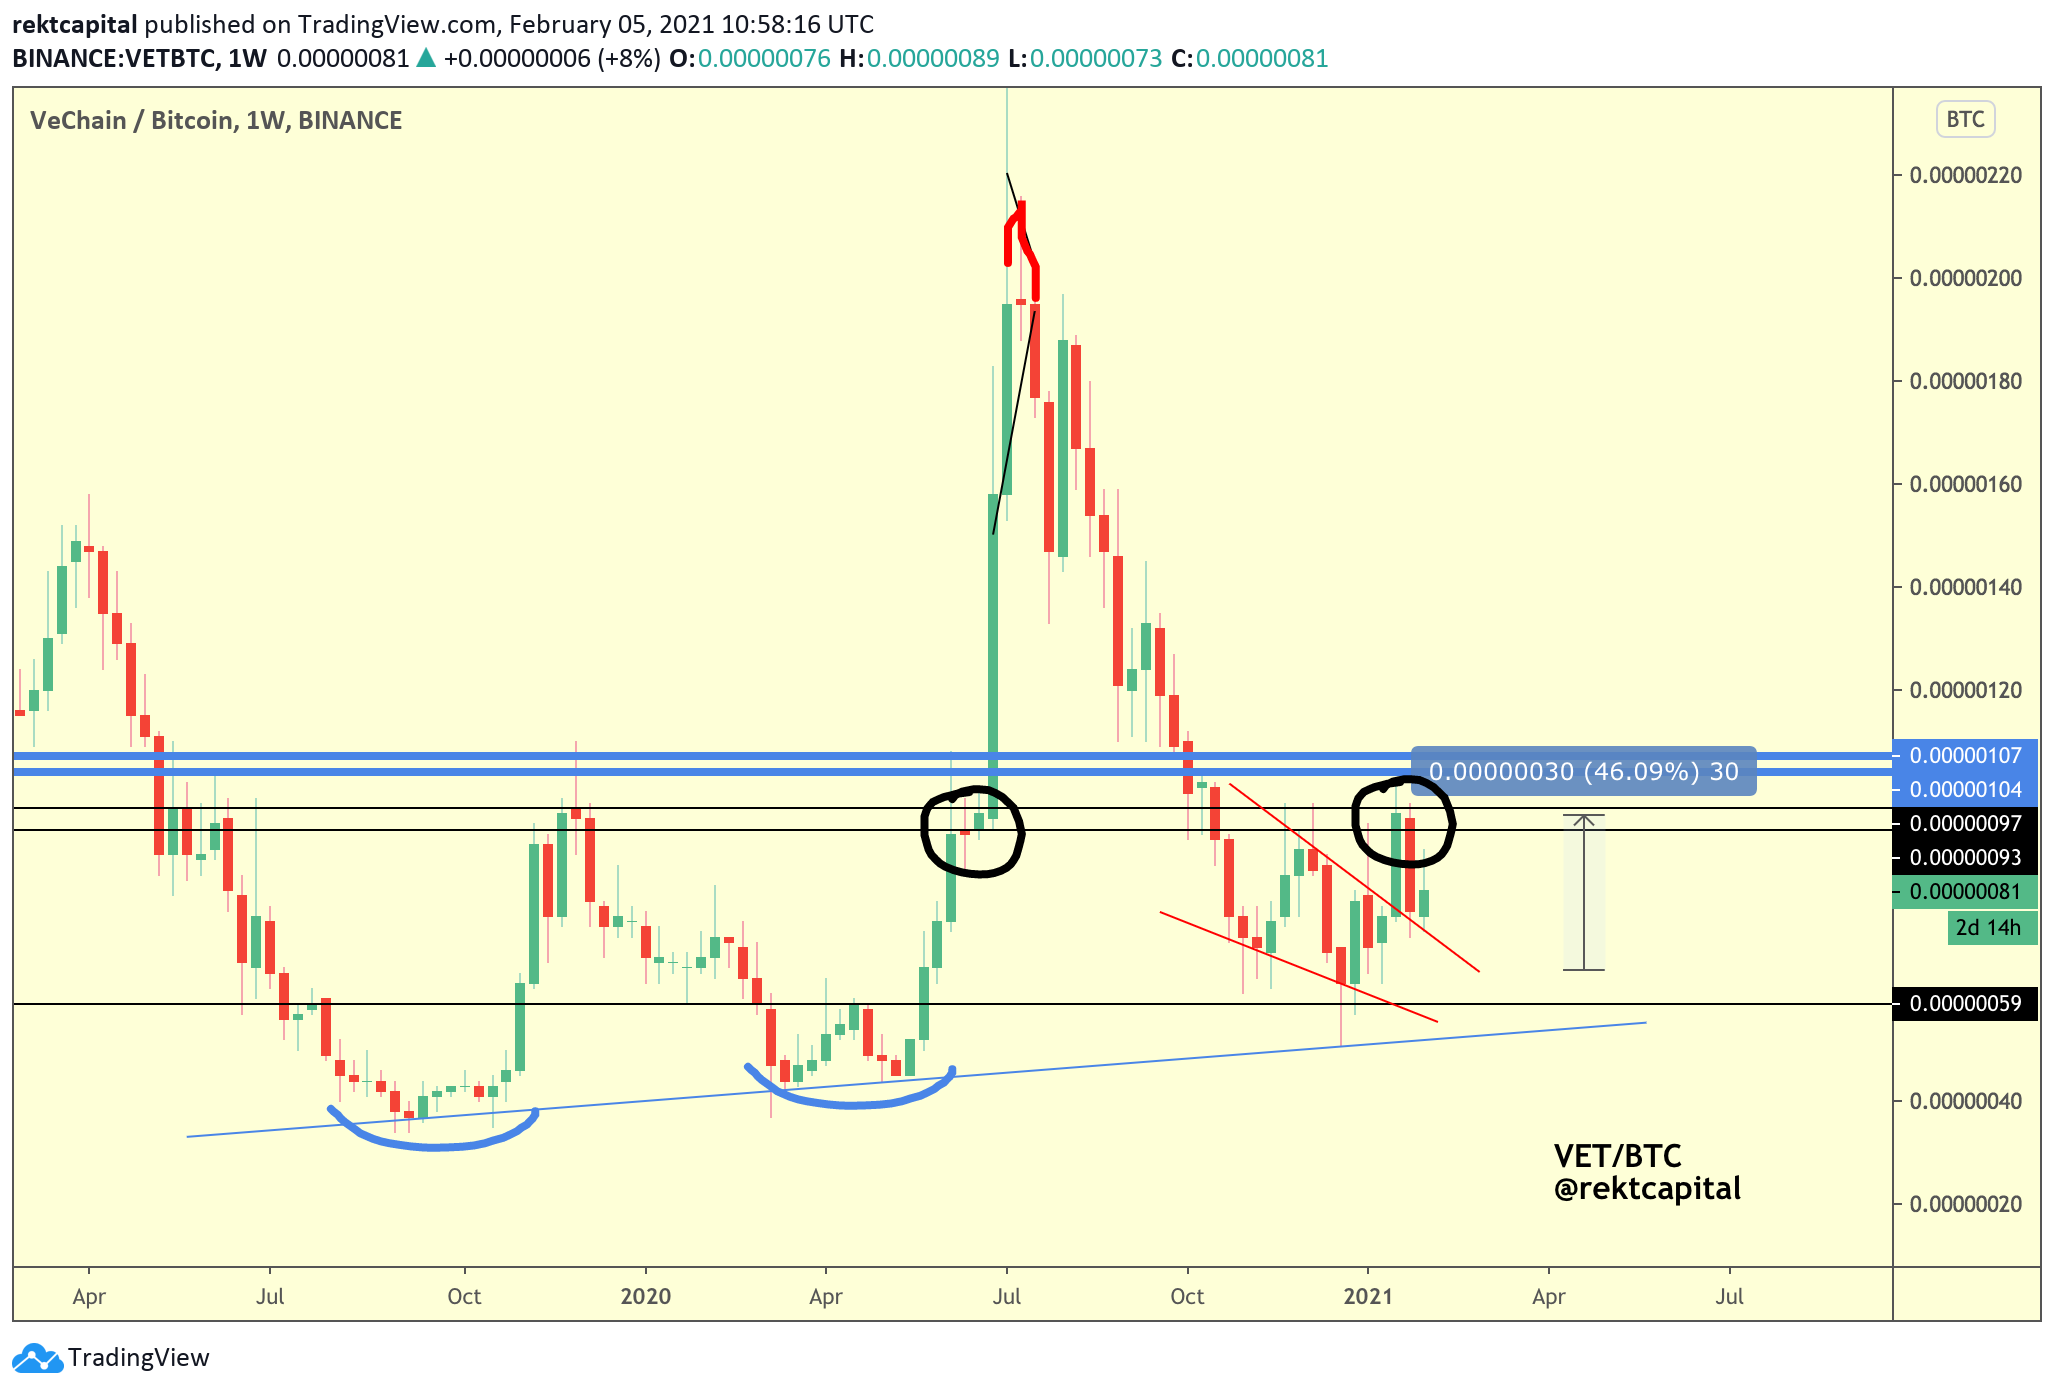
In fact, VET pulled back to successfully retest the Falling Wedge…

Now VET is back in the black circled area. Turn this area into support and the trend will continue much higher.
RSR/USDT - Reserve Rights
Speaking of Falling Wedge breakouts - RSR enjoyed a retest of its previous breakout pattern just like VET/BTC:

RSR has since followed through on its retest attempt - perfectly following the black pathway:
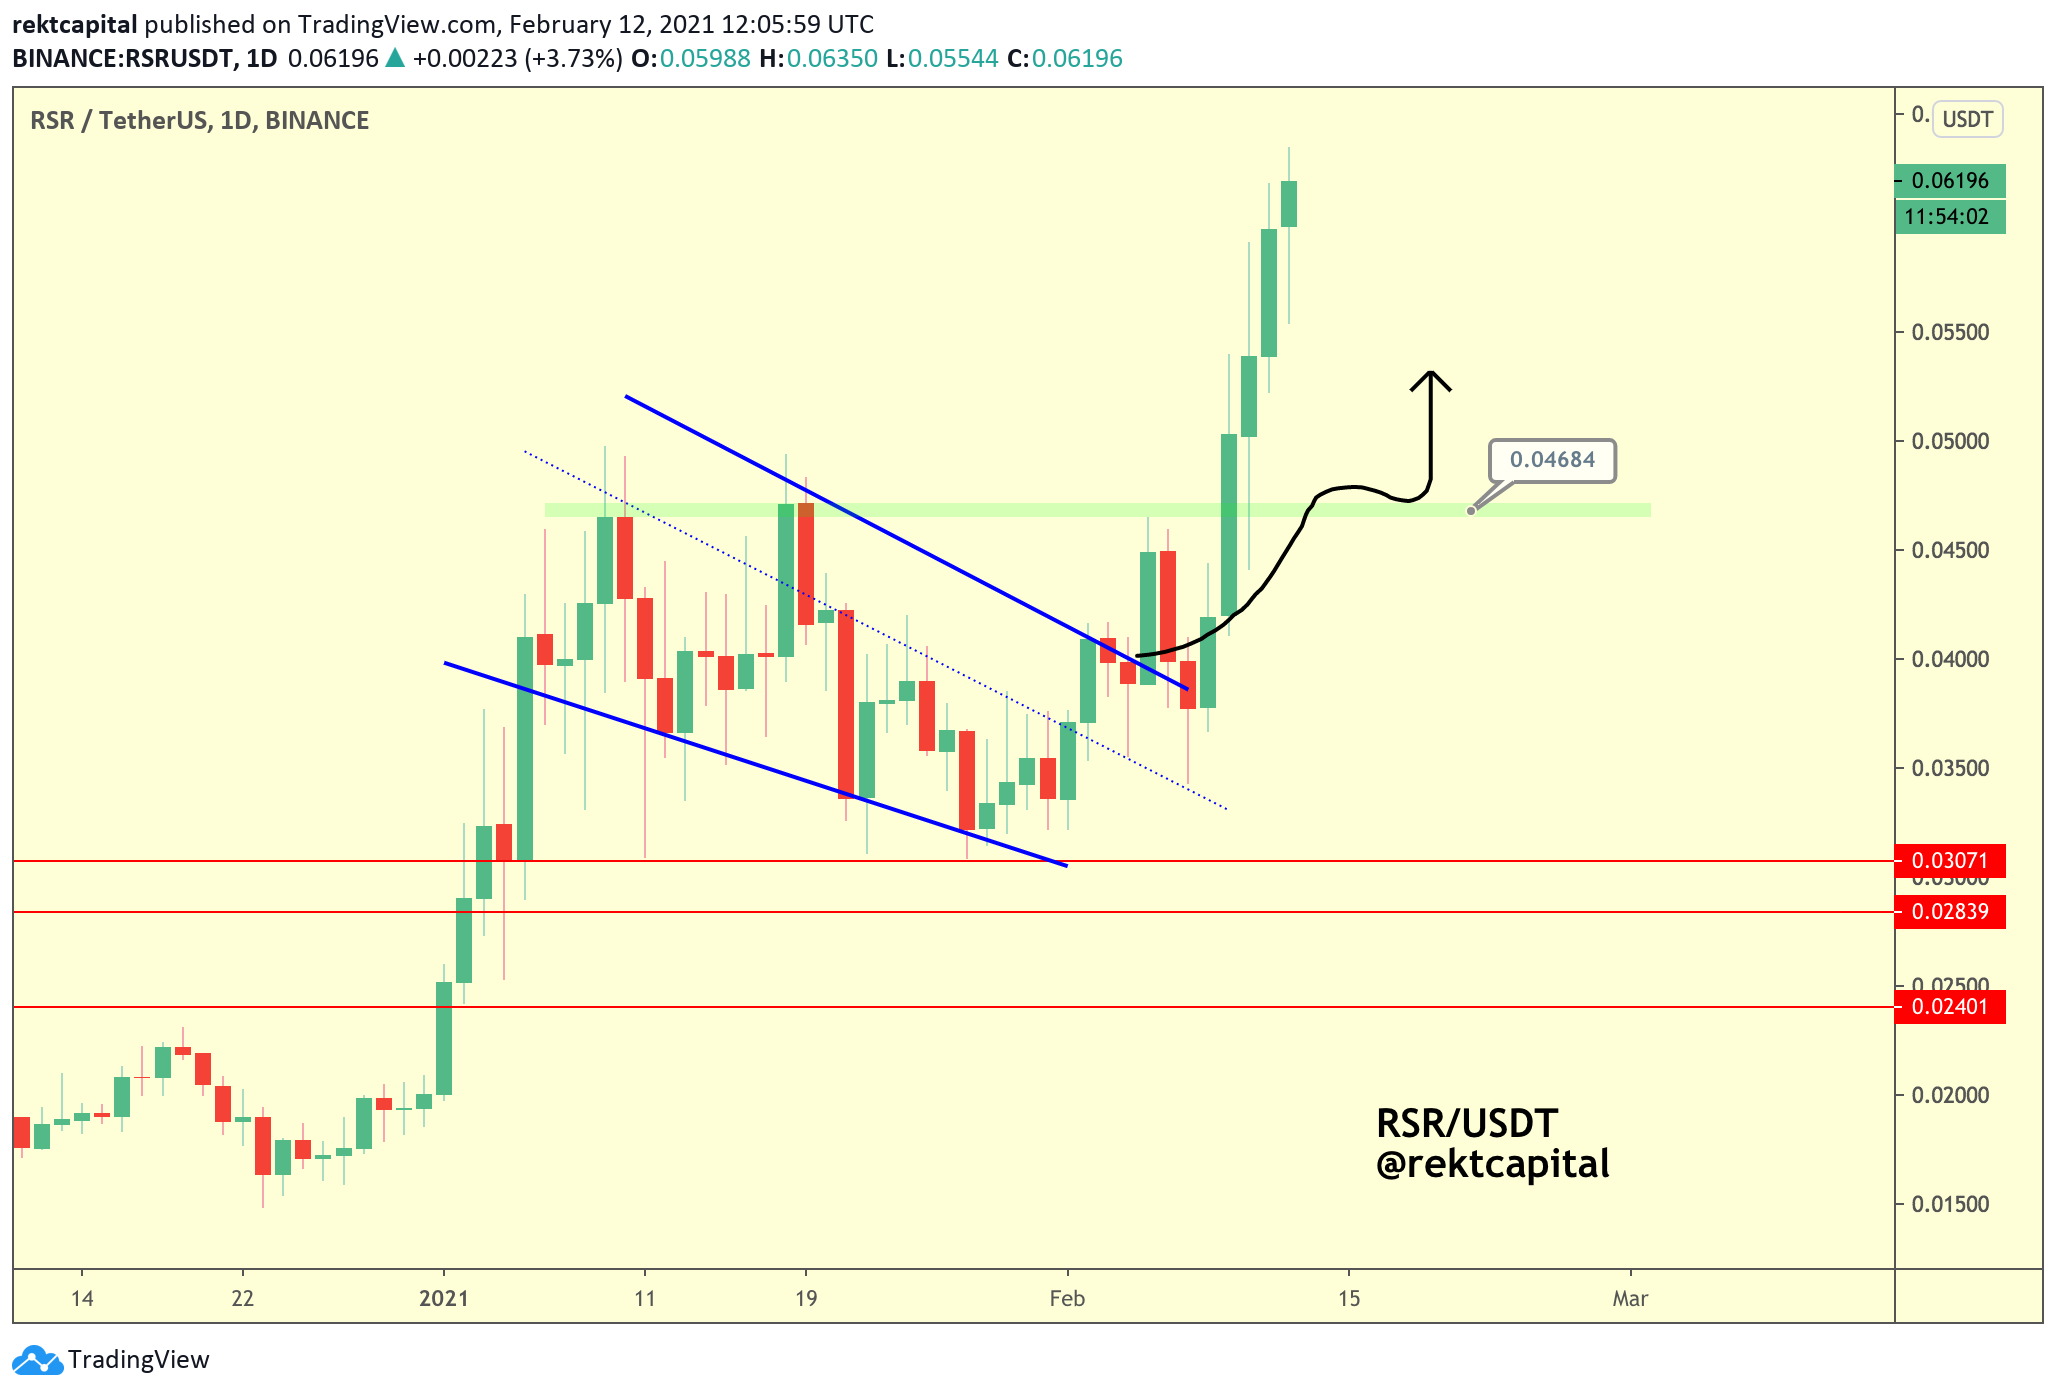
RSR is now in Price Discovery. Theoretically - sky is the limit but in case of a deeper dip, the green area (i.e. old ATH) will be an important area of historical demand.
ONE/USD - Harmony
In a mid-January session for the newsletter, ONE needed to turn the red area into support:
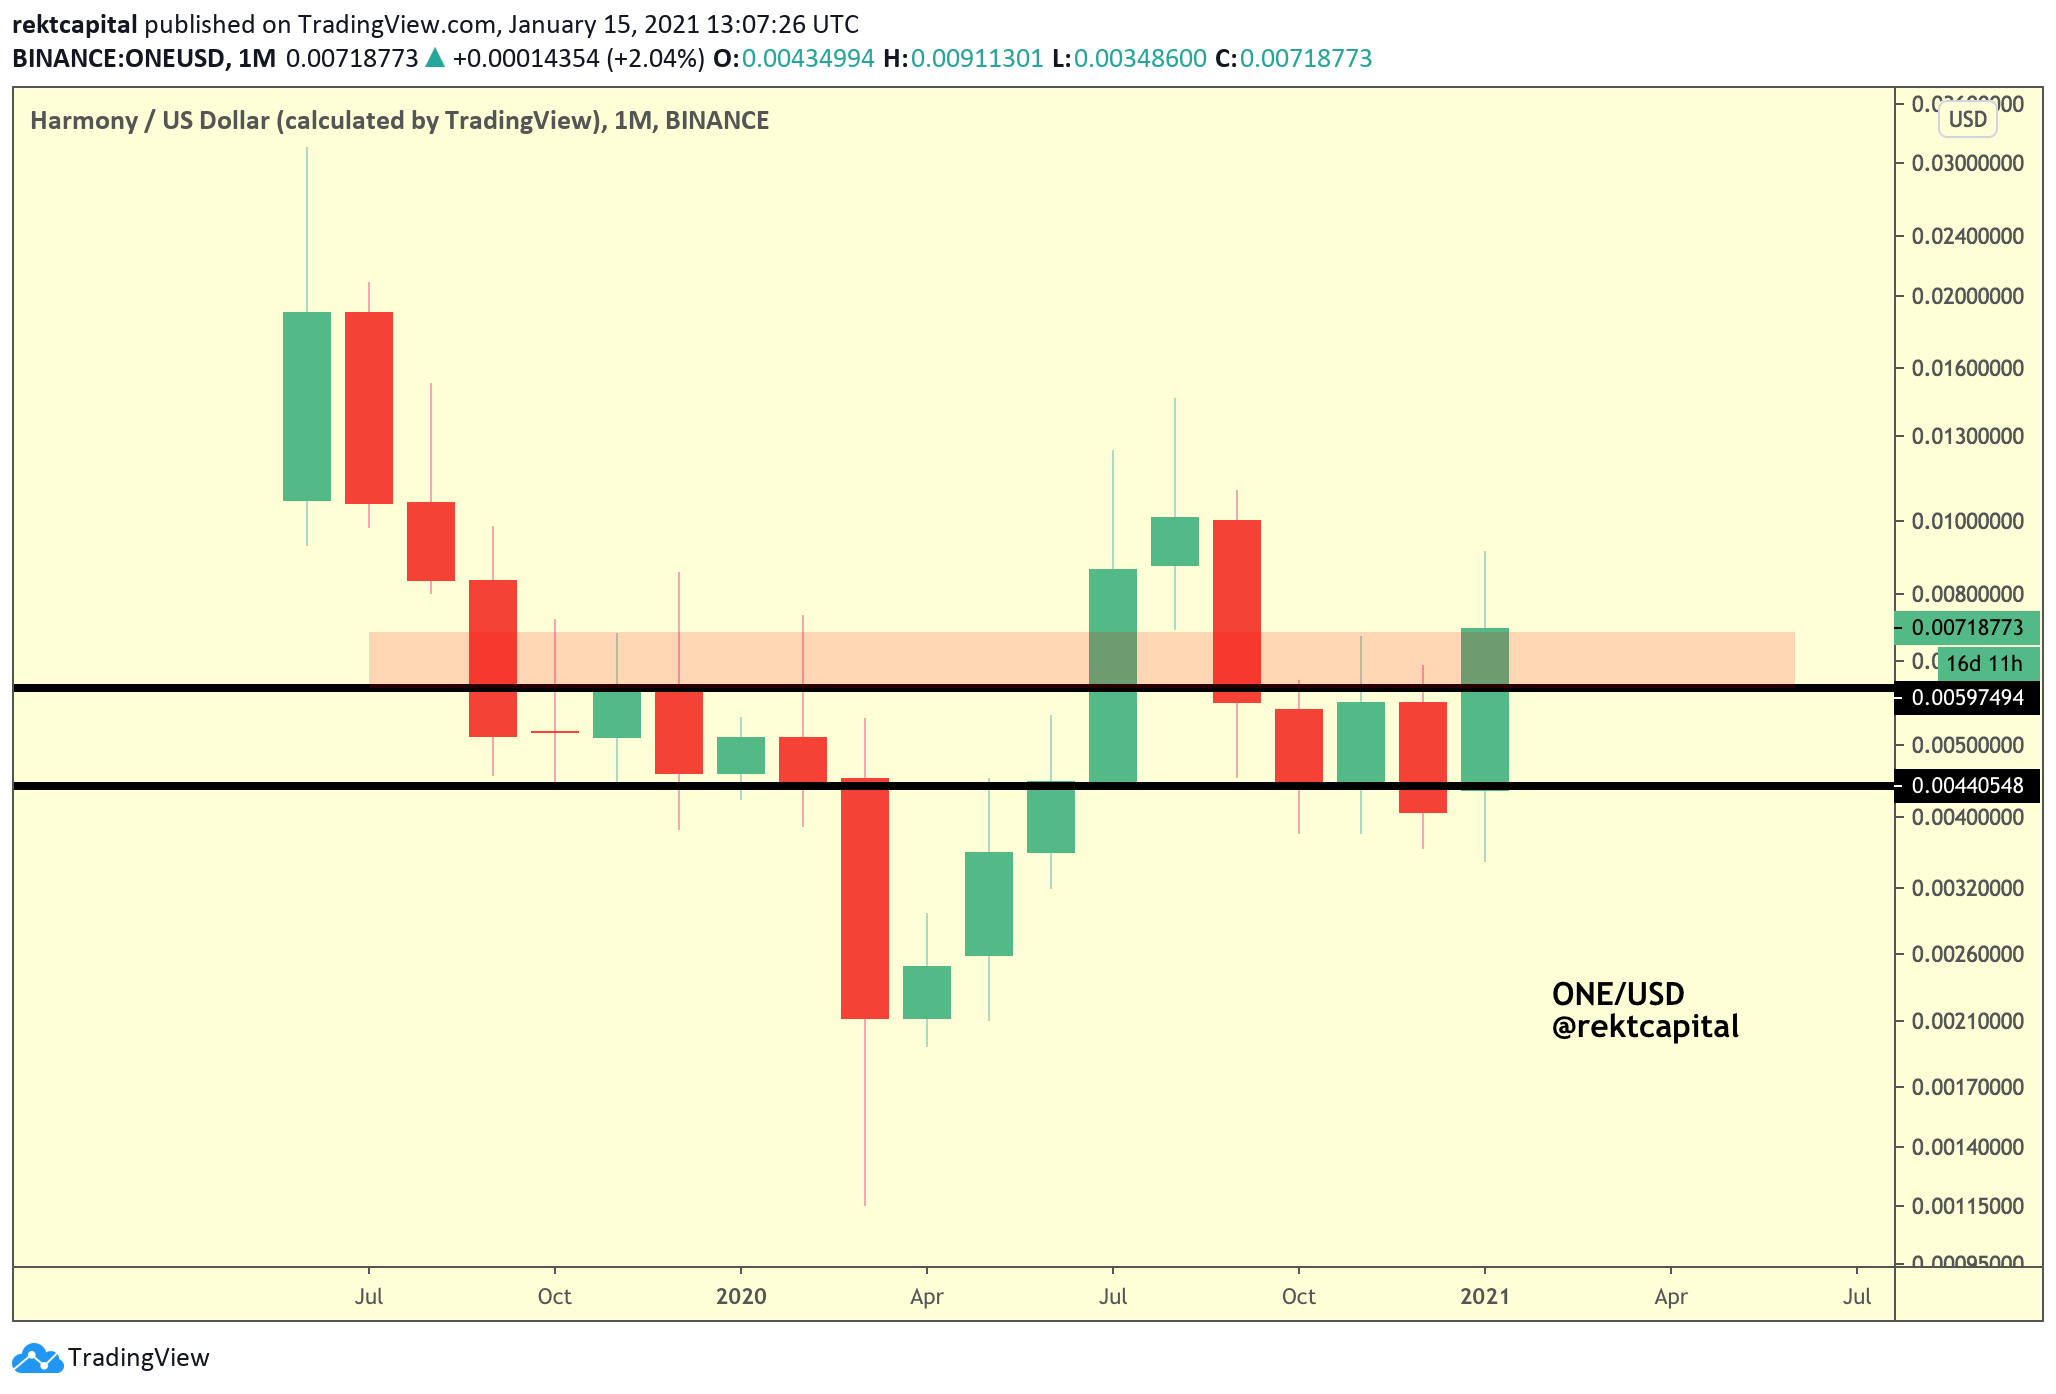
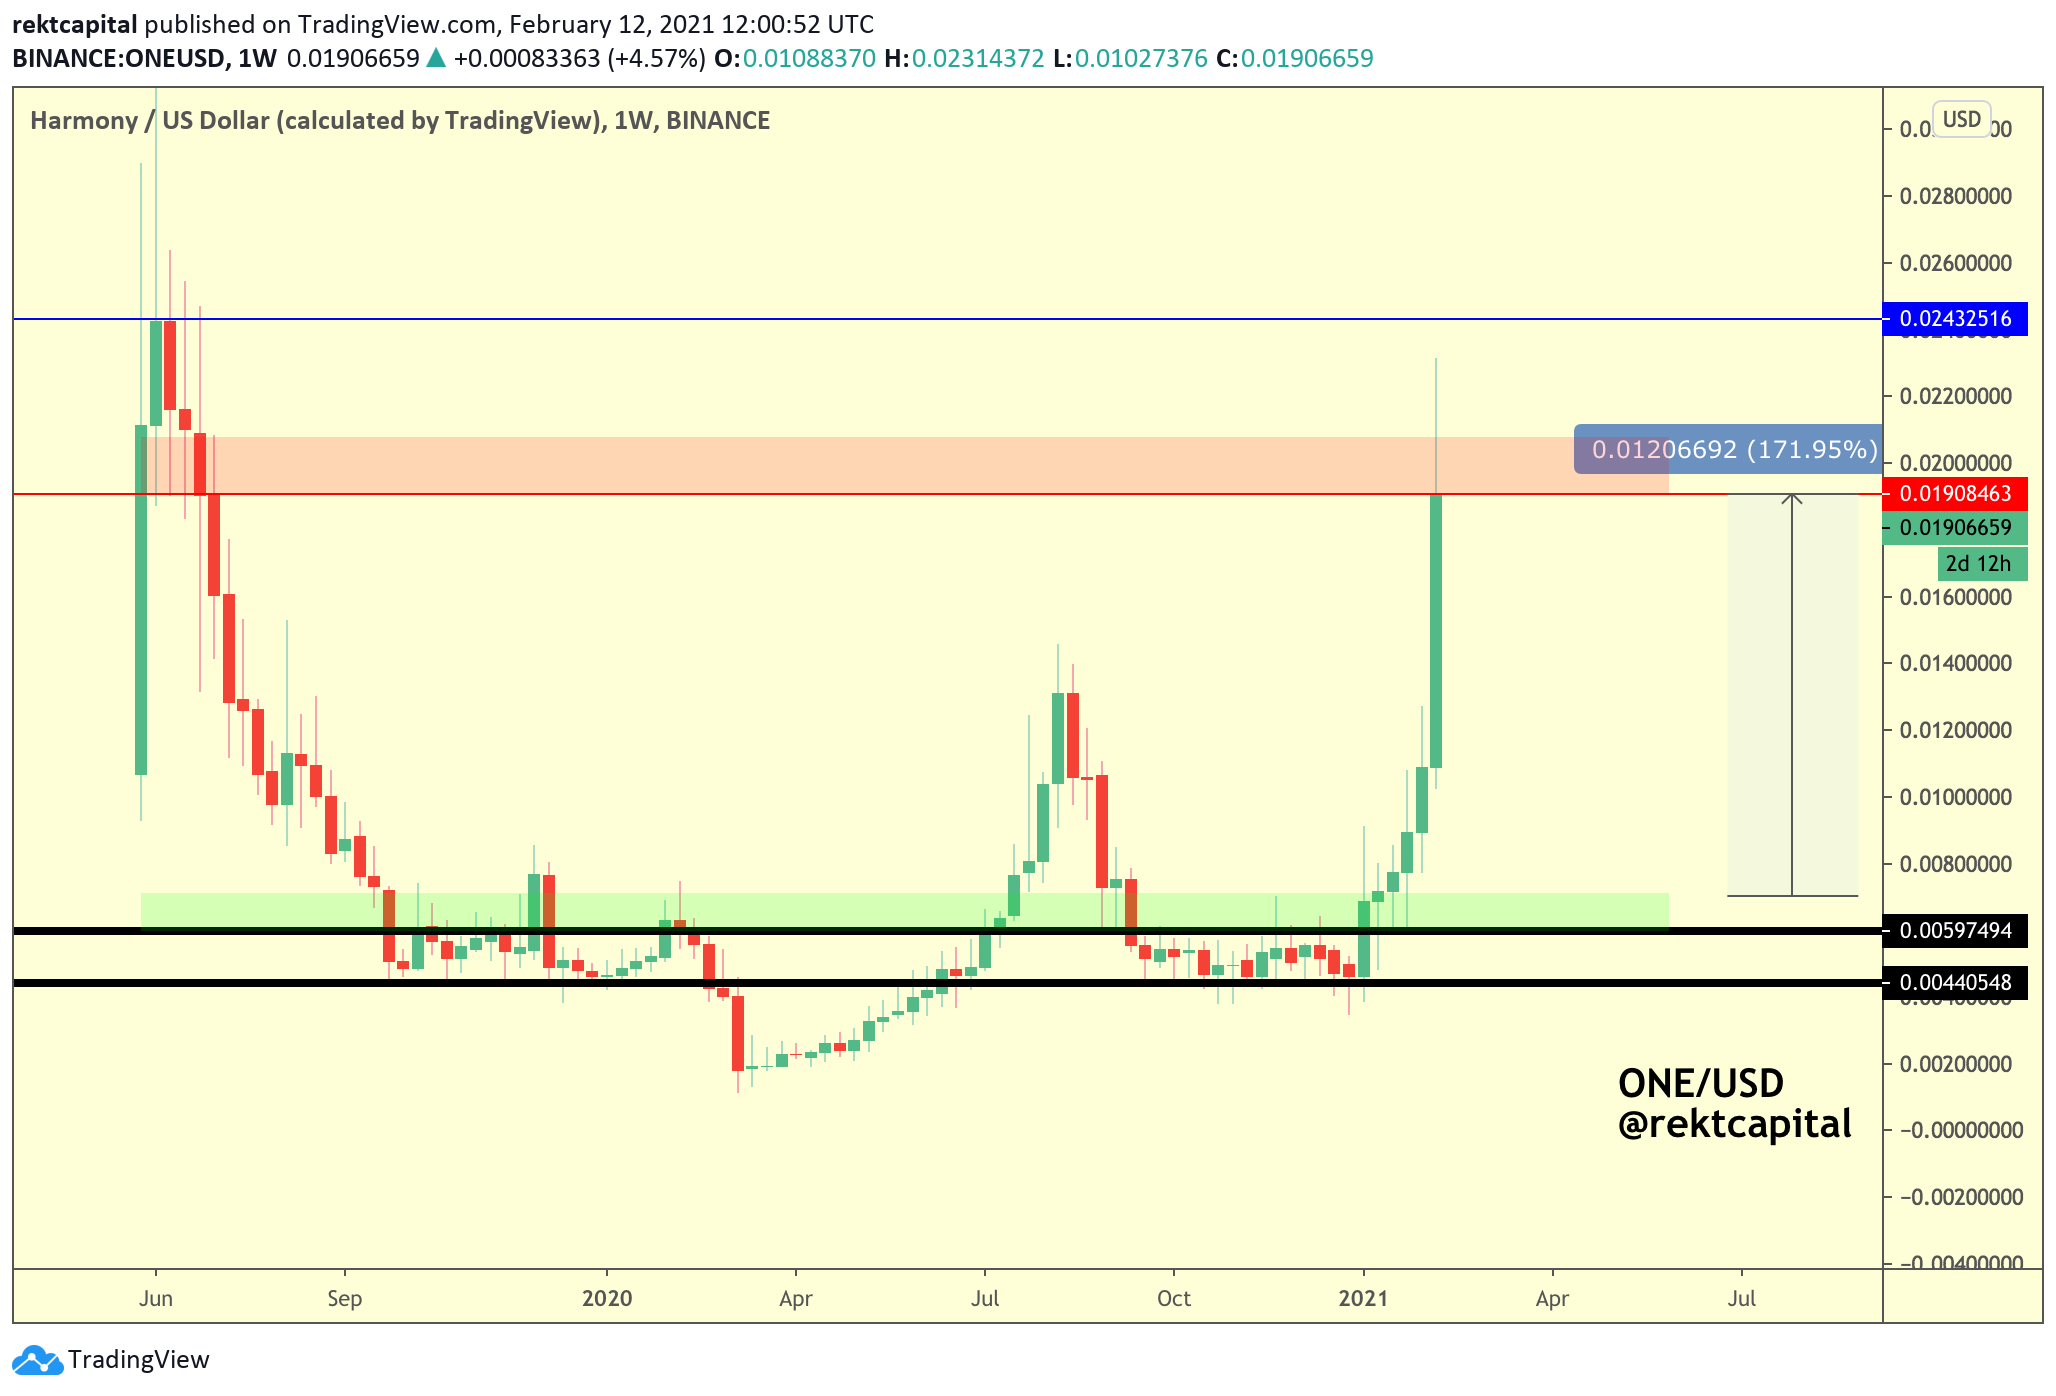
It did just that, turning the previous red area into new green support, rallying +170% since.
Major resistance now. If ONE can turn this local area into support, ONE would continue towards the blue level.
Weekly Close will determine bias so it’s important to have that confirmation before considering an entry. In case of a deeper pullback, I’ll be watching the ~0.013 area.
HBAR/USD - Hedera Hashgraph
HBAR lately broke out from a Weekly Bull Flag to reach a new All Time High:

Now HBAR is in the process of turning this old ATH into new support:
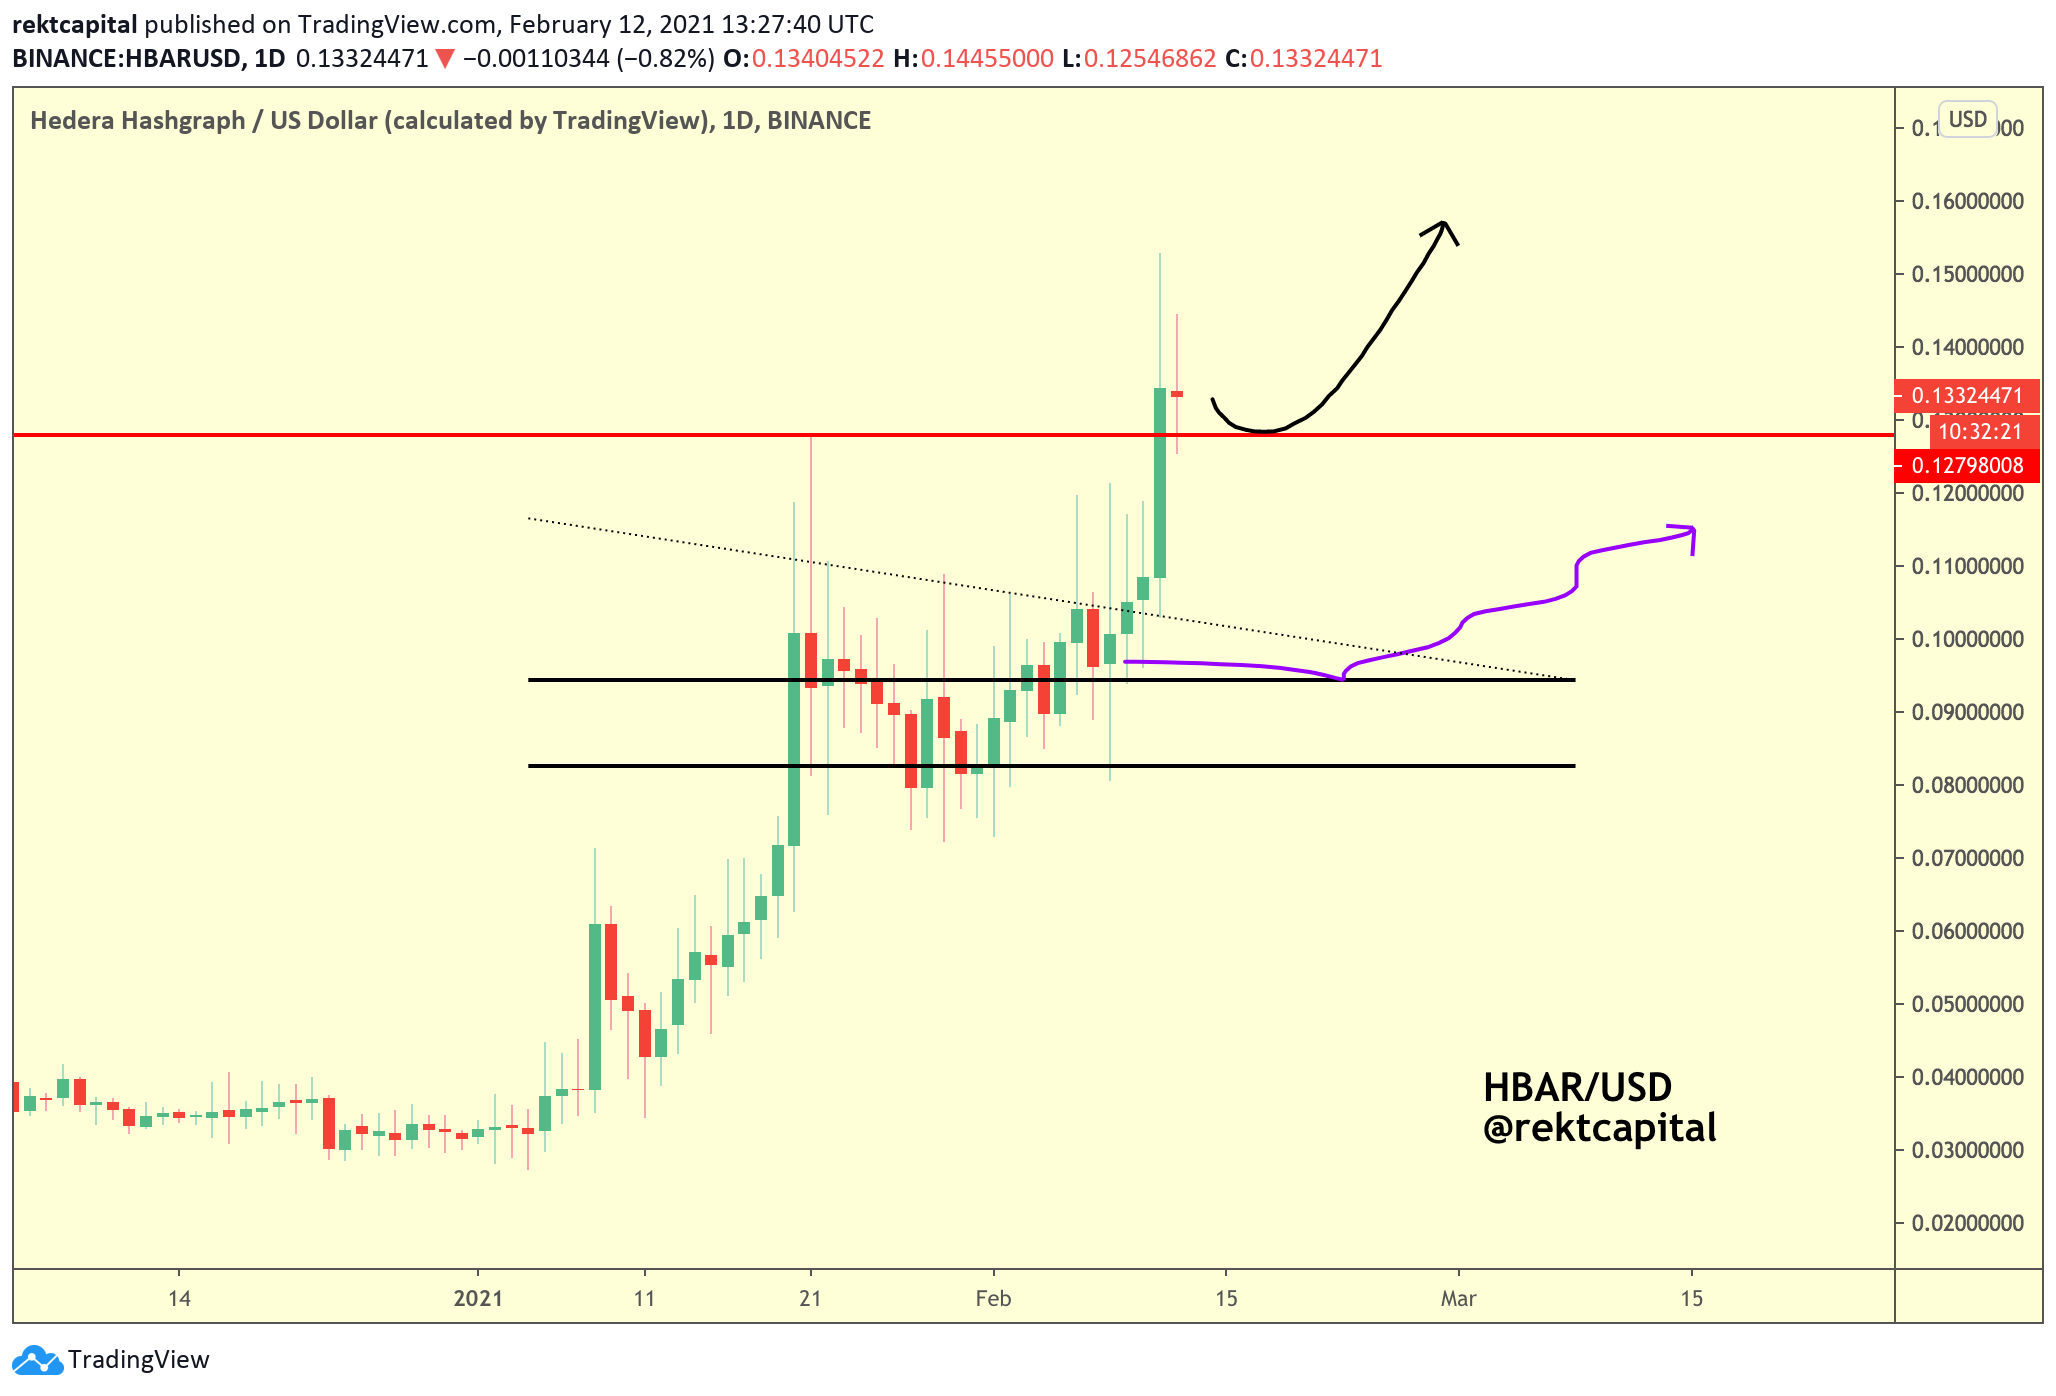
Once successful - Price Discovery awaits.
REN/BTC - REN
Don’t count REN out…
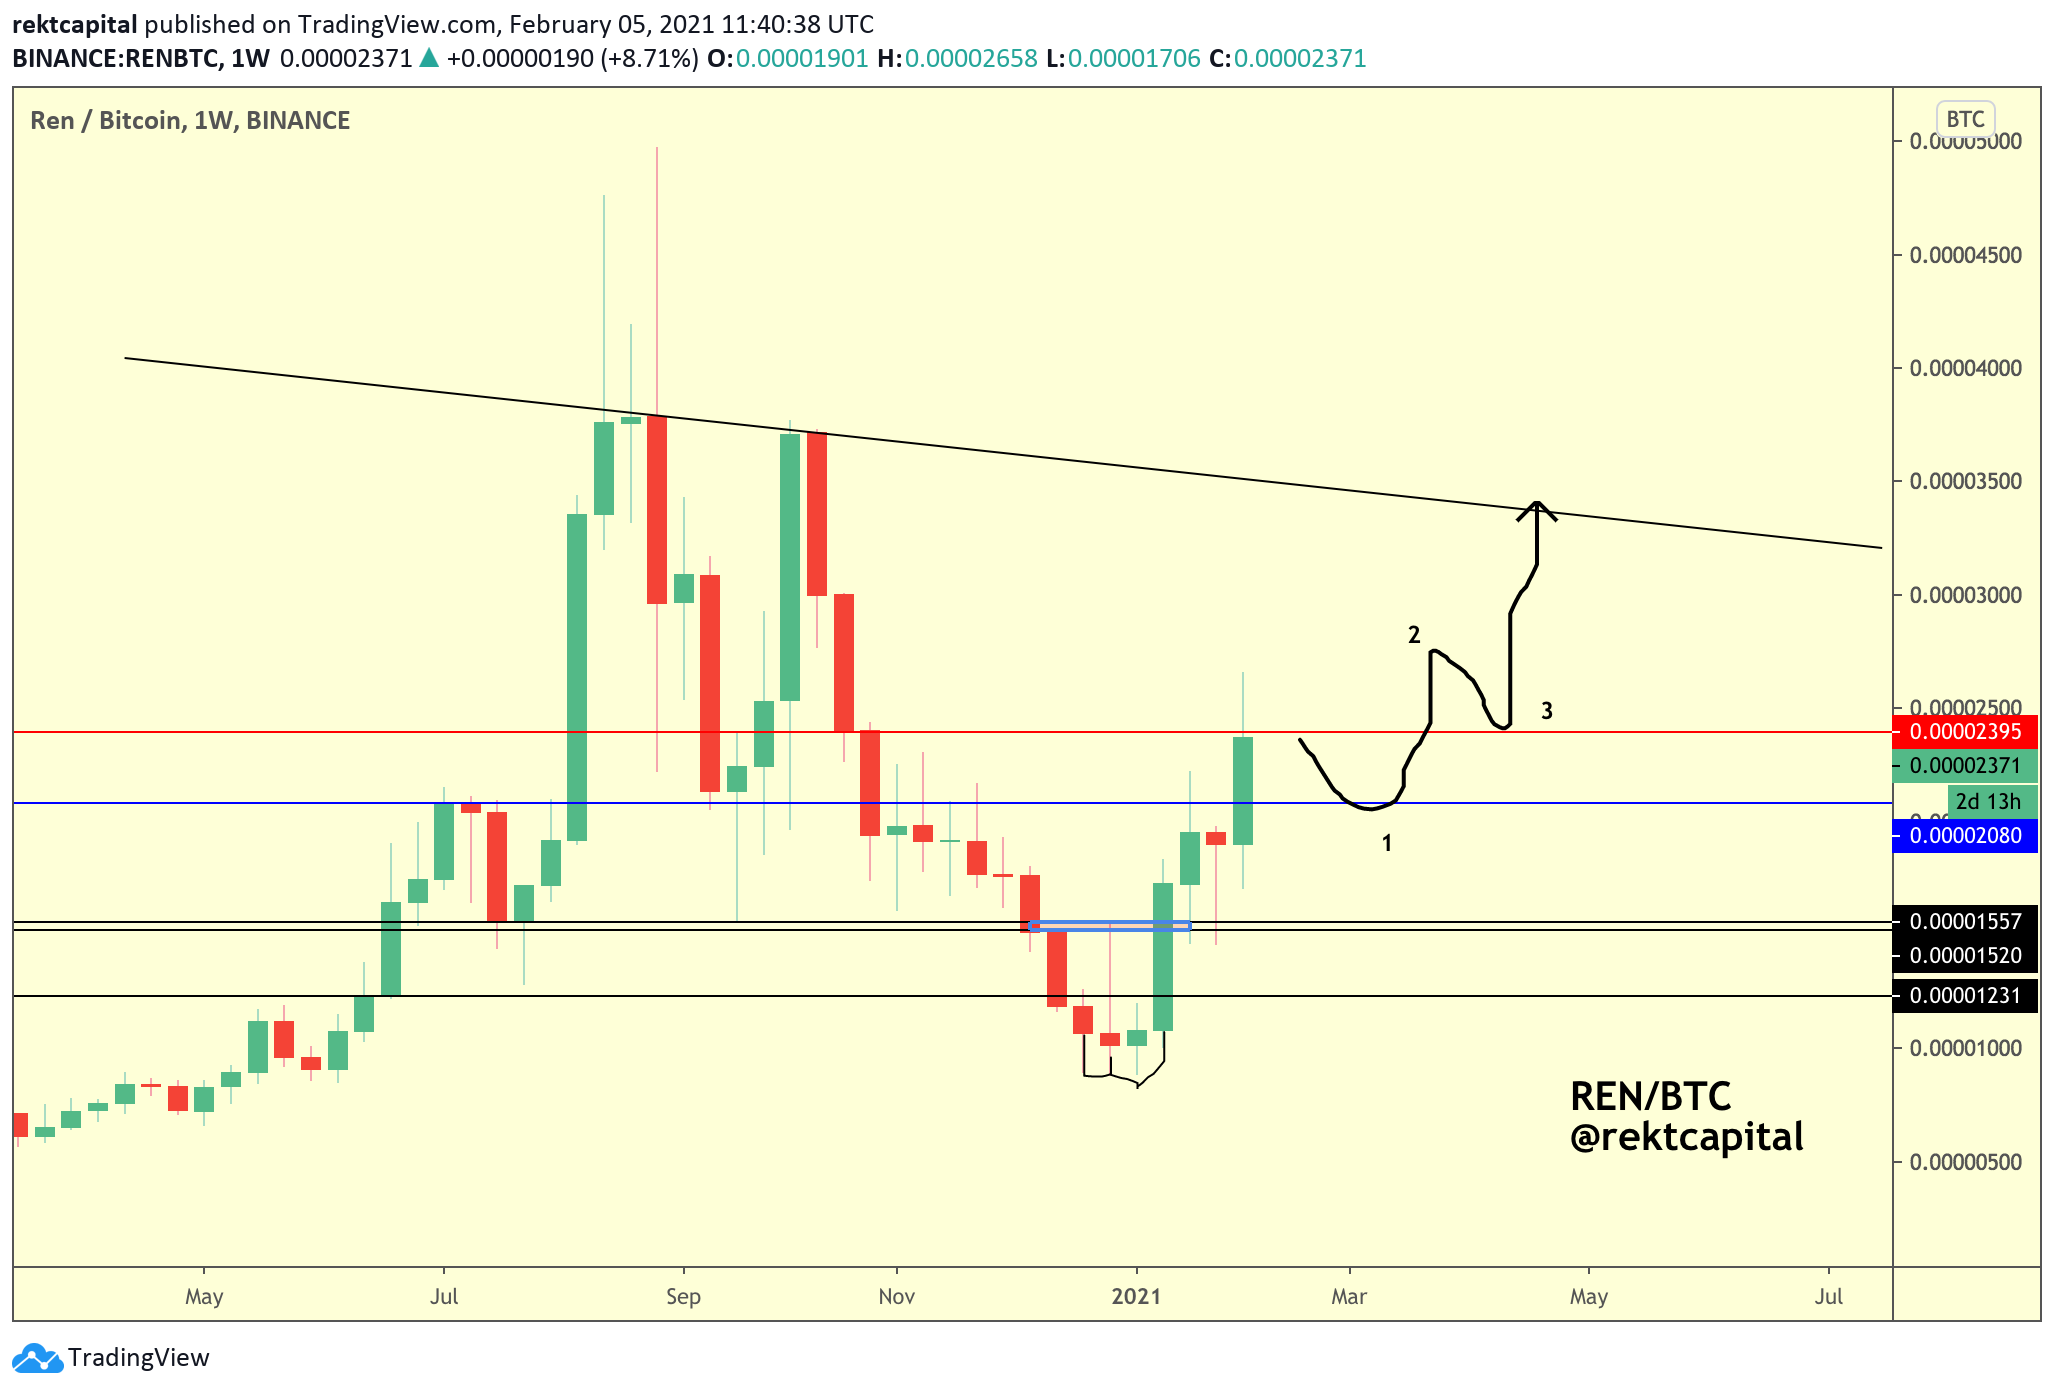
It’s following the black pathway:
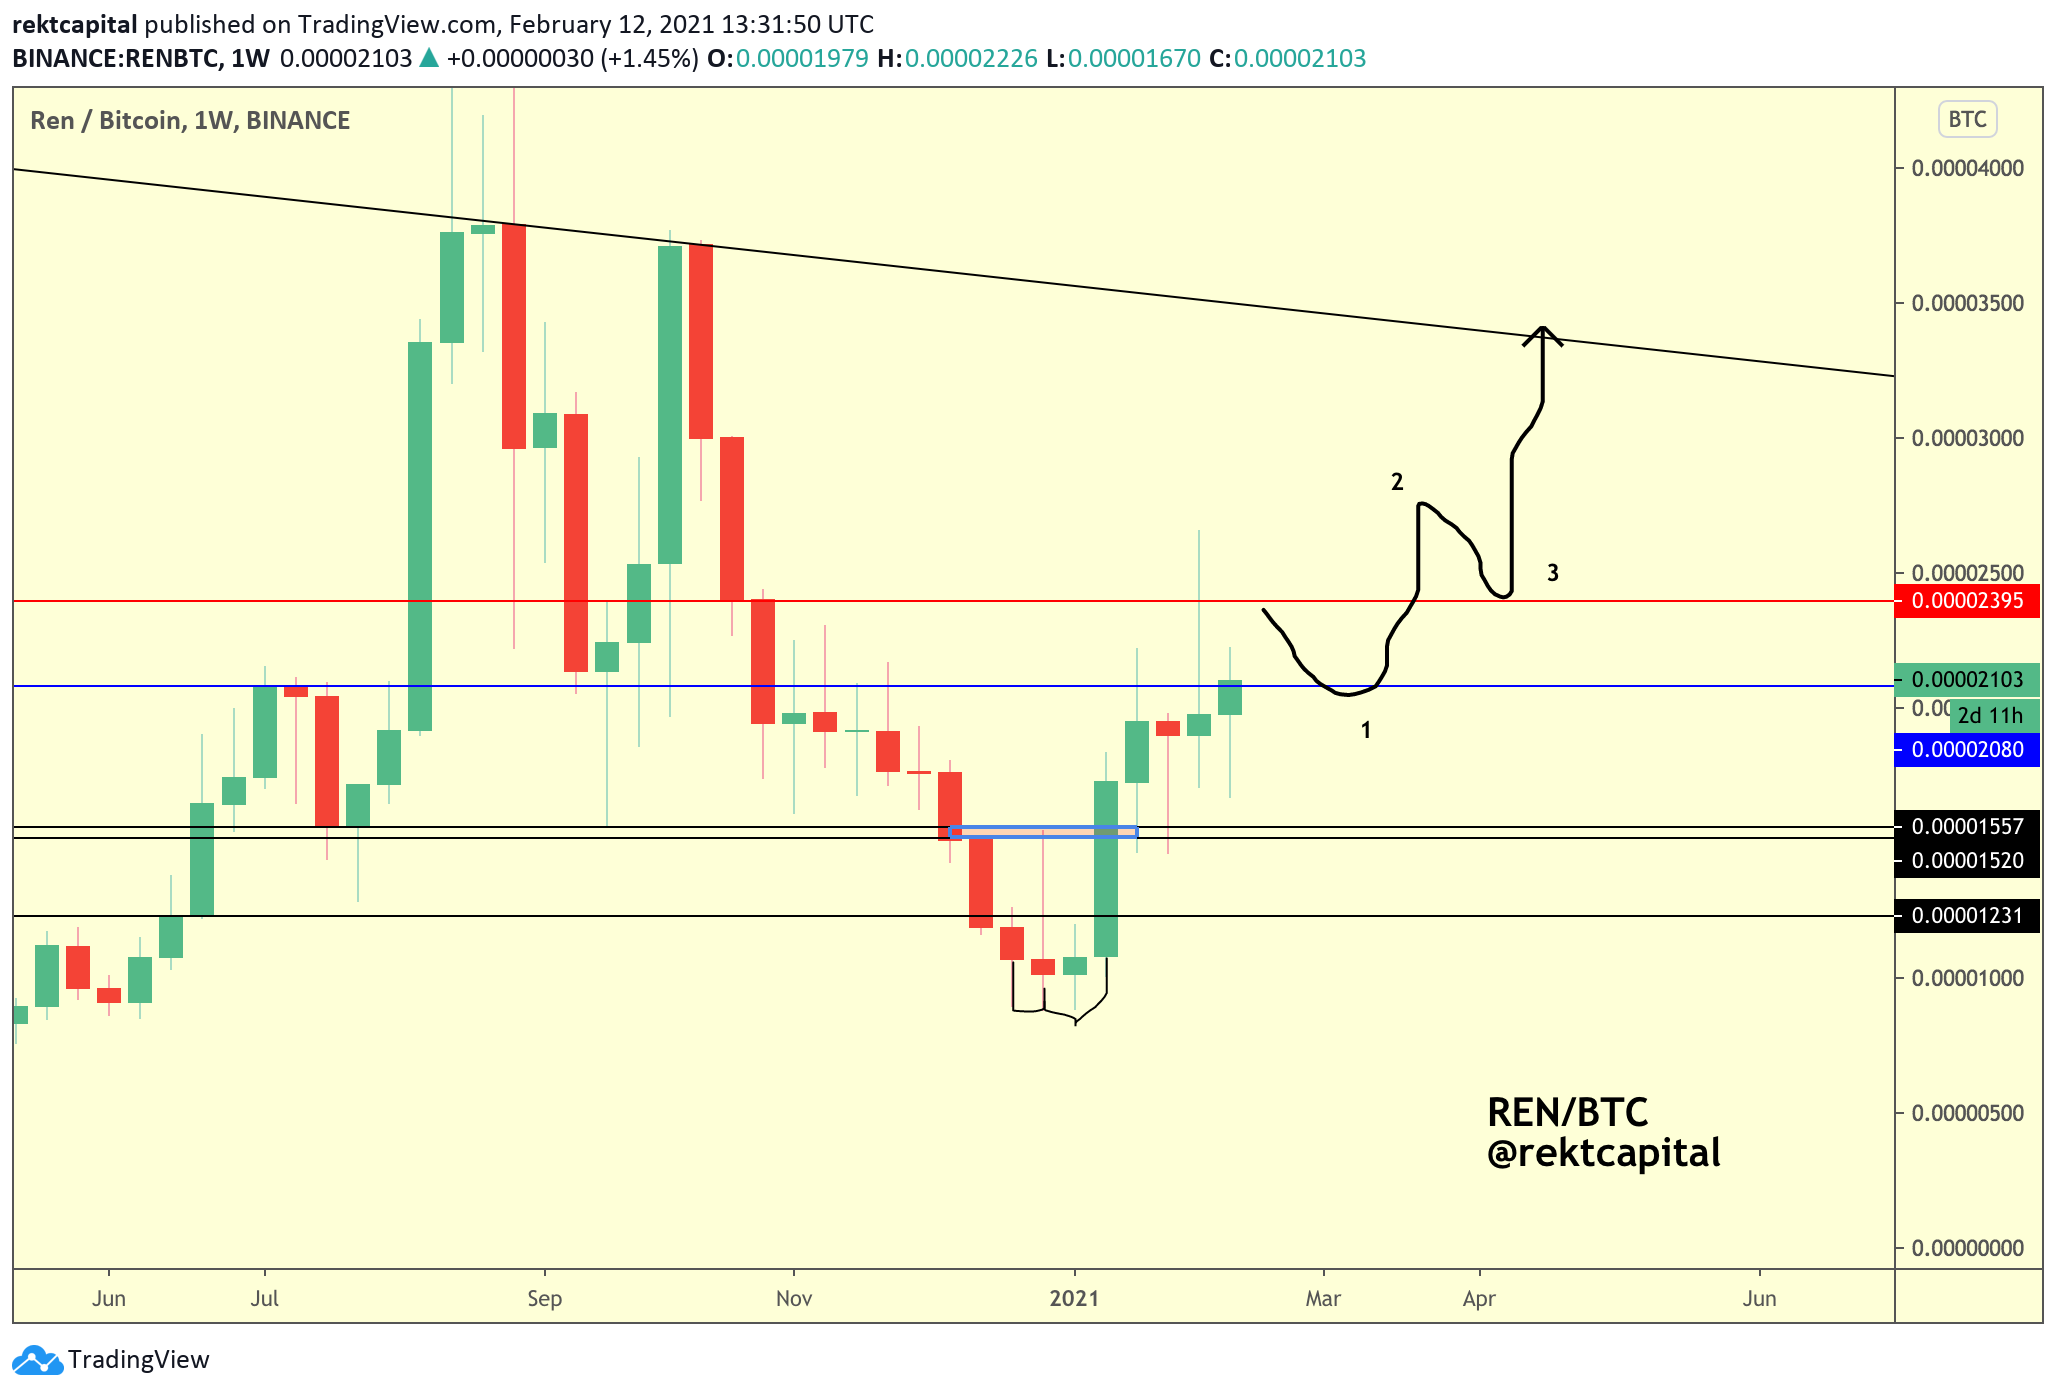
Turn blue into support and Step 1 is complete.
Step 2 would later await.
Thank you for reading today’s free issue of the Rekt Capital newsletter. Let me know your feedback in the comments!
Every Friday, I host an Altcoin TA session just like this one where I share my exclusive commentary on the price action of a wide variety of coins requested by valued supporters of the newsletter.
If you’d like to receive cutting-edge research like this straight to your inbox every Friday - feel free to subscribe for $6.99: