Bitcoin Relief Rally Ending Soon?
A detailed look into some of the key resistances that could derail the recent bullish momentum.
Welcome to the Rekt Capital newsletter, a place for people who want to better navigate the crypto markets with the help of cutting-edge crypto research and unbiased market analysis.
Monthly Timeframe
Earlier this month, we discussed the possibility of a Bitcoin relief rally:
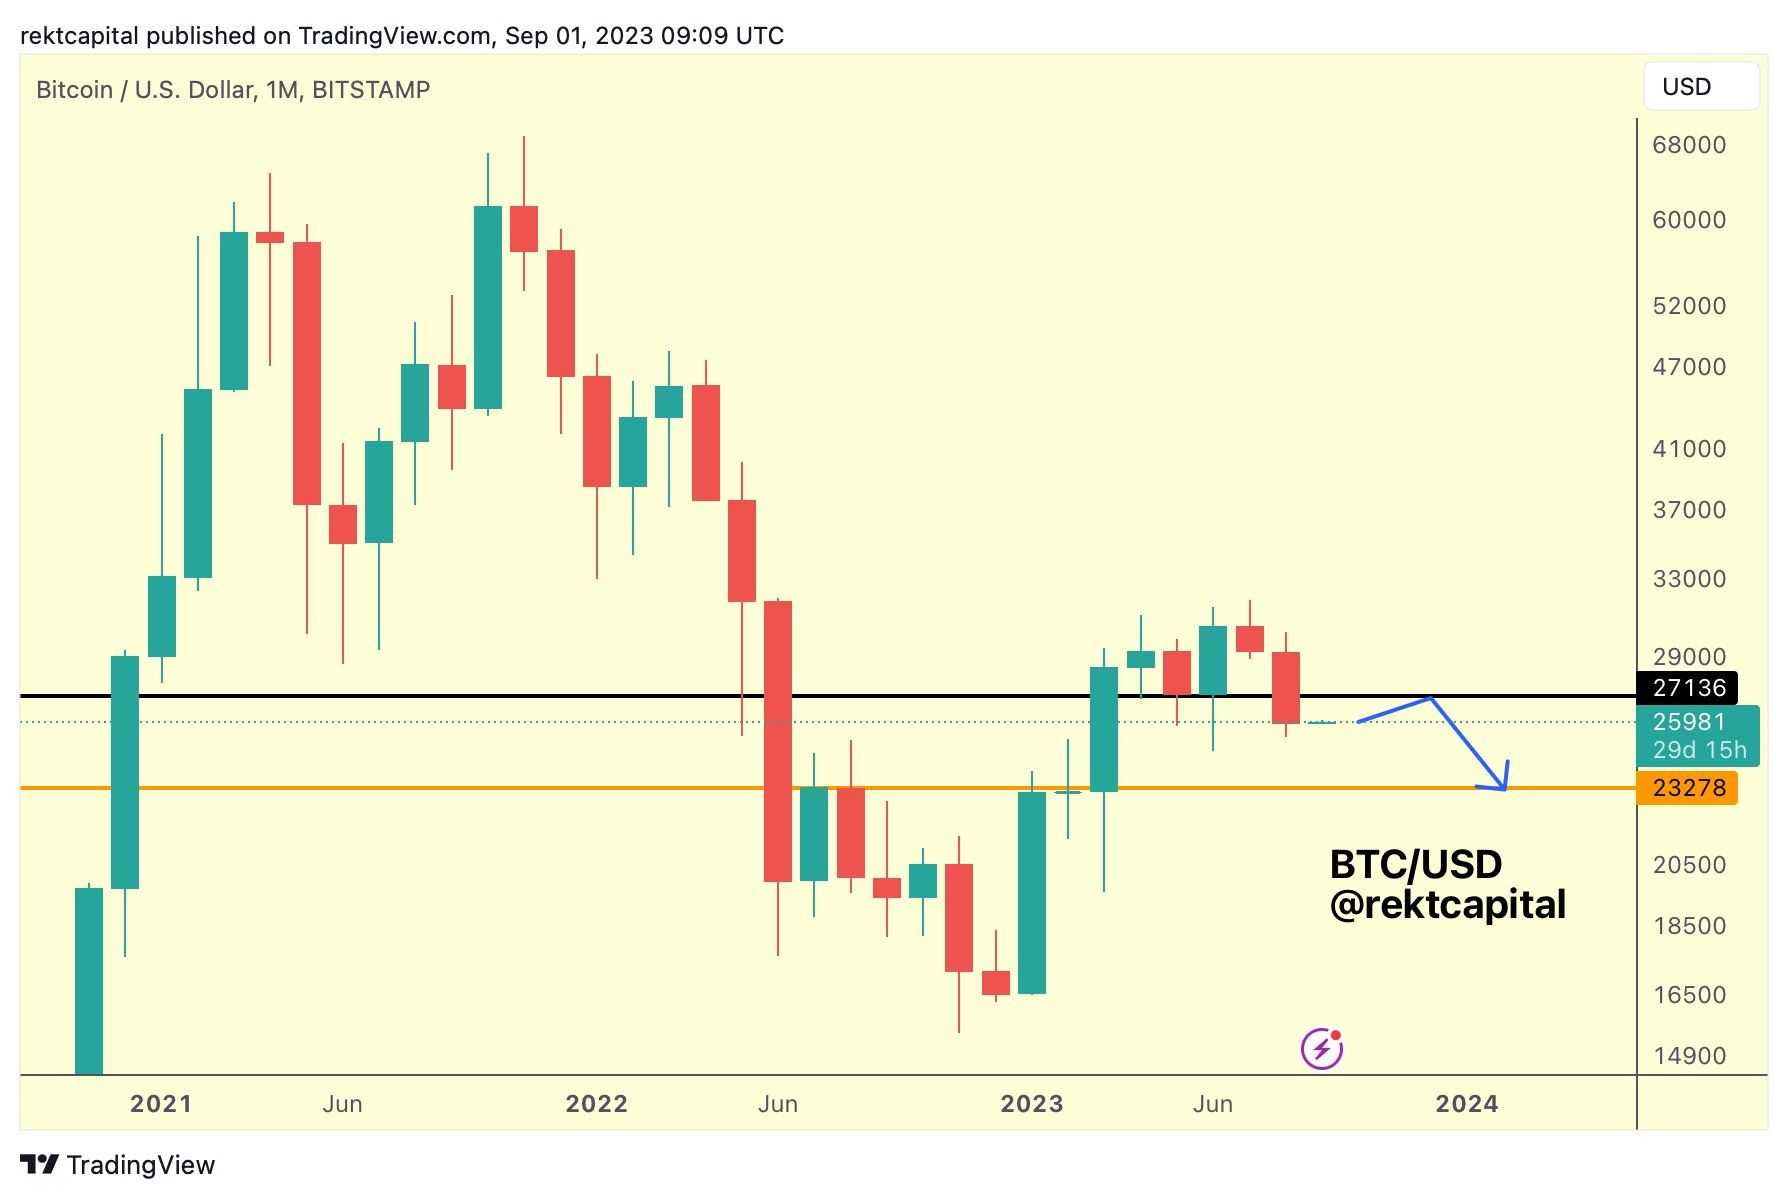
Fast forward to today and here we are:
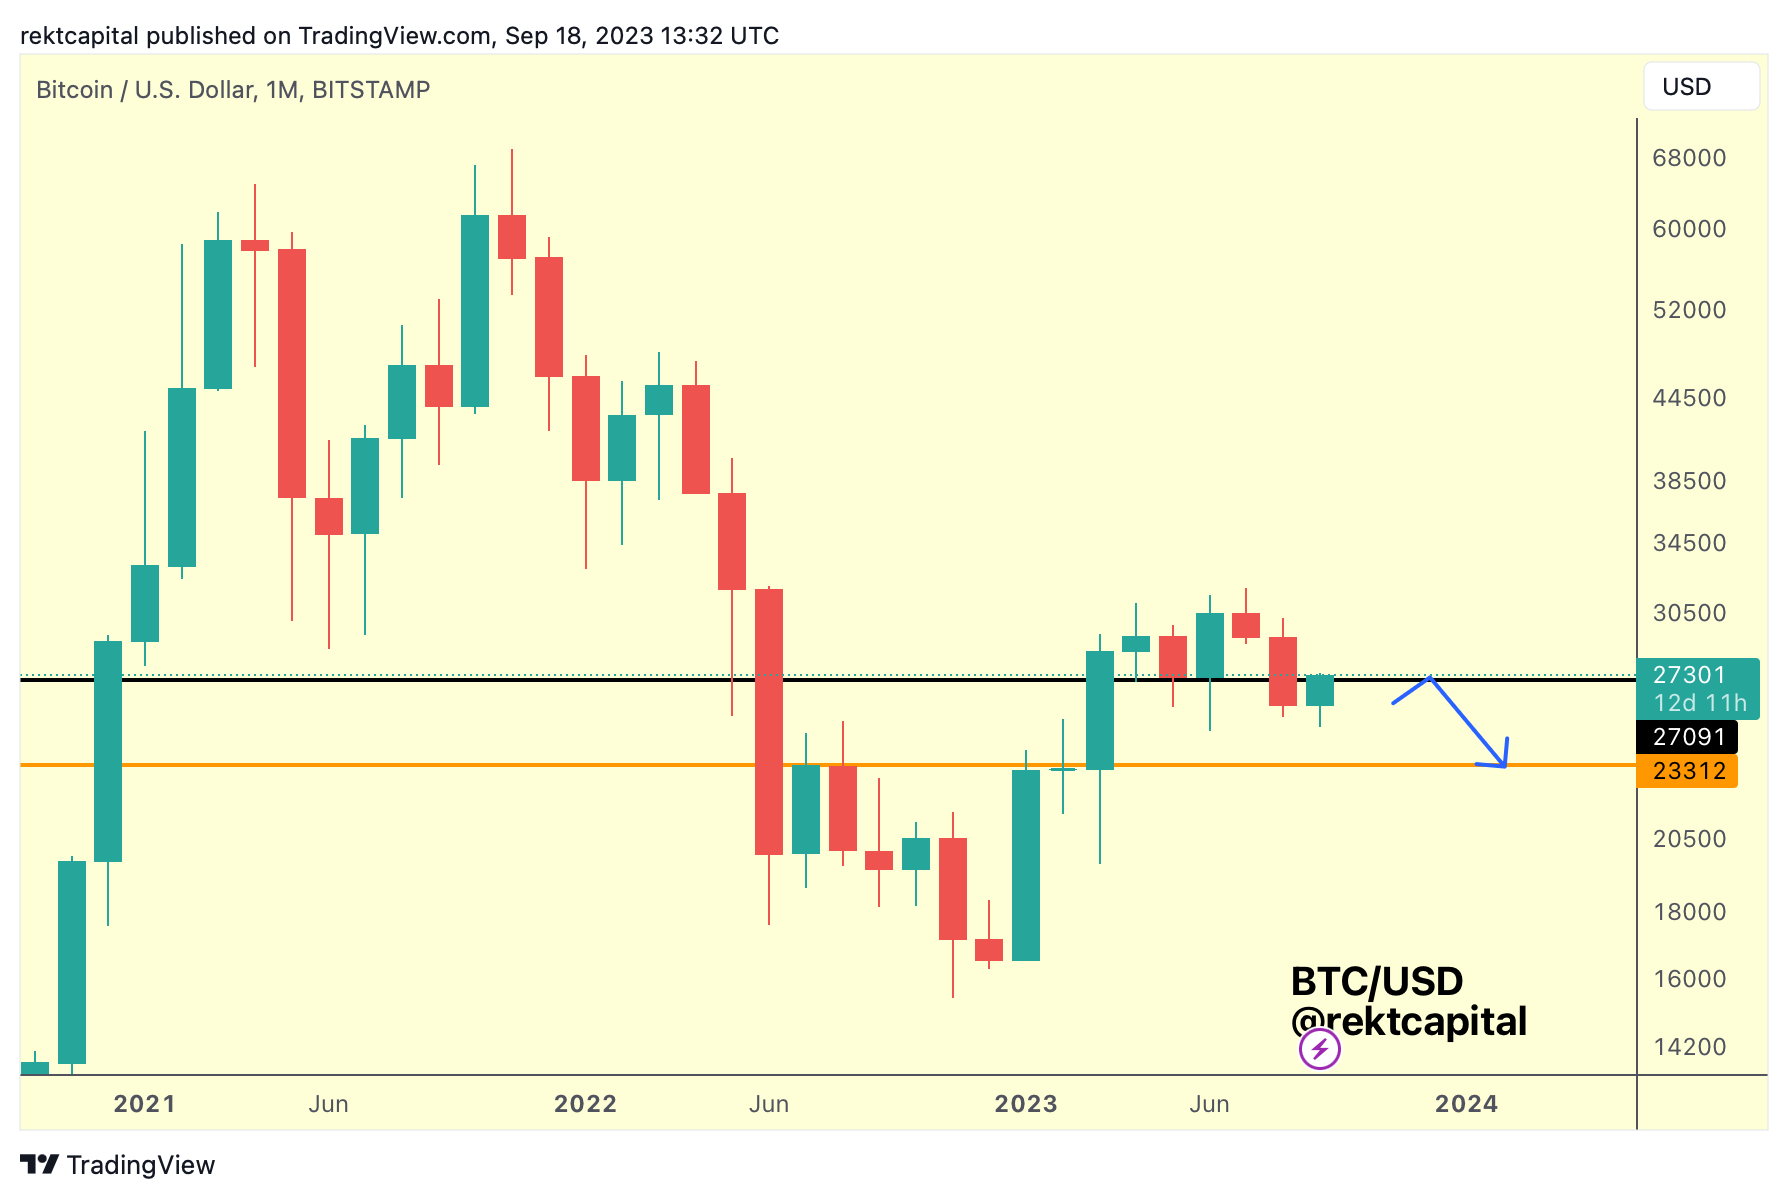
Bitcoin has indeed rallied back into ~$27150, which acted as support for three consecutive months earlier this year but lost support this past August.
As is the case with lost supports, there is always the chance of potentially flipping into new resistance and that was the premise of the September 1st tweet.
At this juncture, it's important to watch out for how price could react to this level.
Oftentimes, when lost supports are turned into new resistances - the process is a very emotional one and here's why:
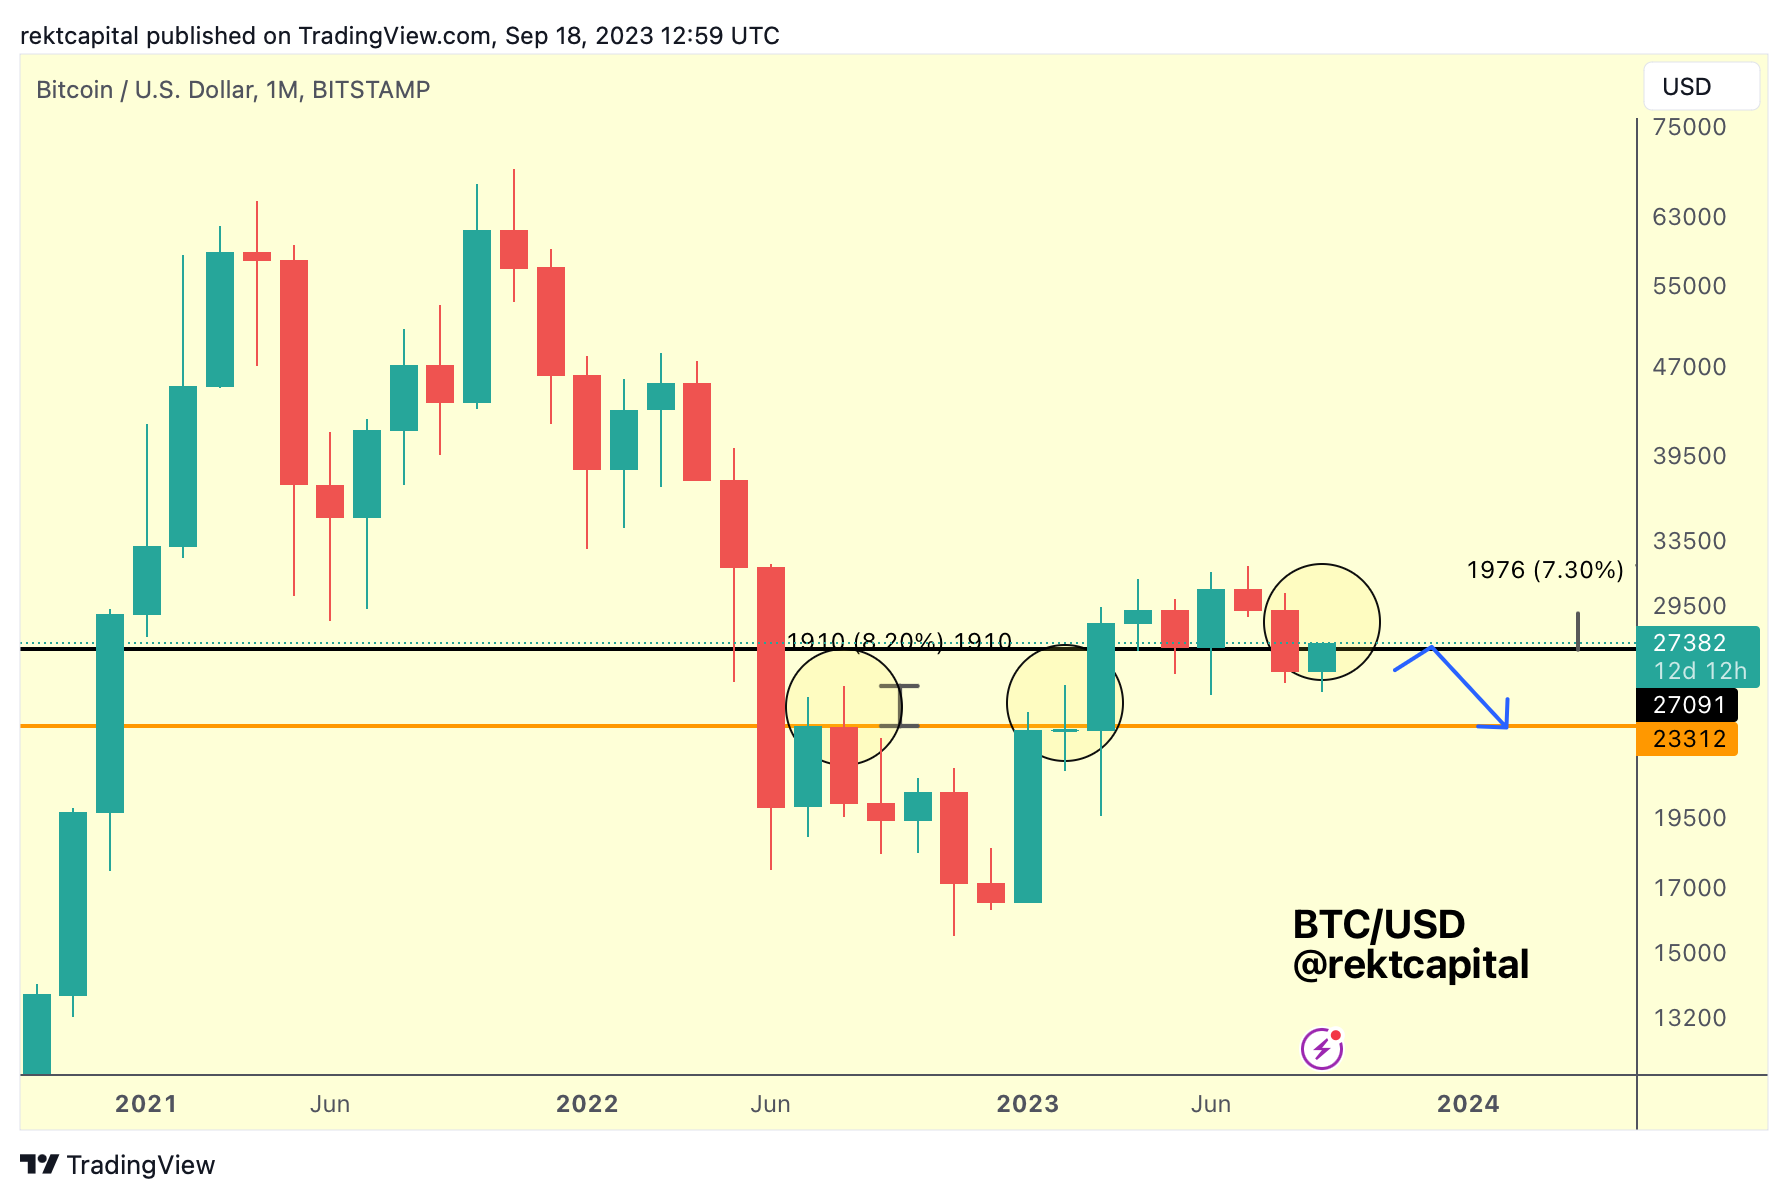
Because price tends to overextend beyond an old lost support, often faking-out traders and investors who are likely to FOMO into a position.
These upside wicks can be quite long; over the past year or so, such deviations have been up to +8% long.
An upside wick of around +7% would see price deviate to the ~$29000 area.
So what could an +8% upside wick look like?
Let's take a look at this through the lens of the potential Bearish Bitcoin Fractal:
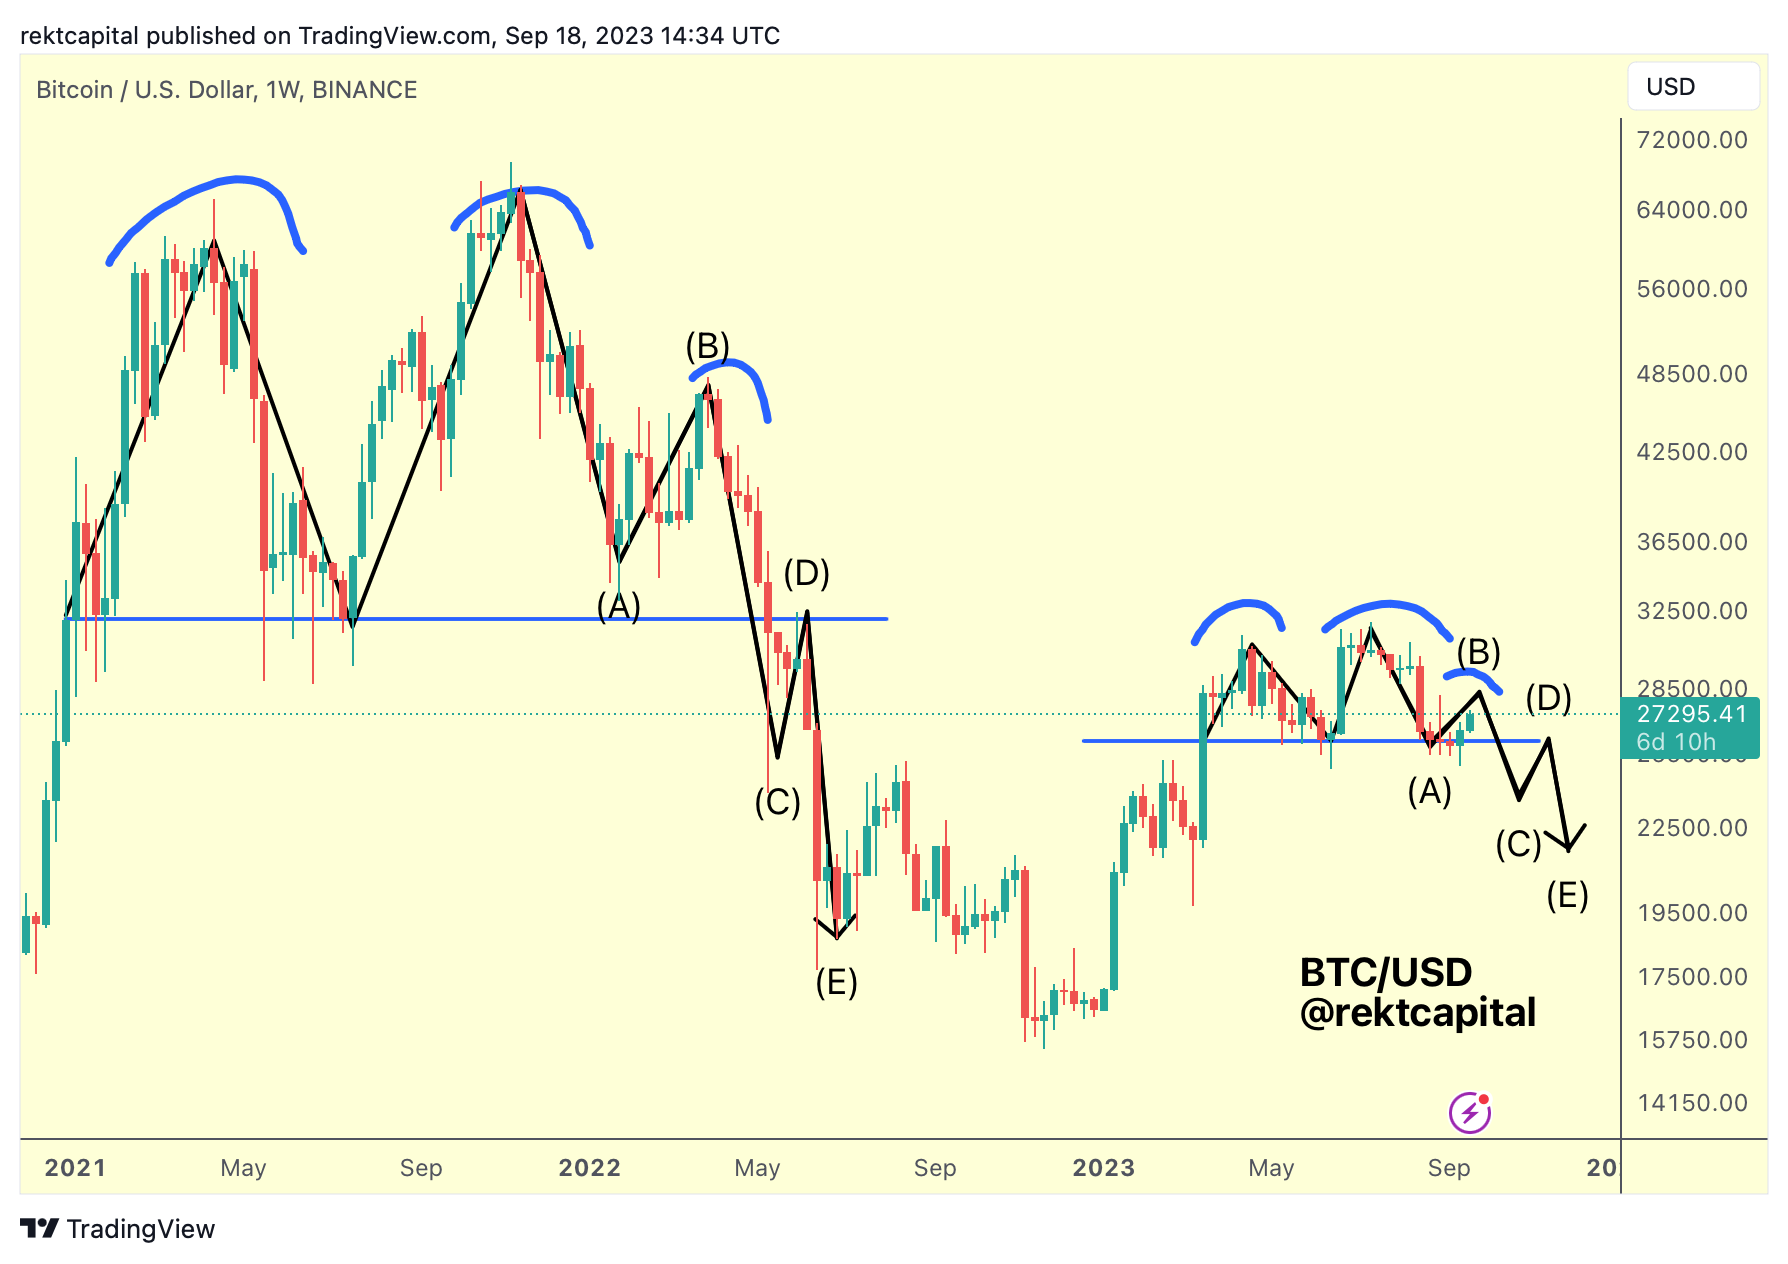
It's now clear that BTC may be experiencing its A-B phase of the fractal and here is how it ties into the upside wicking scenario:
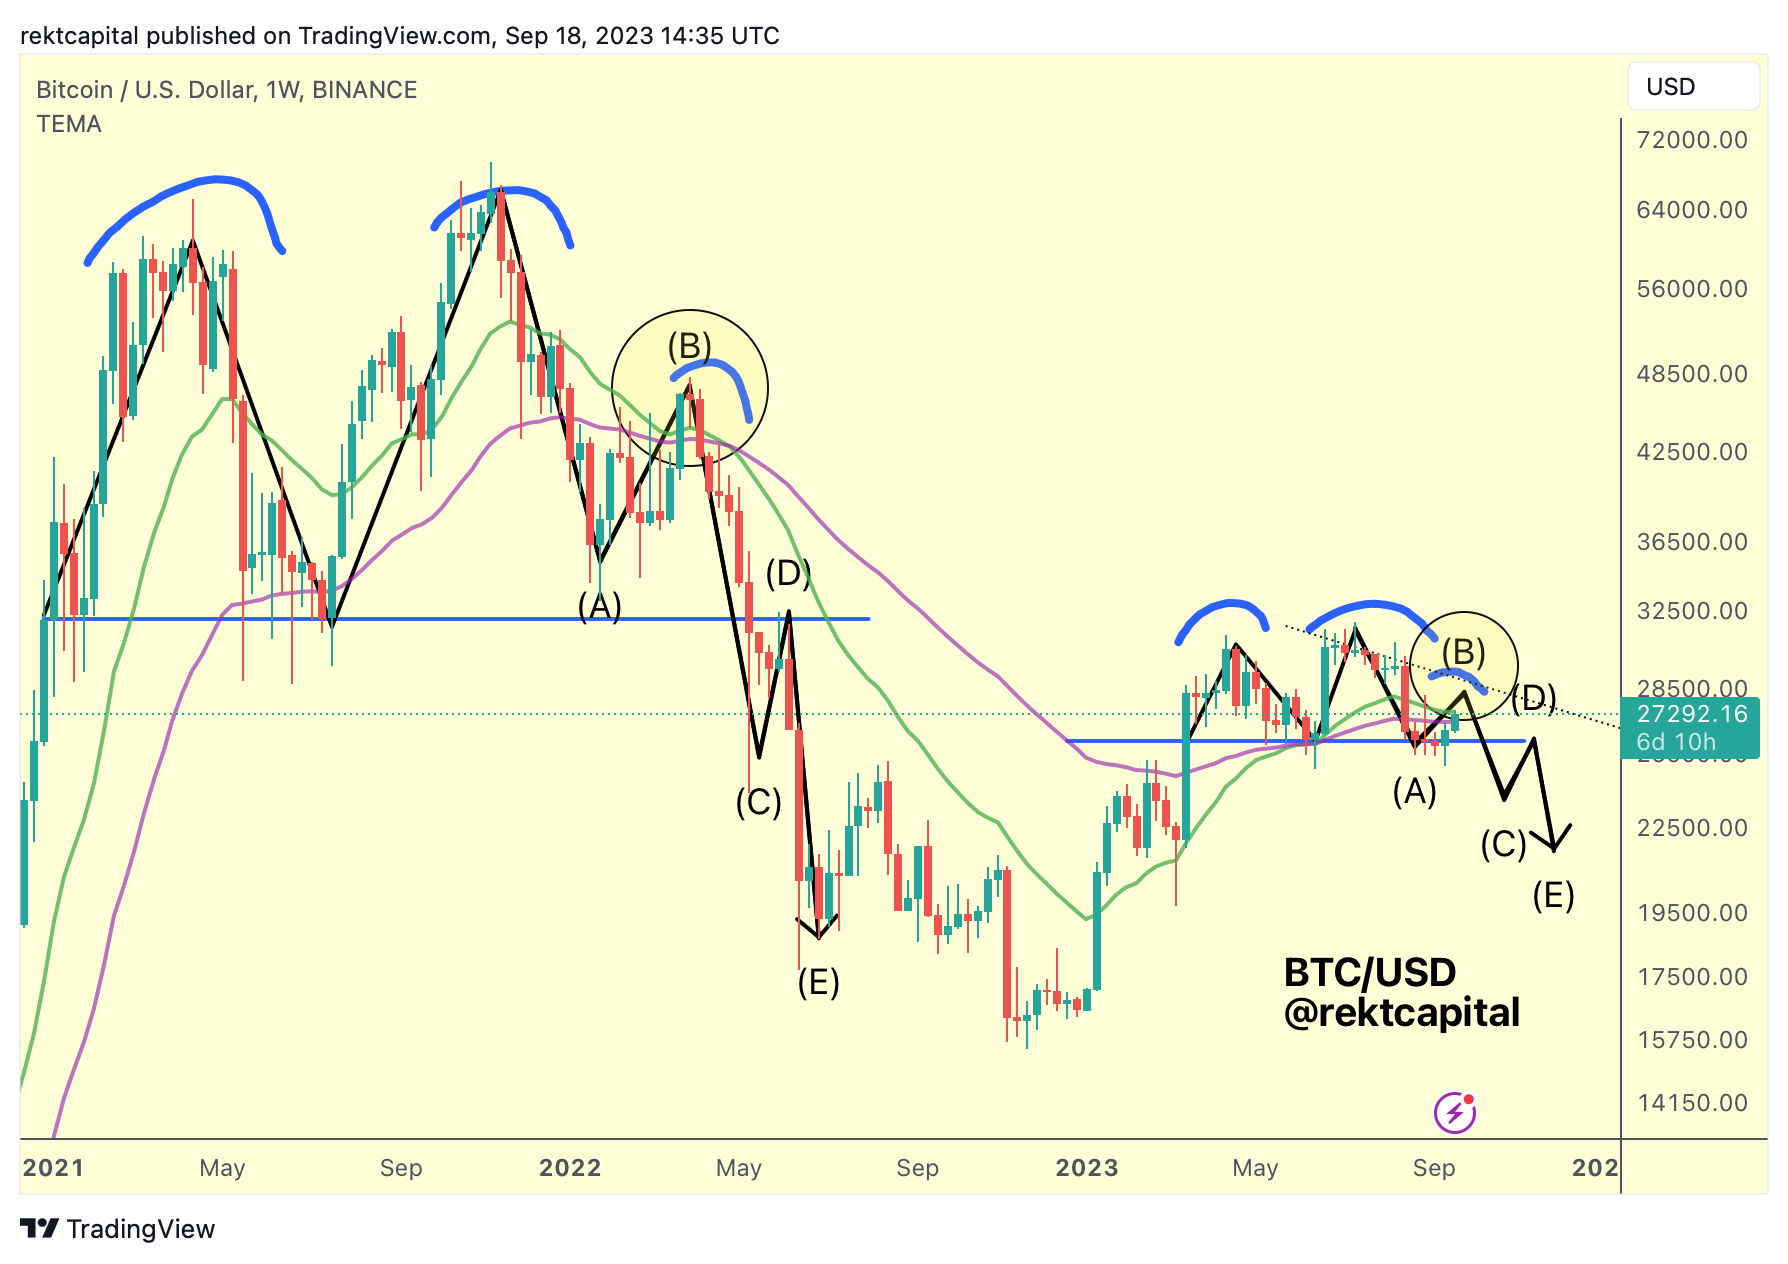
Firstly, Bitcoin is trying to press beyond the Bull Market Support Band (blue 50-week EMA and green 21-week EMA).
In 2021, price overextended beyond these moving averages before ultimately failing to retest them as support, before breaking below them again to continue downside continuation (yellow circle).
An overextension like this in this 2023 cycle could of course occur, but there is also a Lower High resistance waiting not too far ahead.
The Lower High resistance is located around the ~$29,000 region:
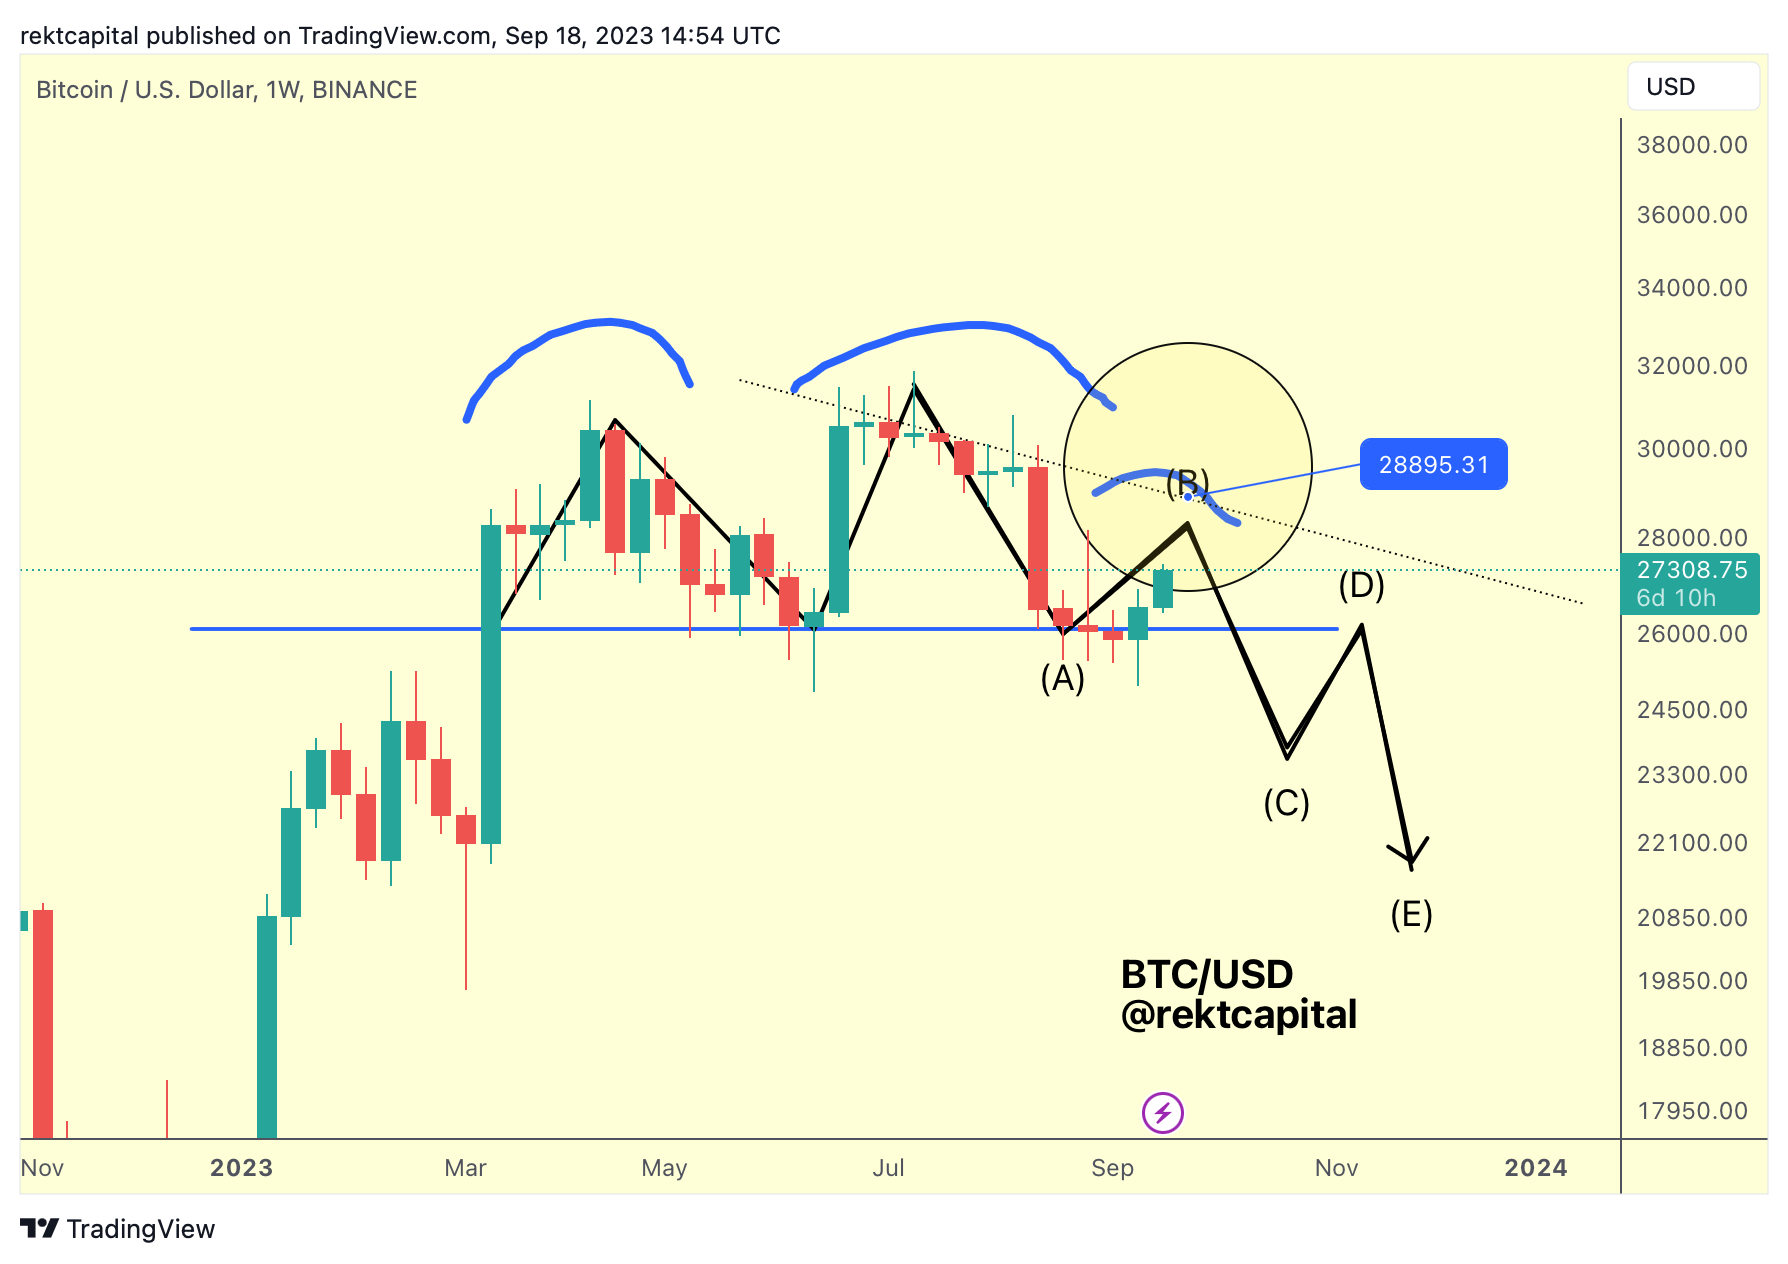
So an upside wick beyond the Monthly ~$27150 level could indeed find confluence with a revisit of the Lower High resistance.
Of course, the upside wick could be much shorter and in fact - price could altogether just Monthly Close above ~$27150 to reclaim this level as support once again.
However history is showcasing an interesting situation where the Bearish Bitcoin Fractal is one we've seen a few times before:
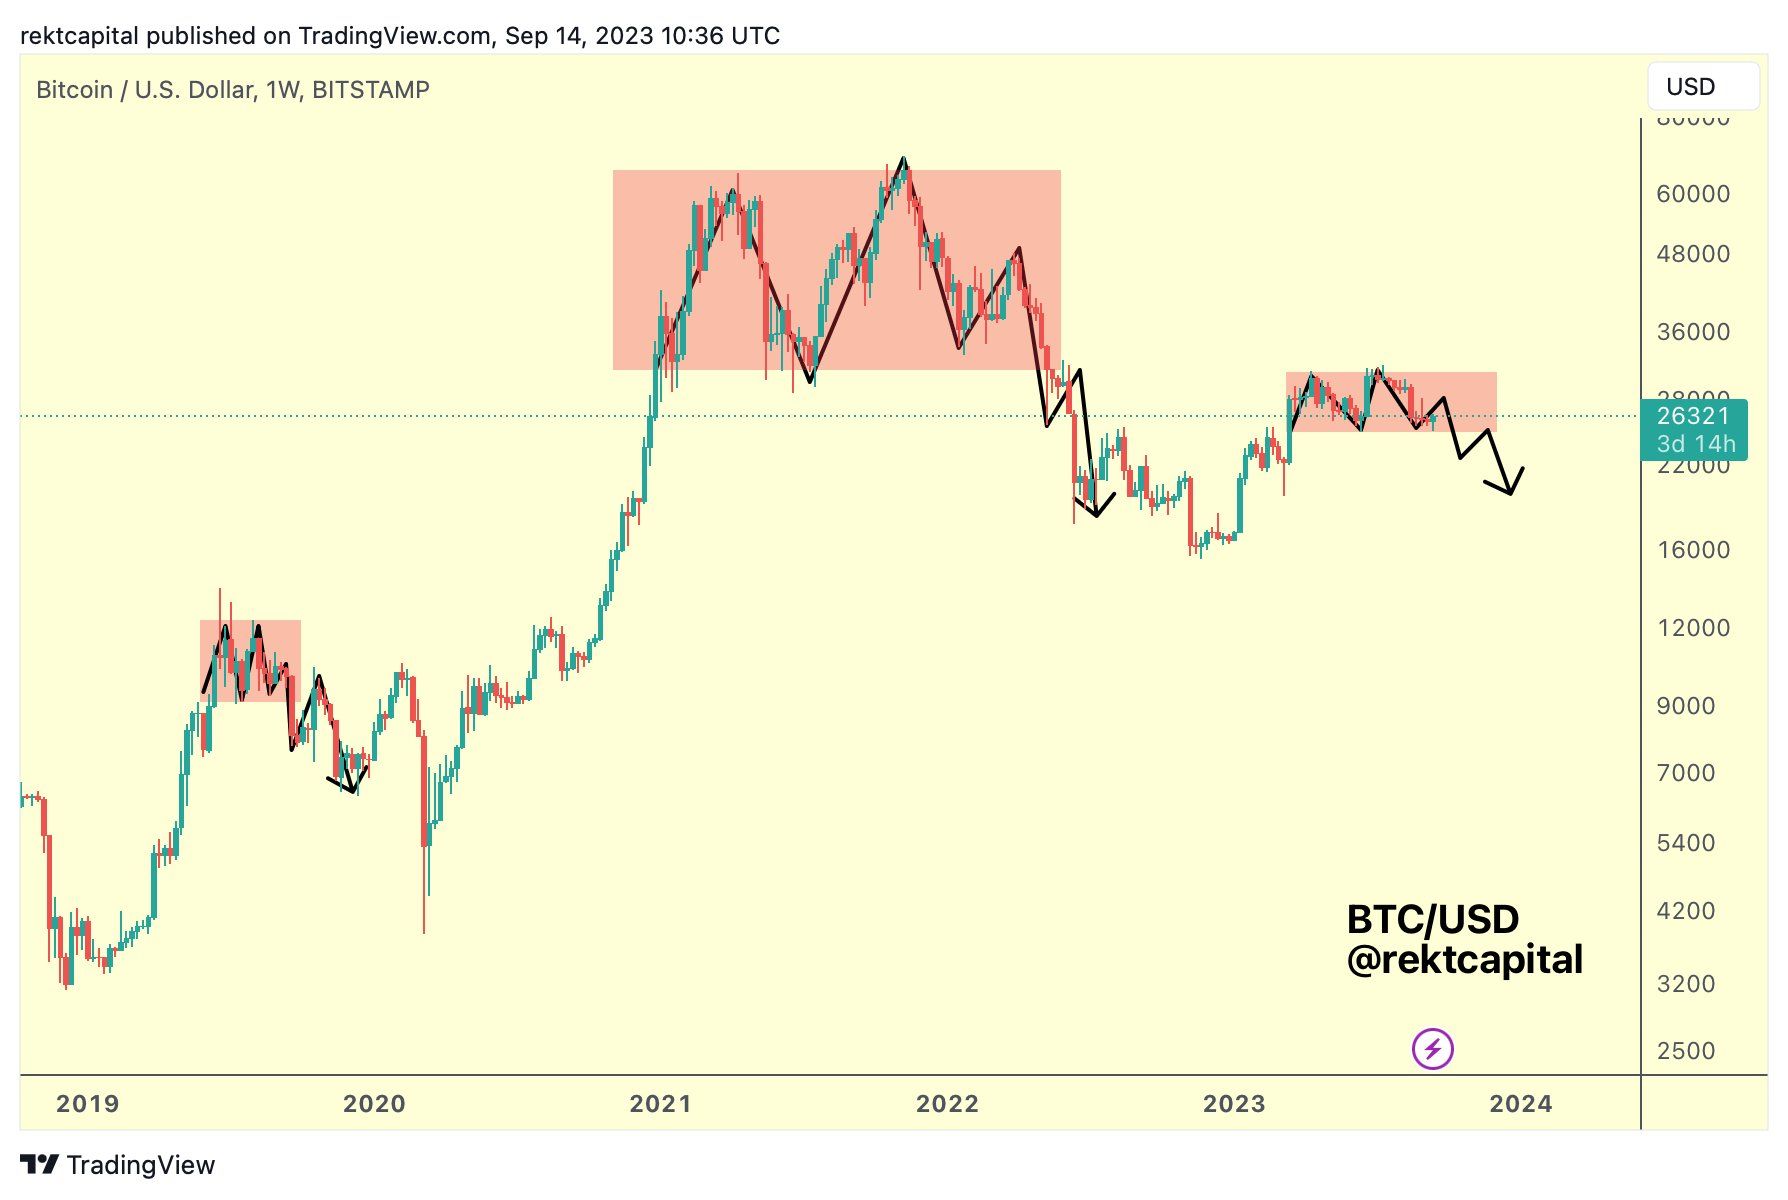
This upcoming move will be crucial because if price forms yet another Lower High, then the ~$25000-$26000 support area could be in danger and we'd see the lower $20,000s going into the end of the year.