Bitcoin - My Short Term & Long Term Perspective
Short Term and Long term Clarity

Welcome to the Rekt Capital newsletter, a place for people who want to better navigate the crypto markets with the help of cutting-edge crypto research and unbiased market analysis.
Bitcoin - Head & Shoulders Activated But Fully?

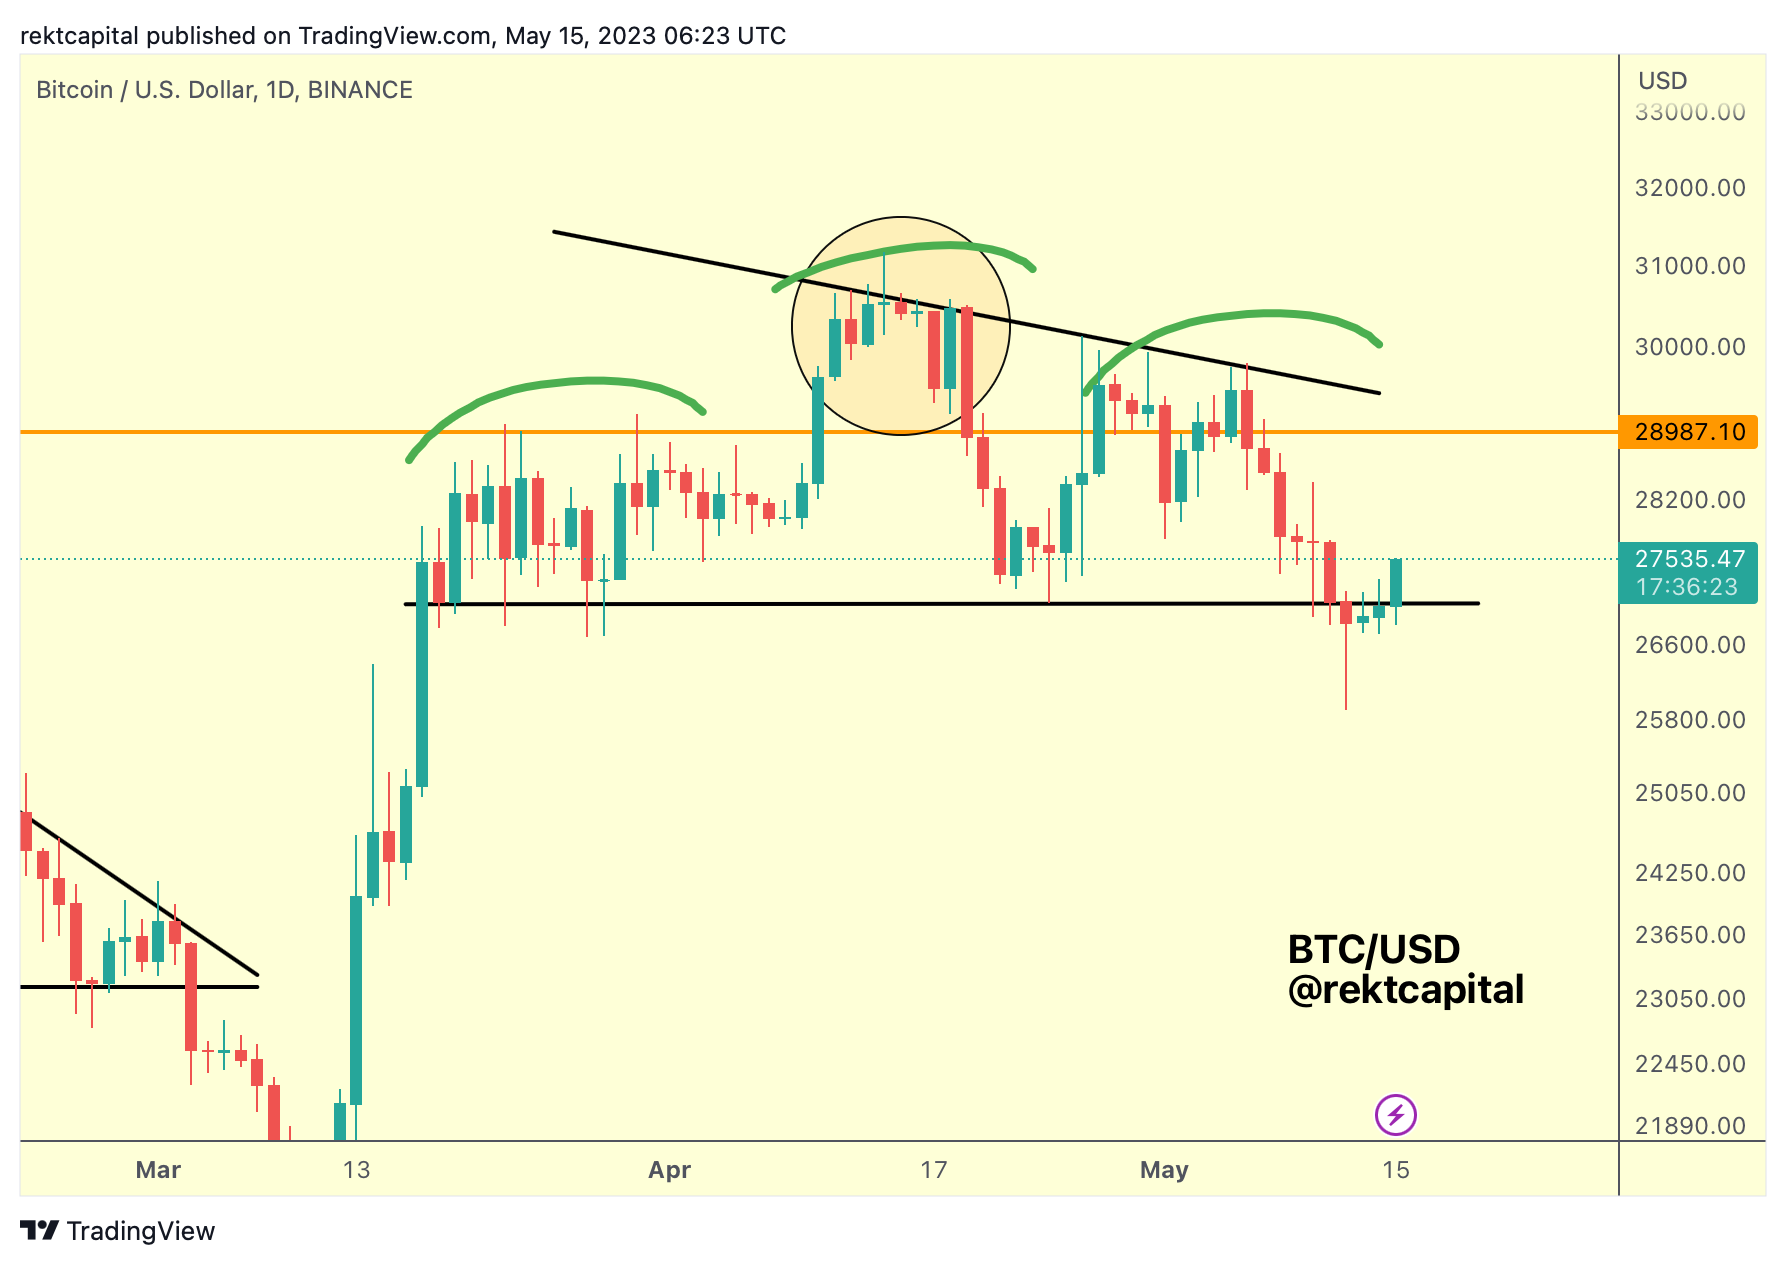
We spoke of the Head & Shoulders and how it was a predominant structure for price on the Daily timeframe.
And in fact, BTC has broken down from it and exacted a few Daily Candle Closes below the base of this formation.
A strong downside wick such as the one from a few days ago is a great sign of buy-side interest and is showing signs of a fake-breakdown.
This recent curl-up in price action and U-Shaped reversal has all the makings of bullish price action.
However, it’s important to take note that this is the Daily timeframe and what we need is macro confluence.
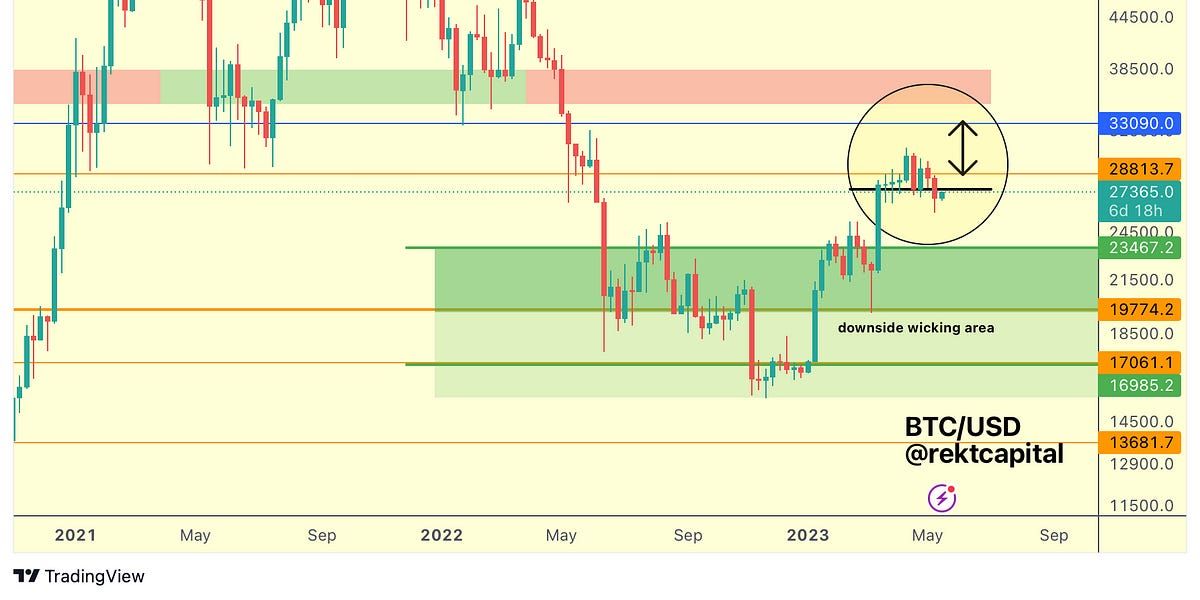
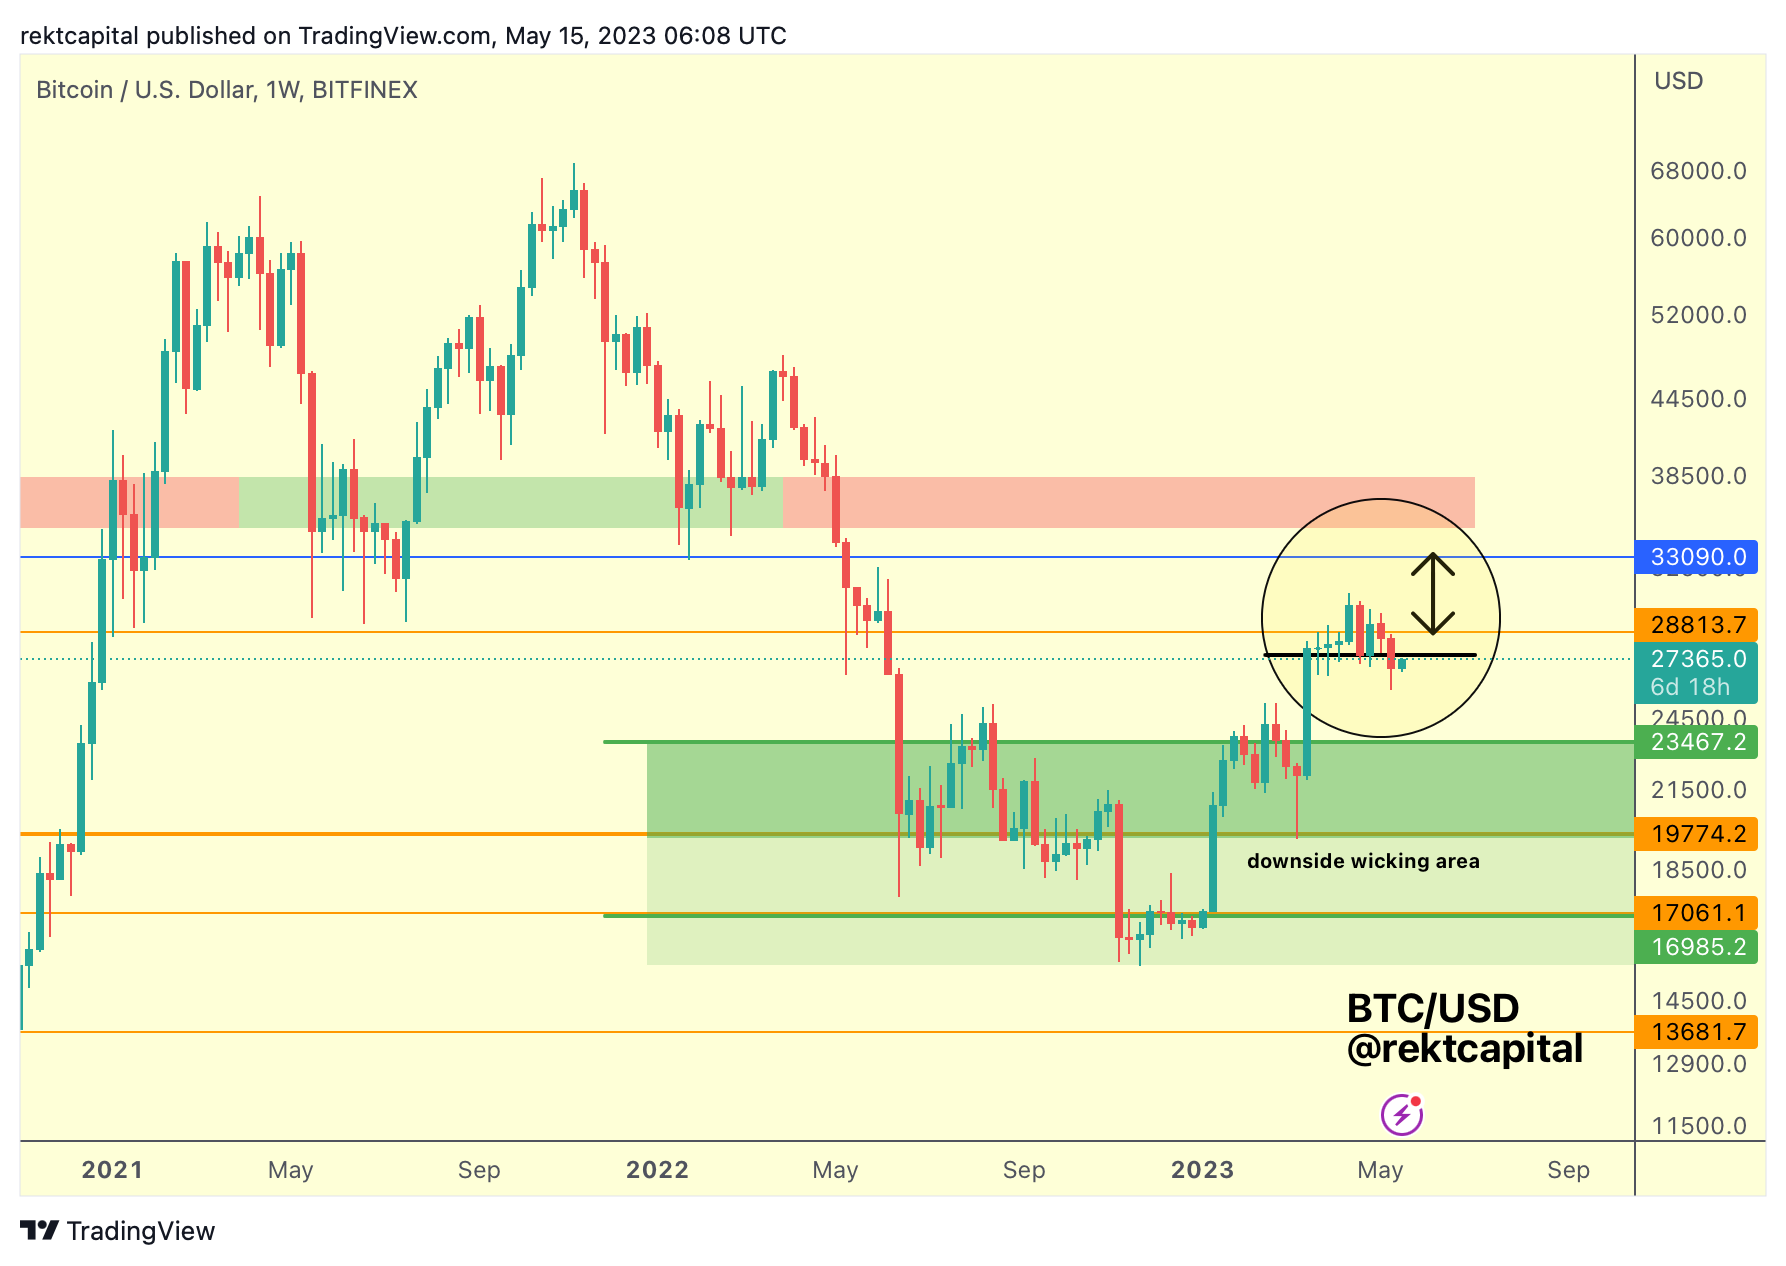
Because if we turn to the Weekly timeframe, price looks like it is relief rallying to turn an old Weekly support into new potential resistance:

BTC Weekly Closed below the black level of $27600.
This is the level that acted as support over the past few weeks.
A few weeks ago, we saw downside wicks against this black support and this past week we saw a Weekly Close below black.
That’s a substantial change in candlestick behaviour; downside wicking showing strong buy-side interest before whereas this past week price not even able to hold that same level.