Bitcoin Gearing Up For Another Leg Up?
My Perspective
Welcome to the Rekt Capital newsletter, a place for people who want to better navigate the crypto markets with the help of cutting-edge crypto research and unbiased market analysis.
The clock is ticking! ⏳ Only 2 days remain ⏳ for you to seize the opportunity to gain access to the next 3 Altcoins in the “10 Altcoins with 10X Potential” video series.
The Hall of Fame Rekt Capital subscription will give you full access to the ‘10 Altcoins with 10X Potential’ video series, plus year-long access to the Premium newsletter. Upgrade now and transform your financial journey in the next bull market:
If you’re currently on a Premium plan, go to your account, select ‘Change’ next to Plan and pick ‘Hall of Fame Inductee’ option under "You can switch to the following plans” to upgrade your subscription.
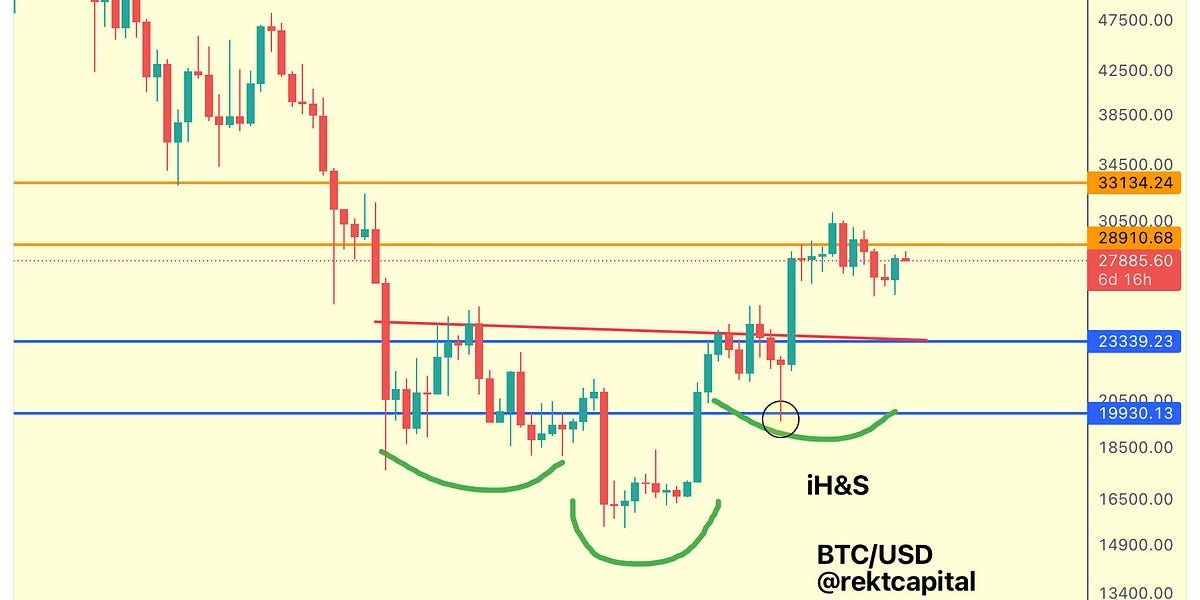
Bitcoin Inverse Head & Shoulders
Ever since breaking out from the inverse Head & Shoulders, Bitcoin has essentially skipped the entirety of the Monthly $23400-$28800 range (blue-orange).
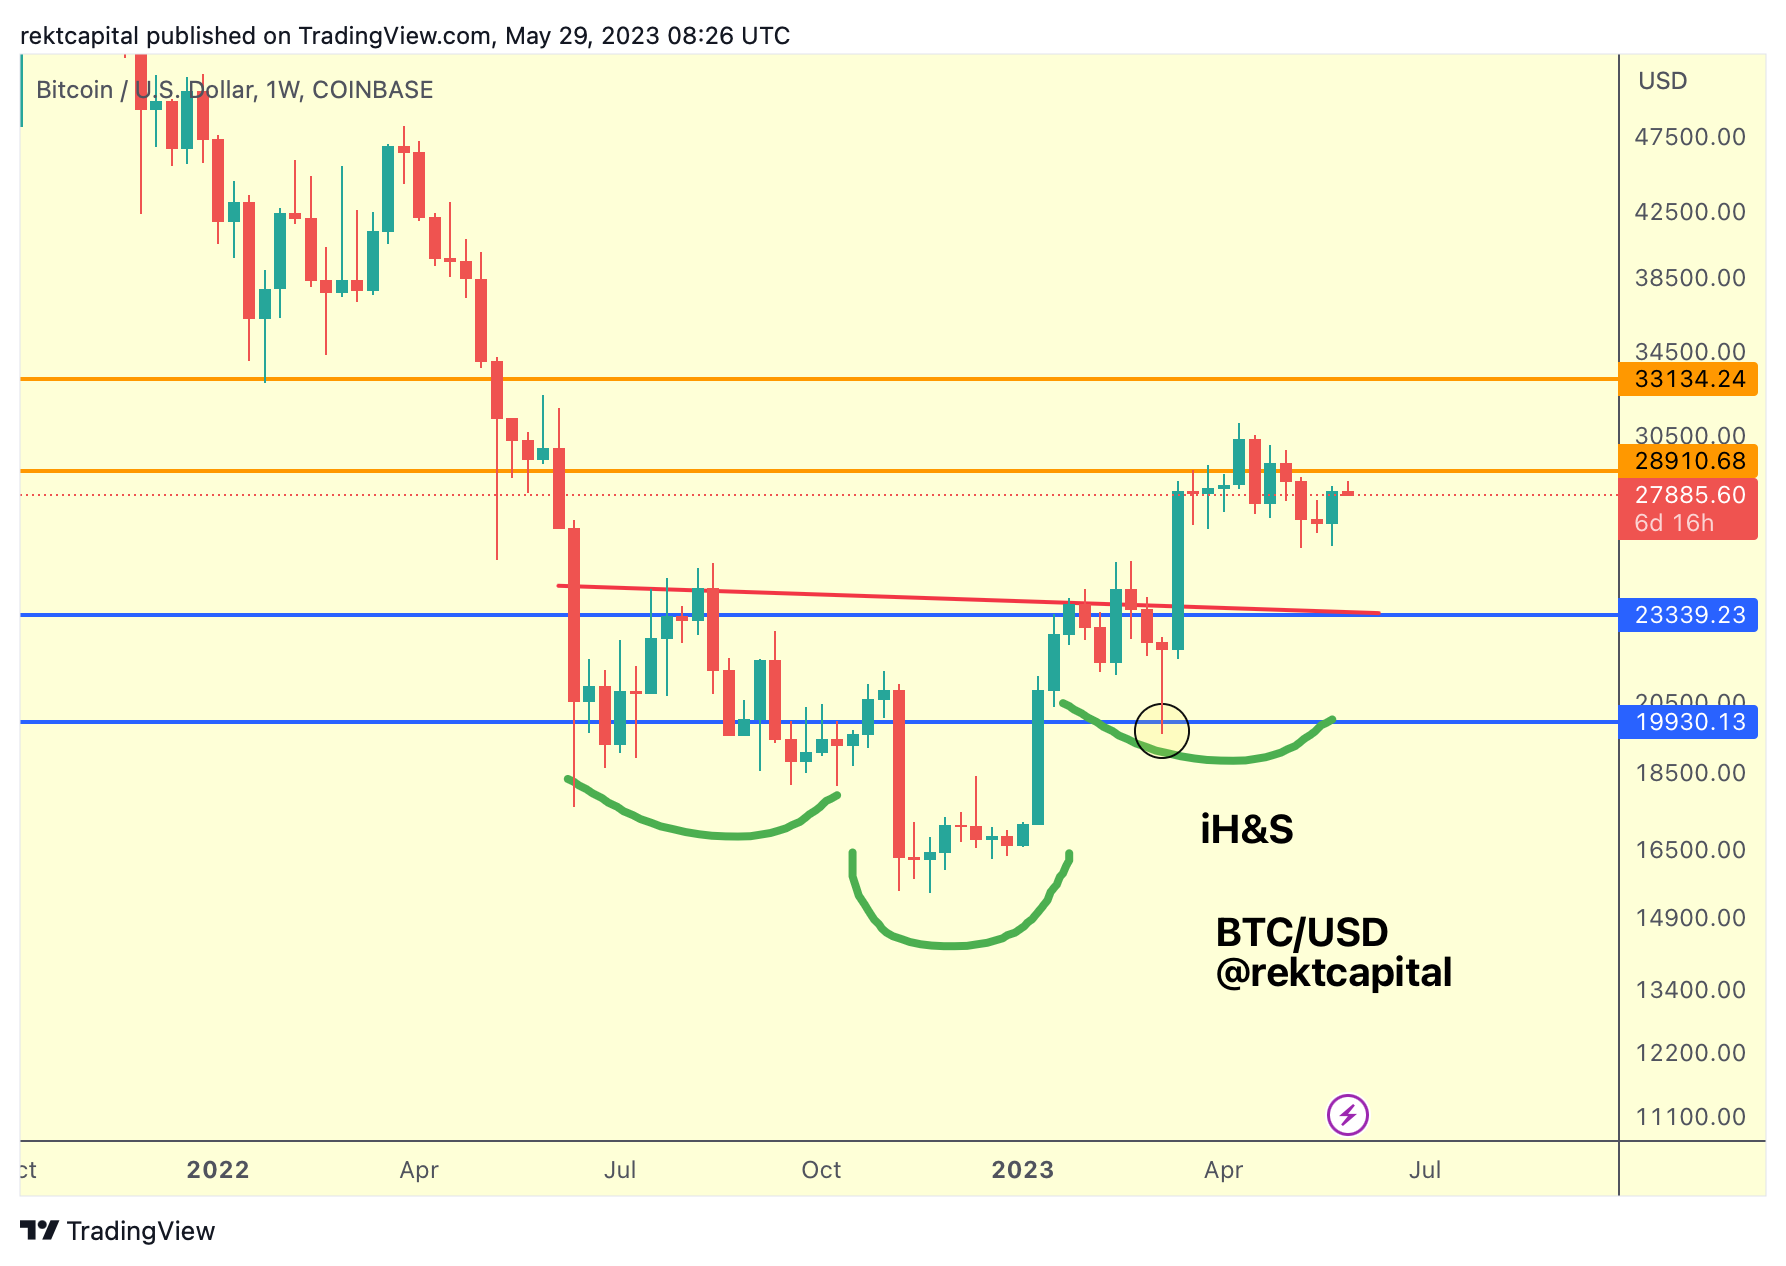
This range is outlined here on the Weekly chart but is even clearer on the Monthly Chart:
BTC has been consolidating at the Range Highs for weeks.
And though a sizeable rejection at the Range High has occurred this month, a decent buy-side reaction is in the process, this late in May.
Ideally, for the bulls a Monthly Close above ~$28800 would set price up for a reclaim of the Range High as support, essentially positioning it for a move to the $33000 level above.
At this time, BTC is therefore only $1000 away from securing a favourable Monthly Close.
But what could enable such a bullish outcome?
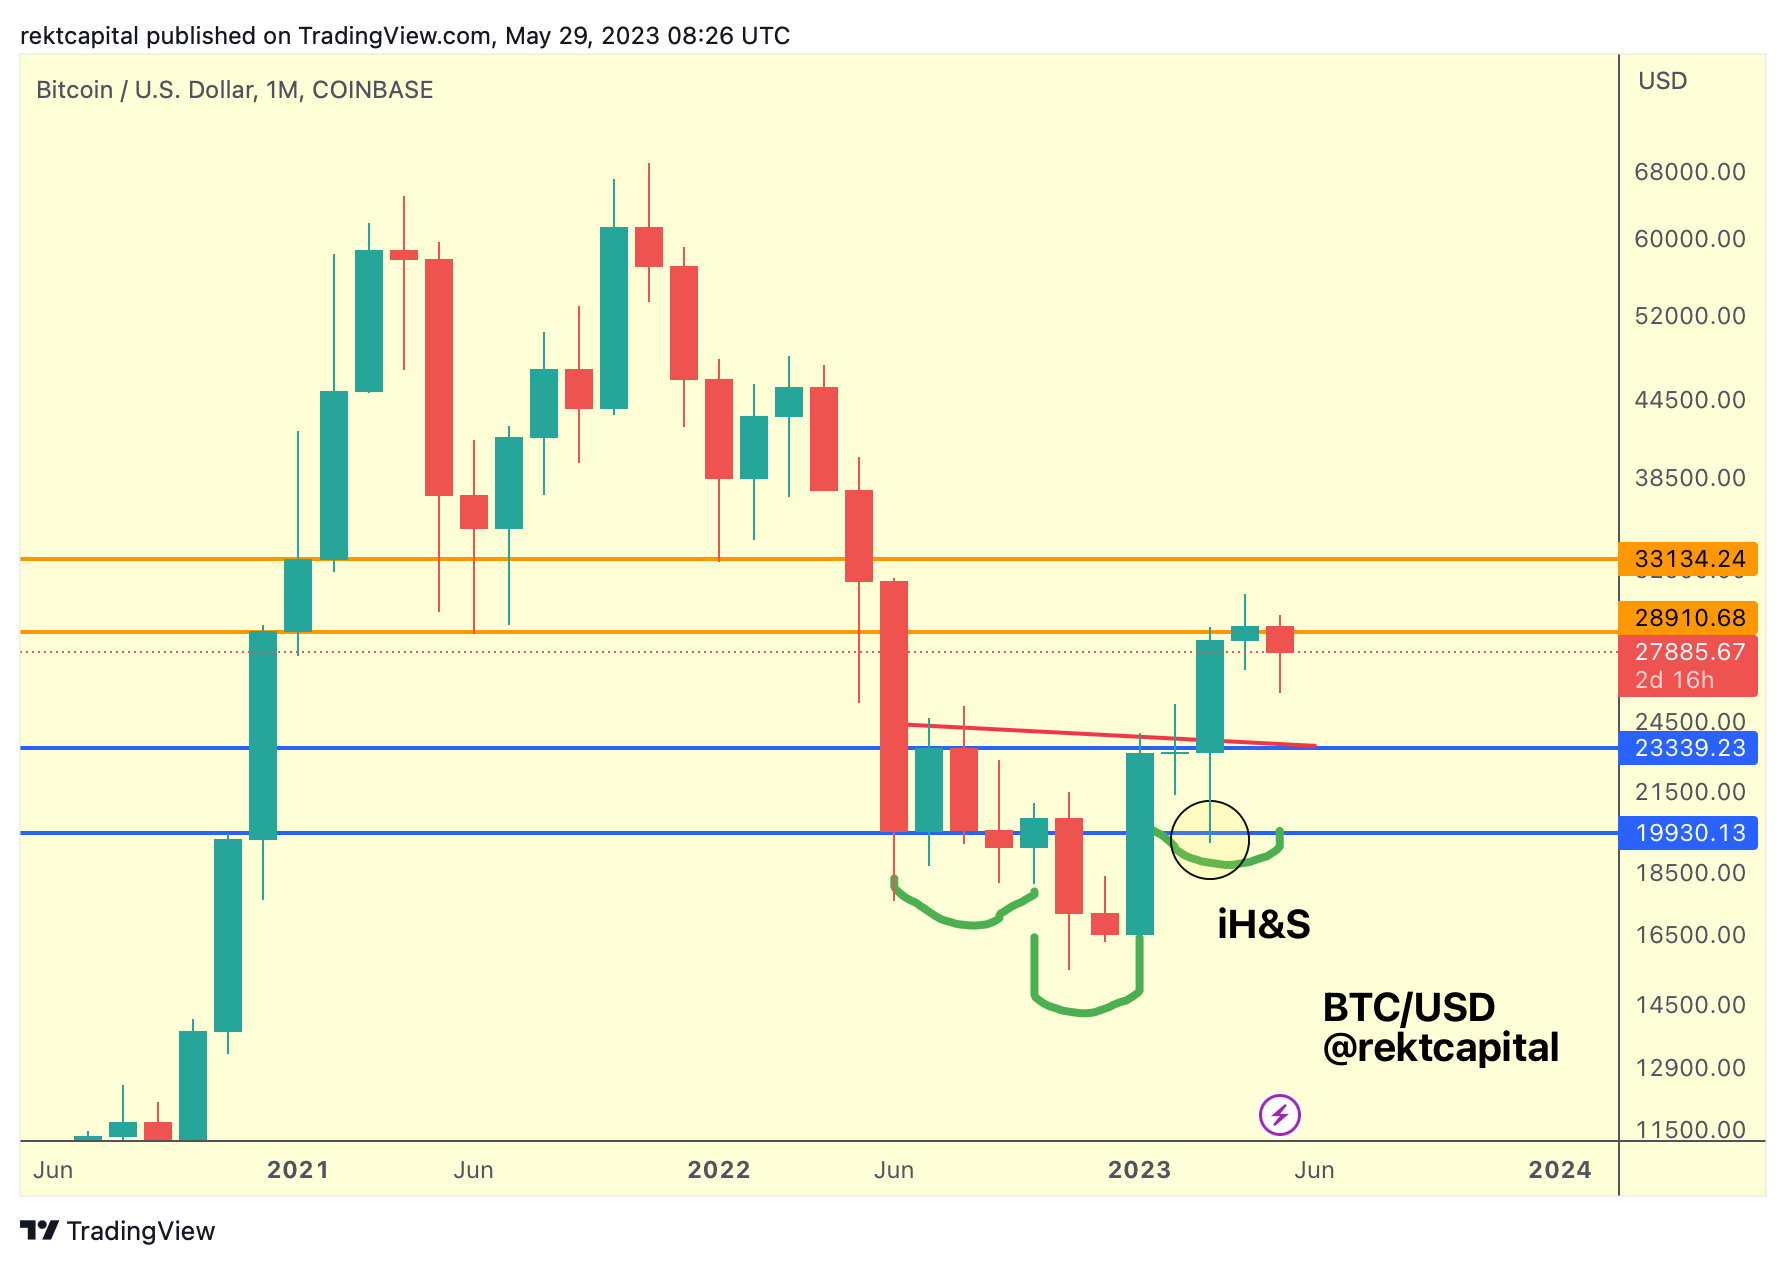
Bitcoin 200-Week MA
Bitcoin has recently rebounded from the 200-week MA:
Historically, BTC has formed generational bottoms here with the notable exception of this cycle where price deviated to the downside below it.
One interesting way of thinking about the 200 MA is that this 200-week MA has acted as the Neckline to the inverse Head and Shoulders.
Of course, we know the standard Neckline was at ~$23400 whereas the 200 MA Neckline breakout occurred when price was around ~$24000 but given how the 200-week MA is a dynamic resistance/support, over time the price it represents will change.
Right now, the 200-week MA is at $26350 and if the 200 MA is thought of as a Neckline then it has been retested most recently.
But perhaps the most important takeaway here is that the 200-week MA was broken as resistance months ago and now is being flipped into new support:
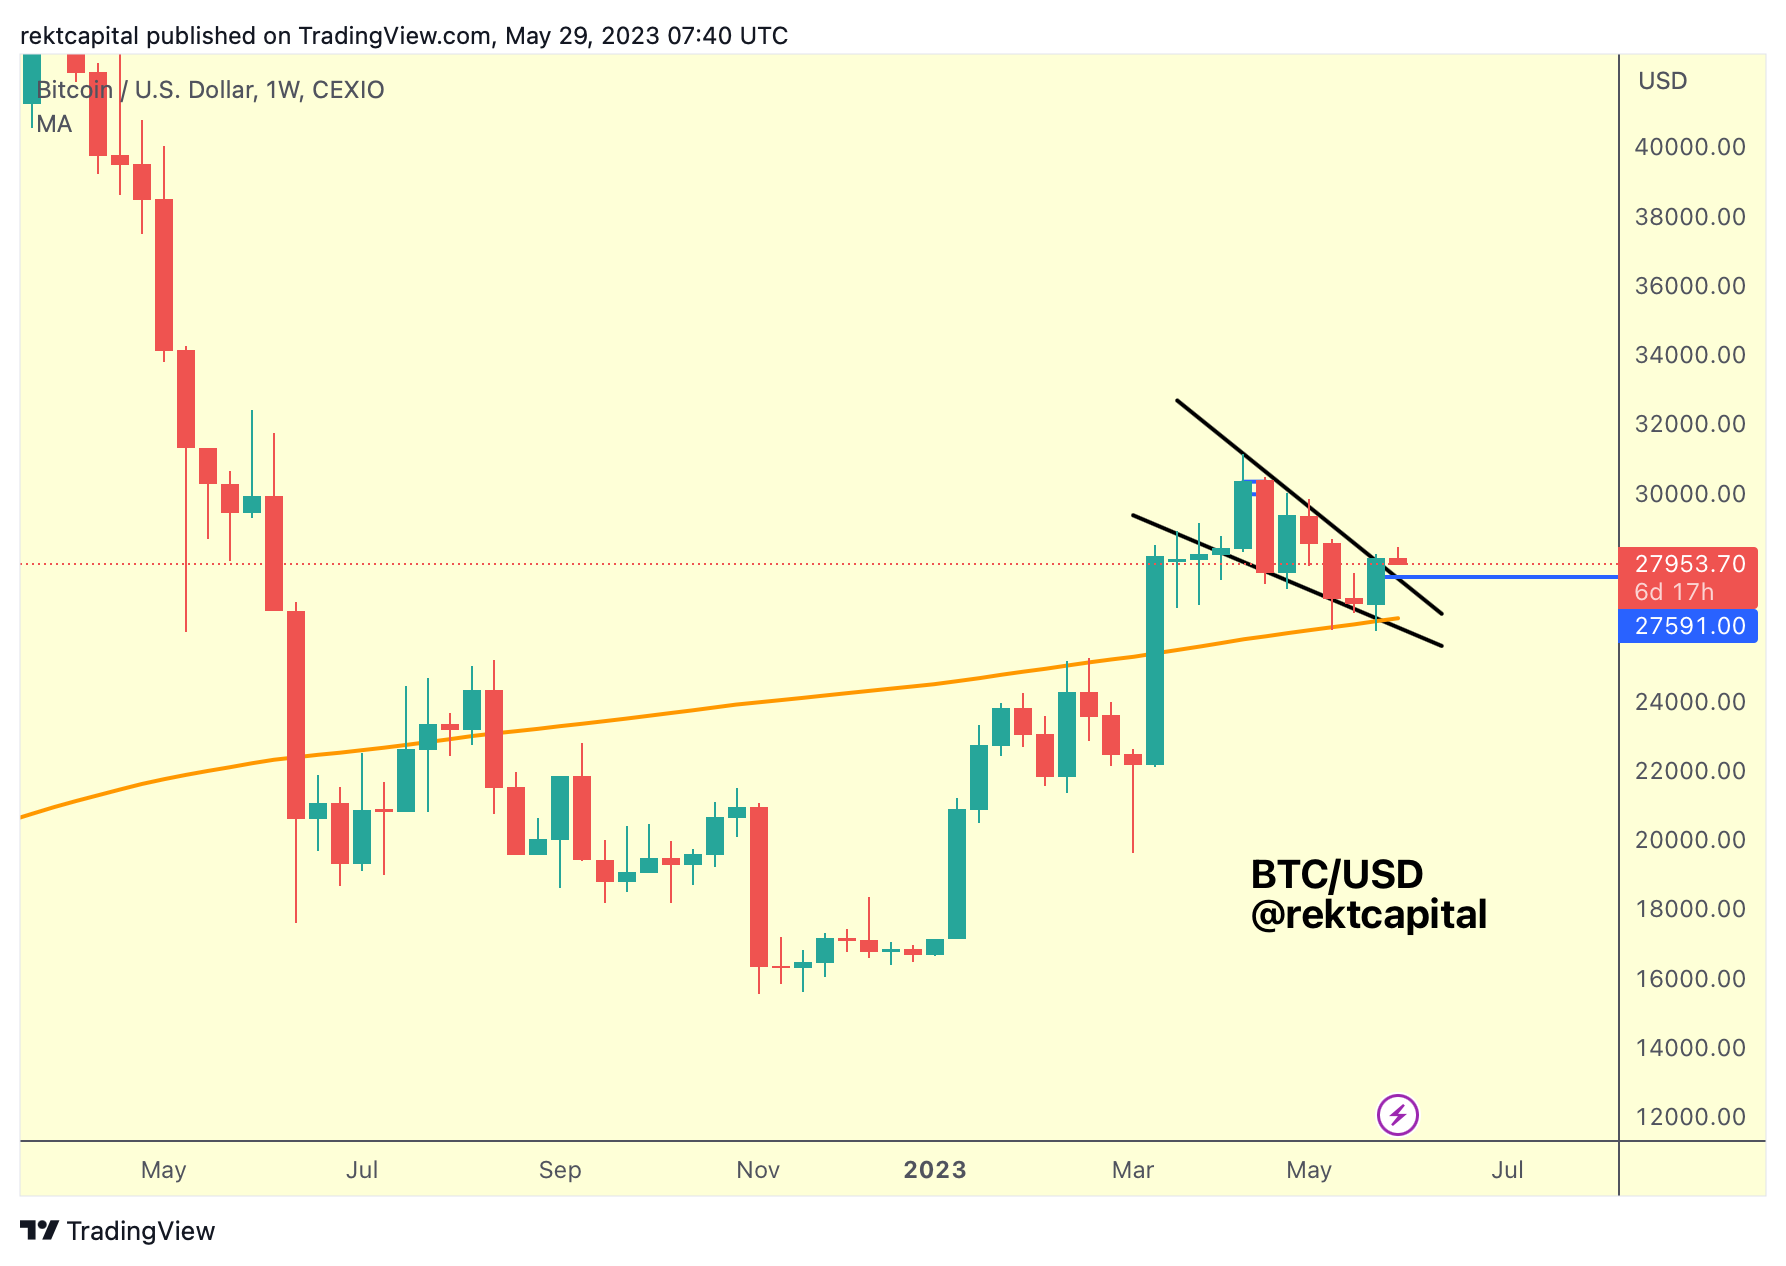
And what’s interesting about the behaviour of price action right now is that price may be forming a Falling Wedge at the 200-week MA.
It just so happens that the most recent Weekly Close has occurred at or just above the Falling Wedge resistance.
What would confirm the Falling Wedge breakout would be a dip to the top of the pattern and a successful retest there to prompt post-breakout trend continuation.
The Falling Wedge breakout point is ~$27600 which is no condense as that is a key Weekly level:
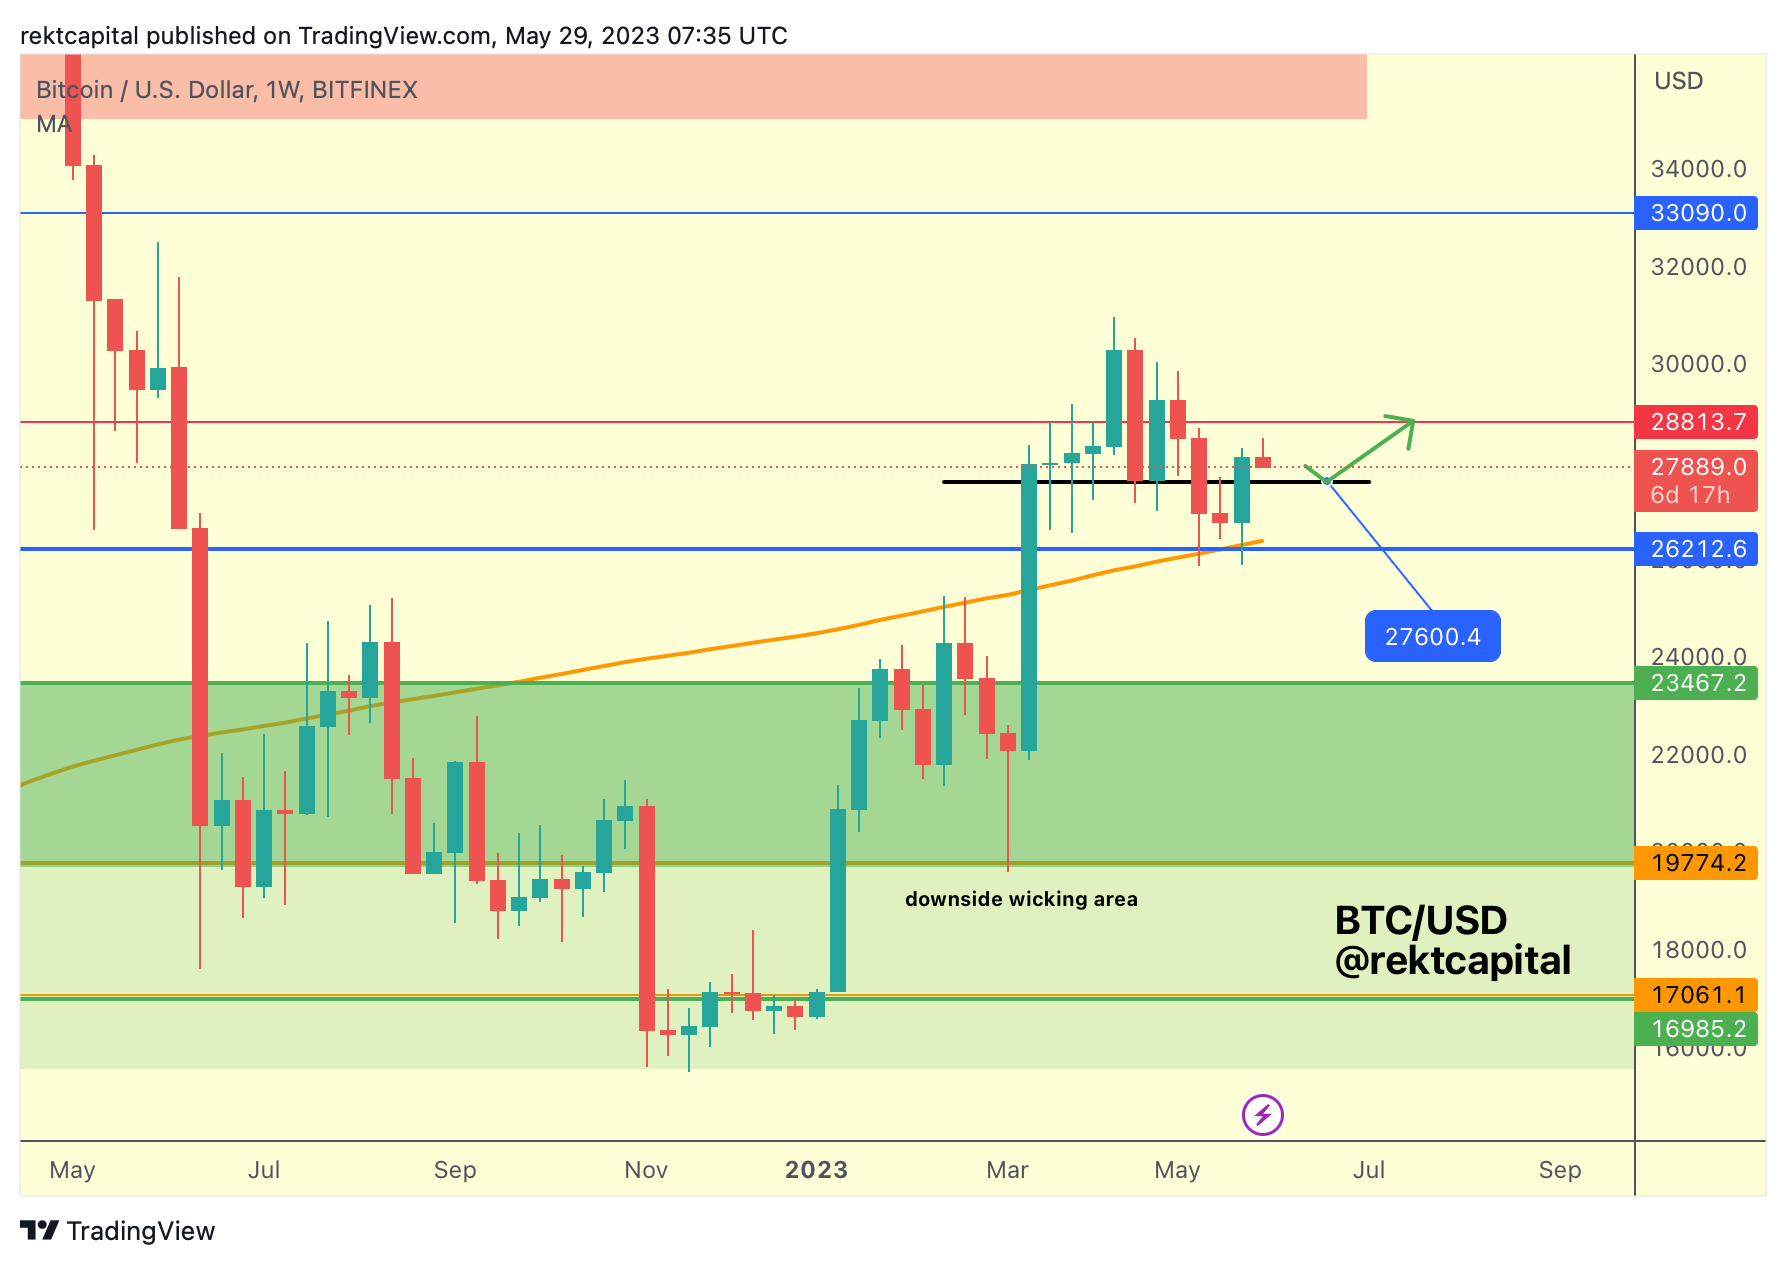
There’s a lot going on in this chart but the most important thing to focus on is the ~$27600 level (black).
It acted as support for many weeks before being lost some two weeks ago.
But this recent Weekly Close has occurred above this support and so it is possible that price is now positioning itself for a reclaim.
A reclaim of ~$27600 as support would of course tie in with a retest attempt of the Falling Wedge and it is this technical step that would enable a rally closer to securing that bullish Monthly outcome of Monthly Closing above ~$28800.