Bitcoin Bear Market Bottom Indicators
Indicators I am using
Welcome to the Rekt Capital newsletter, a place for people who want to better navigate the crypto markets with the help of cutting-edge crypto research and unbiased market analysis.
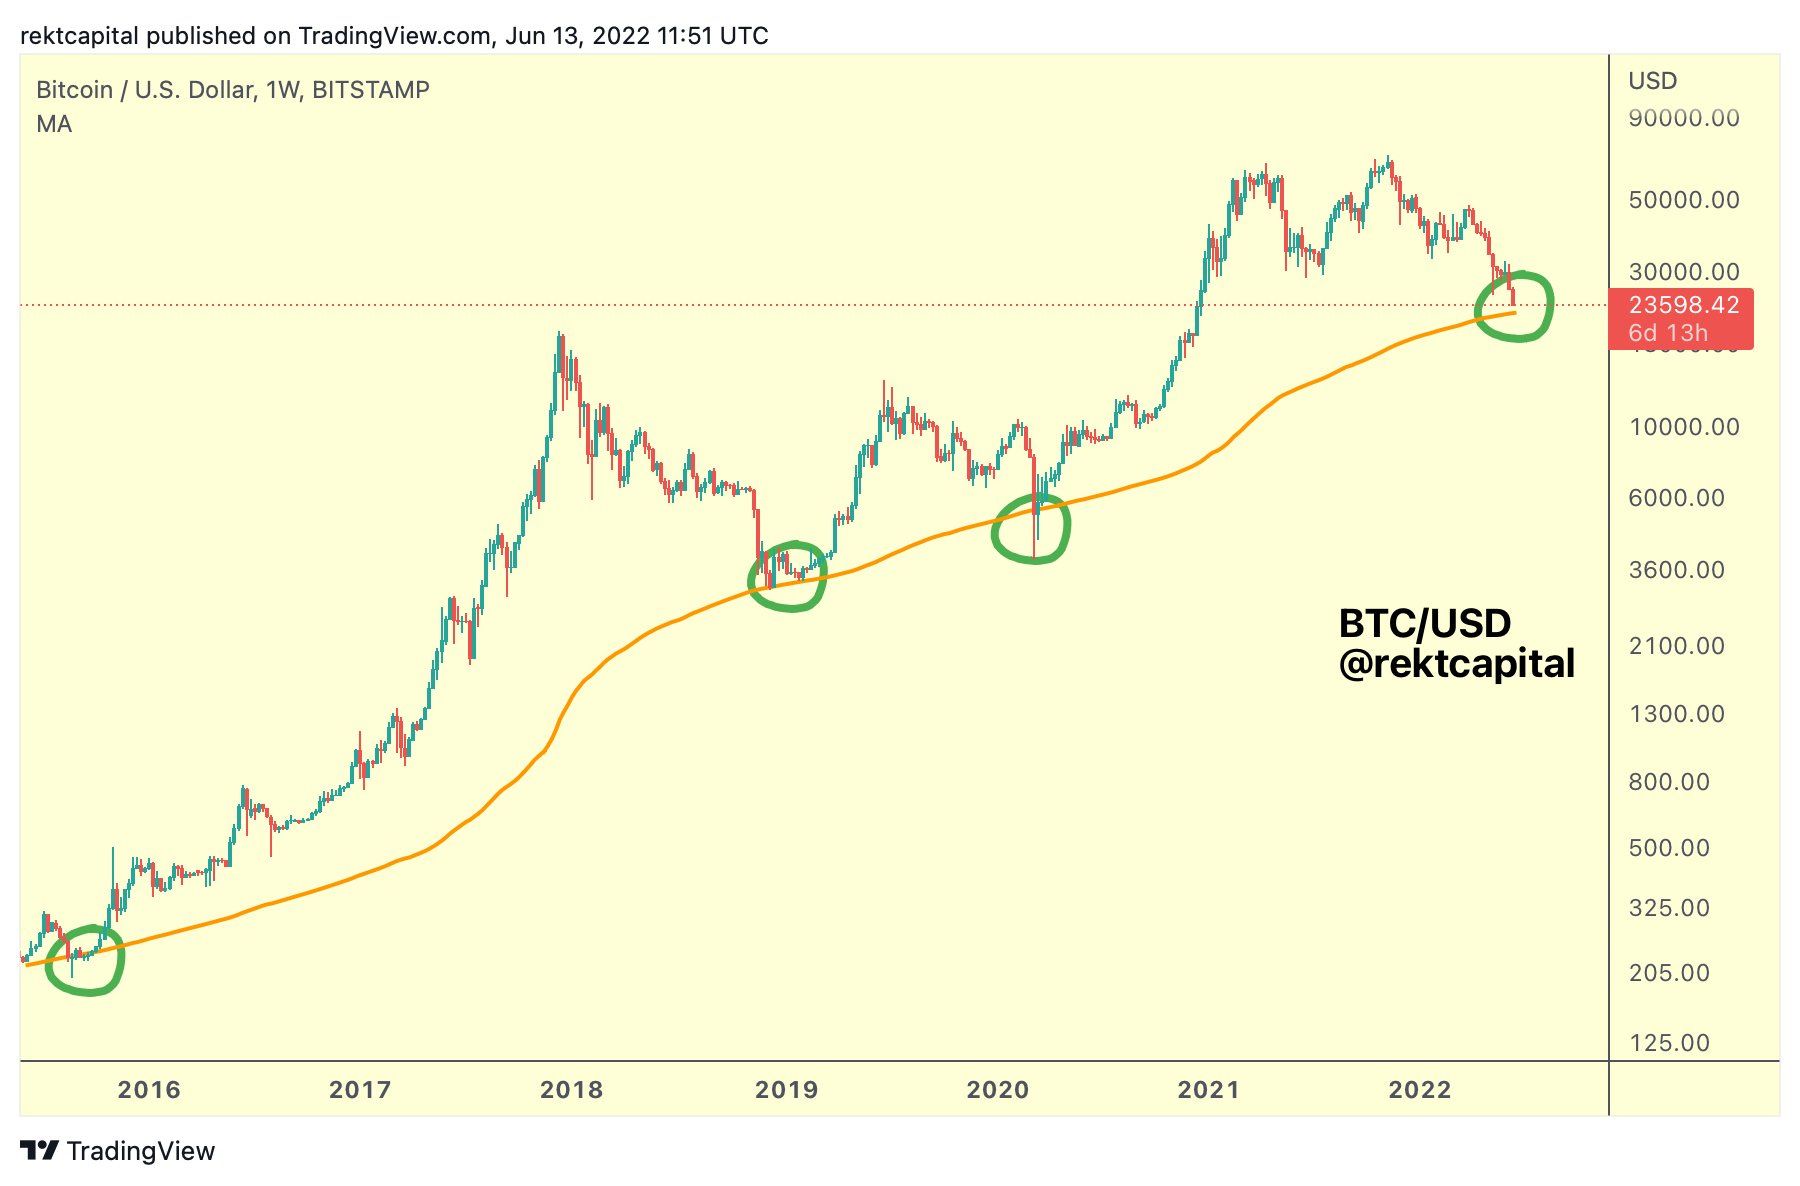
The 20-Month MA

Let’s unpack this chart in more detail.
First of all - BTC tends to retrace anything between -46% to -63% below the 20-month MA.
Right now, BTC has retraced -43% since losing the 20-month MA.
Interestingly, the -46% mark which we saw in the March 2020 COVID crash would align with the ~$22000 price level which is where the 200-week MA is located (this is an MA that has offered solid support in marking Bear Market bottoms):
However, going back to the 20-month MA…
Retracement Depth

We’ve seen -46%, -52%, and -63% retracements below the 20-month MA.
Here is a list of what prices those retracements correspond to:
- -46% —> ~$22000 (confluent with 200-week MA)
- -52% —> ~$19000
- -63% —> ~$15500
What’s interesting about all of these figures is that they tie in with figures that emerged from my historical analysis of Death Cross retracements.
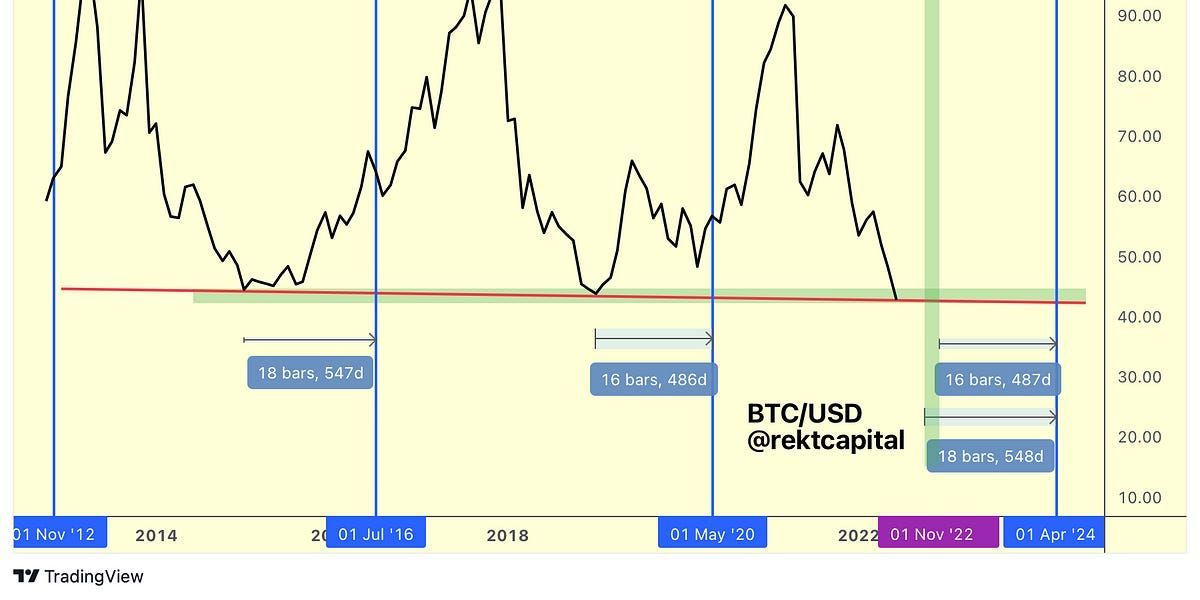
But we also know that BTC doesn’t stay below this MA forever.