Bitcoin & Ethereum - What's Next?
BTC, ETH, Bitcoin Dominance and Altcoin Index analysis
Welcome to the Rekt Capital Newsletter!
In today’s newsletter, I’ll share a detailed review of Ethereum’s price action after the Merge and what we need to focus on going forward.
If you like the newsletter, it would mean a lot if you spread the word and tell your friends about it:
I'm excited to announce my partnership with Bitget crypto exchange! 🔥
Bitget is the world's largest crypto copy trading platform, official partner of Juventus Football Club and top 5 crypto derivatives exchange in volume as listed on CoinMarketCap!
To celebrate, Bitget has been very kind to arrange another special promo for valued readers of the Rekt Capital Newsletter.
Sign up using my link to Bitget and you will get:
• Up to $8000 sign up bonus 🔥
• 15% discount on ALL futures trading fees 🔥
• 0 fees on ALL spot market pairs 🔥
Sign up to Bitget using my link and make the most of this special promo:
In today’s newsletter, I will cover:
- The Bitcoin Monthly Chart
- The Bitcoin Quarterly Chart
- The Ethereum Weekly Chart
- The Ethereum Monthly Chart
- The Ethereum Quarterly Chart
- Bitcoin Dominance
- Altcoin Index
Let’s dive into today’s action-packed analysis:
Bitcoin - The Monthly and Quarterly Views
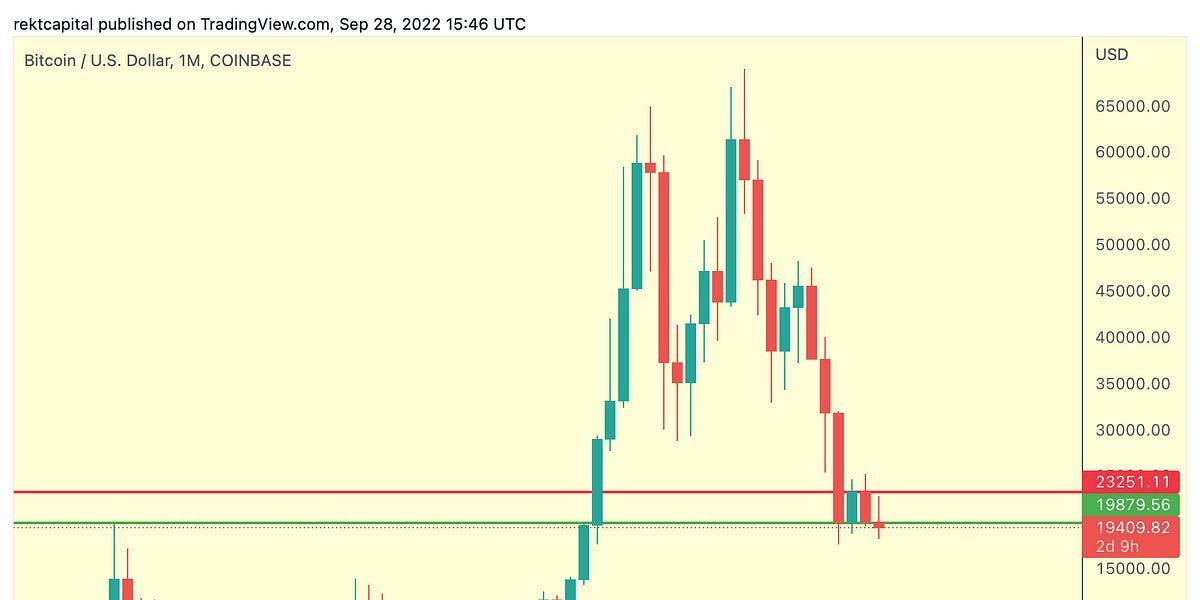
On the Monthly view, Bitcoin tells a story of a range breakdown, as of this moment:
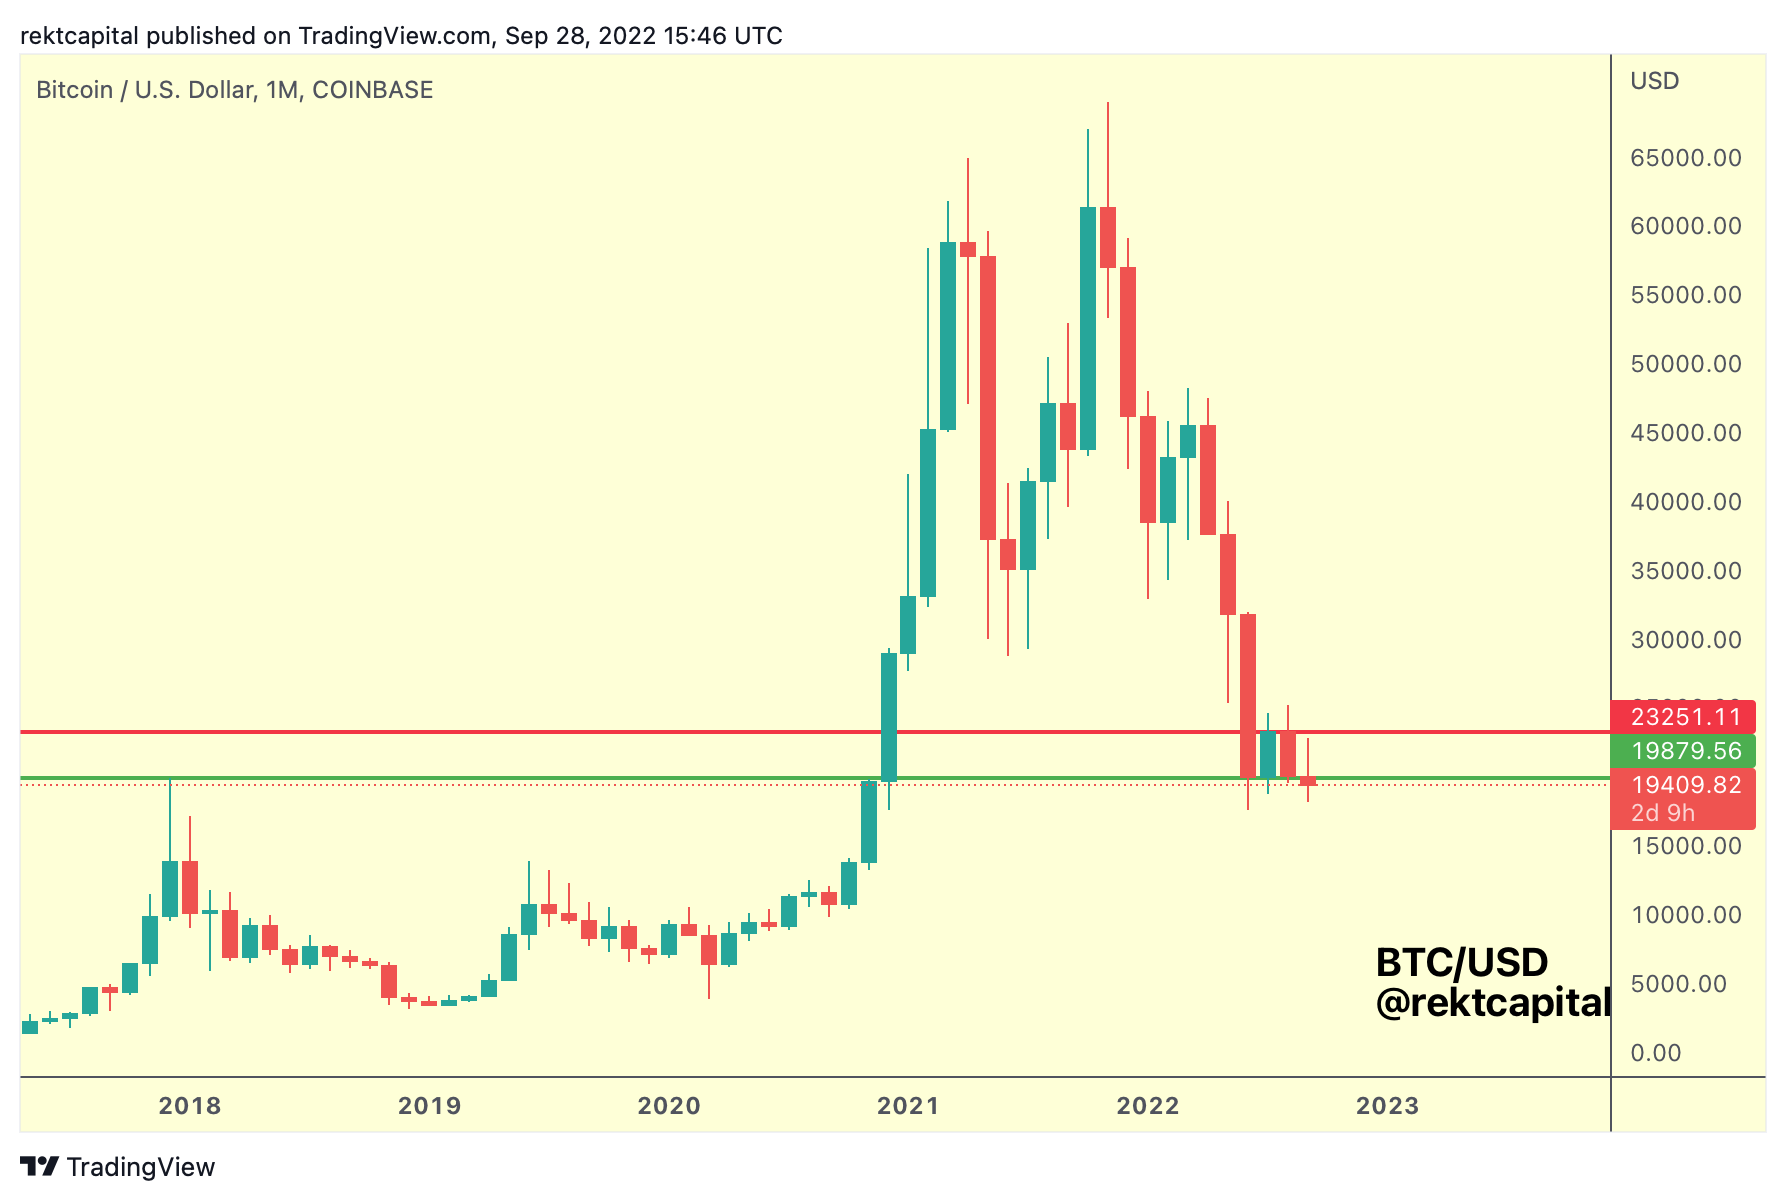
After rebounding from the green Range Low support last month, BTC has produced a very limited reaction this month, indicating weakness not just in the candlestick itself, but also in the actual positioning of the candlestick.
That is, right now BTC’s Monthly candle in September is slinking below the Range Low support, threatening to lose it as support and in fact flip it into new resistance.
This sort of price positioning suggests that BTC is setting itself up for a technical breakdown from the macro green-red range, home to a four-month consolidation period at these prices.
Monthly Close below green would suggest that the green level is flipping into resistance which could reject price into downside continuation.
The Quarterly timeframe also tells a story of a range breakdown, but on this 3-month view, the range looks rather different, though the takeaway is the same as on the Monthly:

On the Quarterly, BTC has occupied the green-black range.
And while last Quarter BTC was able to hold support at green via a candle-bodied, slightly downside wicking below green, this Quarter BTC looks like it is slipping from this support.
In fact, the upside wick beyond this support pretty conclusively suggests that the green level is flipping into new resistance.
In which case BTC is leaving this Quarterly range, within which much consolidation on the 3-Month timeframe didn’t take place.
Instead, the story is that last Quarter there was a bounce from green, but that bounce amounted to little price appreciation given how weak the buy interest has been at that green level.
After all, in 2017 this green level figured as a strong resistance, but right now we’re seeing that this level isn’t an analogously strong support.
Quarterly Close is just a few days away so a Quarterly Close below green would likely set price up for a rejection into the first immediate 3-Month support (blue):
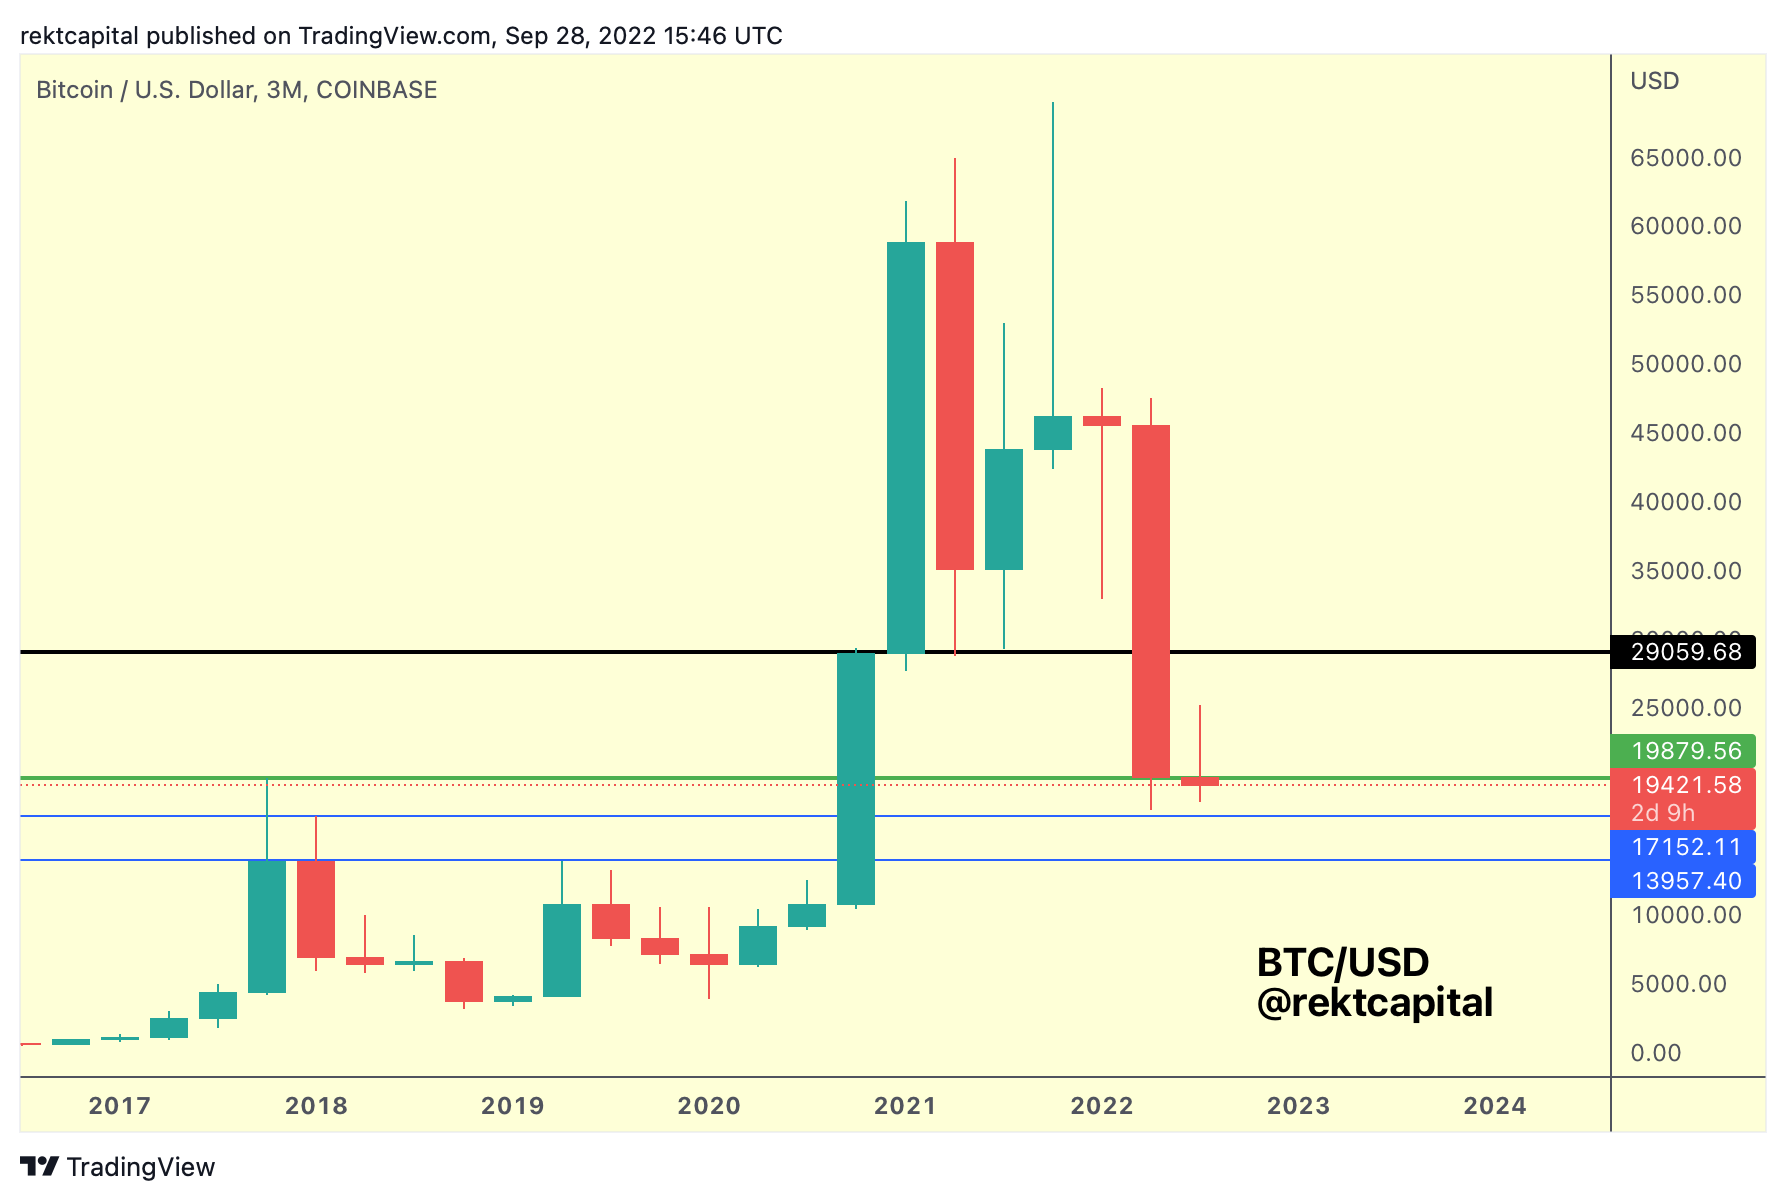
That’s the ~$17000 level which would mean BTC needs to drop to new lows in this Bear Market, should indeed that bearish 3-month close take place.
If the green ~$20000 Quarterly level is anything to go by, wicking levels don’t always figure as strong supports, which is one argument that calls the ~$17000 Quarterly support into question: will it be as weak as $20K has been?
The ~$14000 Quarterly level rests on the two Quarterly candle-bodied resistances in late 2017/early 2018, and so it would be easier to assume a strong, major demand area could form there.
But until then, the ~$17000 is the level that may likely get tagged in the absence of a favourable Candle Close for BTC later this month.
And it will be important to watch the ~$17000 level and the reaction of price from there; in fact, downside wicking below the ~$17K isn’t out of the question during what would be a likely volatile support test.