Altcoin Special
Features TA on Altcoins DOT, EGLD, LTC, ETH, THETA, CRO, ICX, ALGO
Welcome to the Rekt Capital newsletter, a place for people who want to better navigate the crypto markets with the help of cutting-edge crypto research and unbiased market analysis.
In today’s Altcoin Special, I cover 8 different Altcoins, specifically:
- Polkadot (DOT/USDT)
- Elrond (EGLD/USDT
- Litecoin (LTC/USD)
- Ethereum (ETH/USD)
- Theta Token (THETA/USDT)
- Crypto Com (CRO/USDT)
- Icon (ICX/USDT)
- Algorand (ALGO/USDT)
Altcoin Special
Polkadot - DOT/USDT
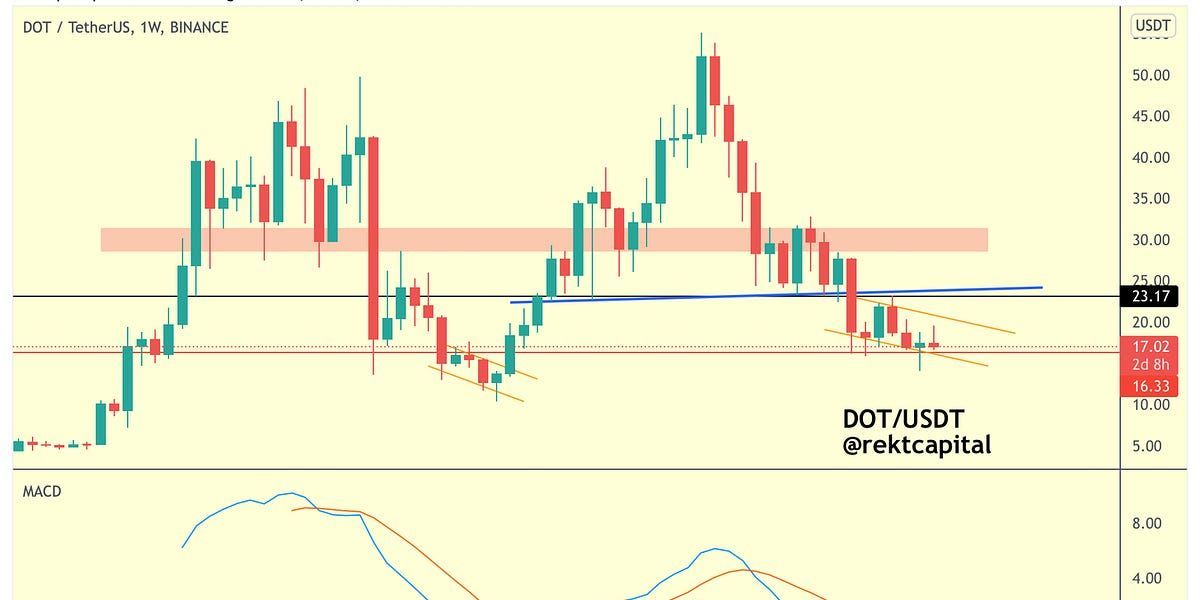
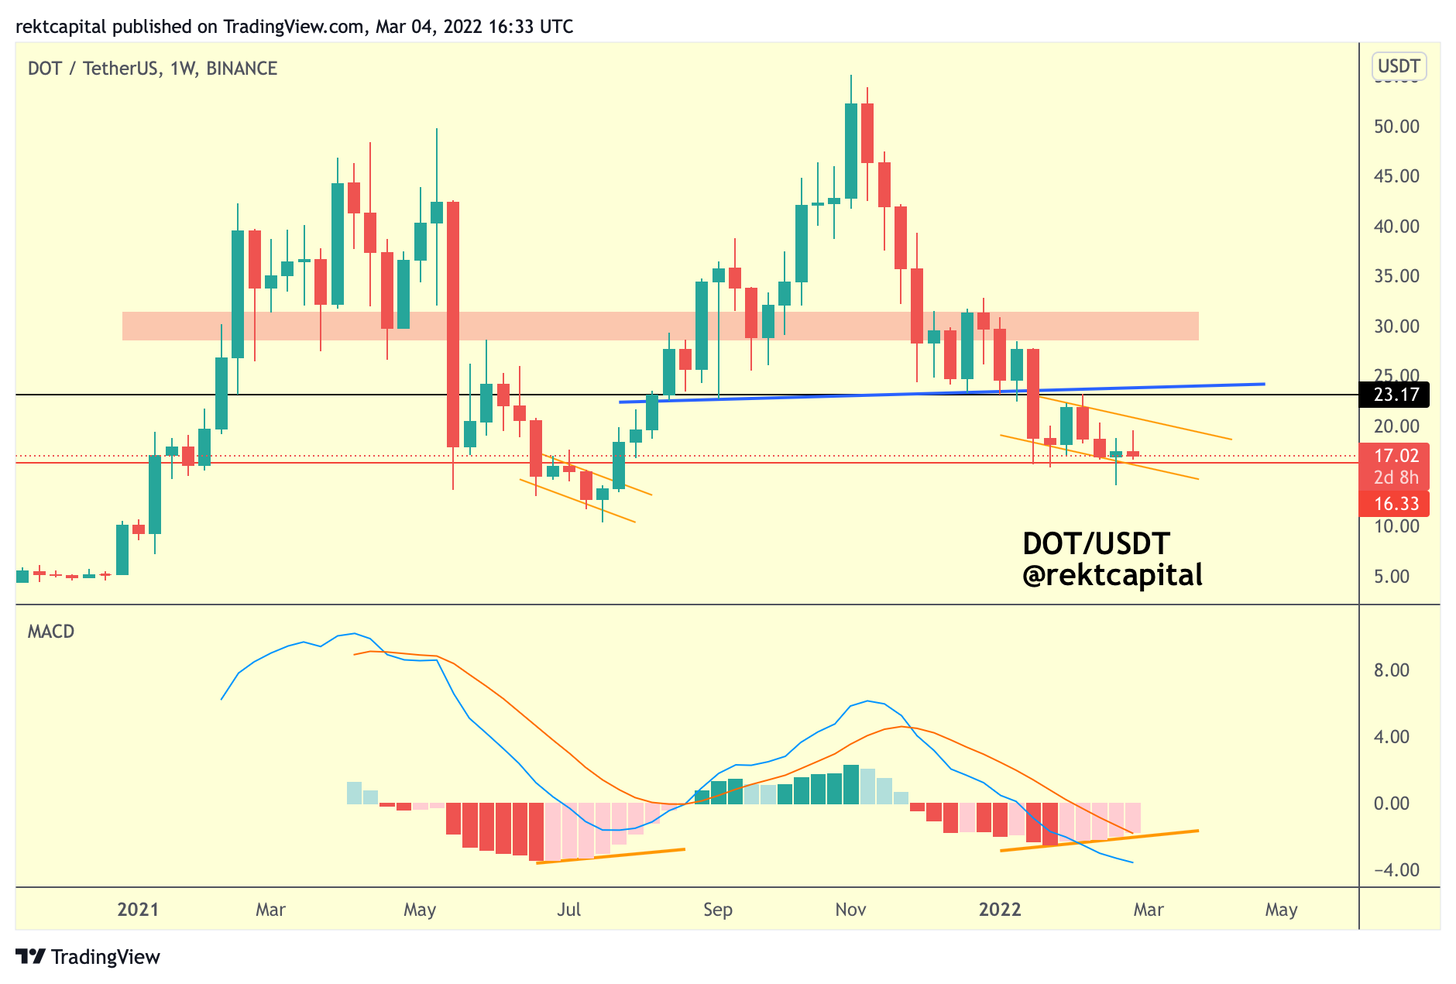
Earlier this March, I spoke about how DOT was finding support at a key Monthly level (red), forming a downtrending channel, and enjoying bullish divergences on the MACD:
Here is an update:
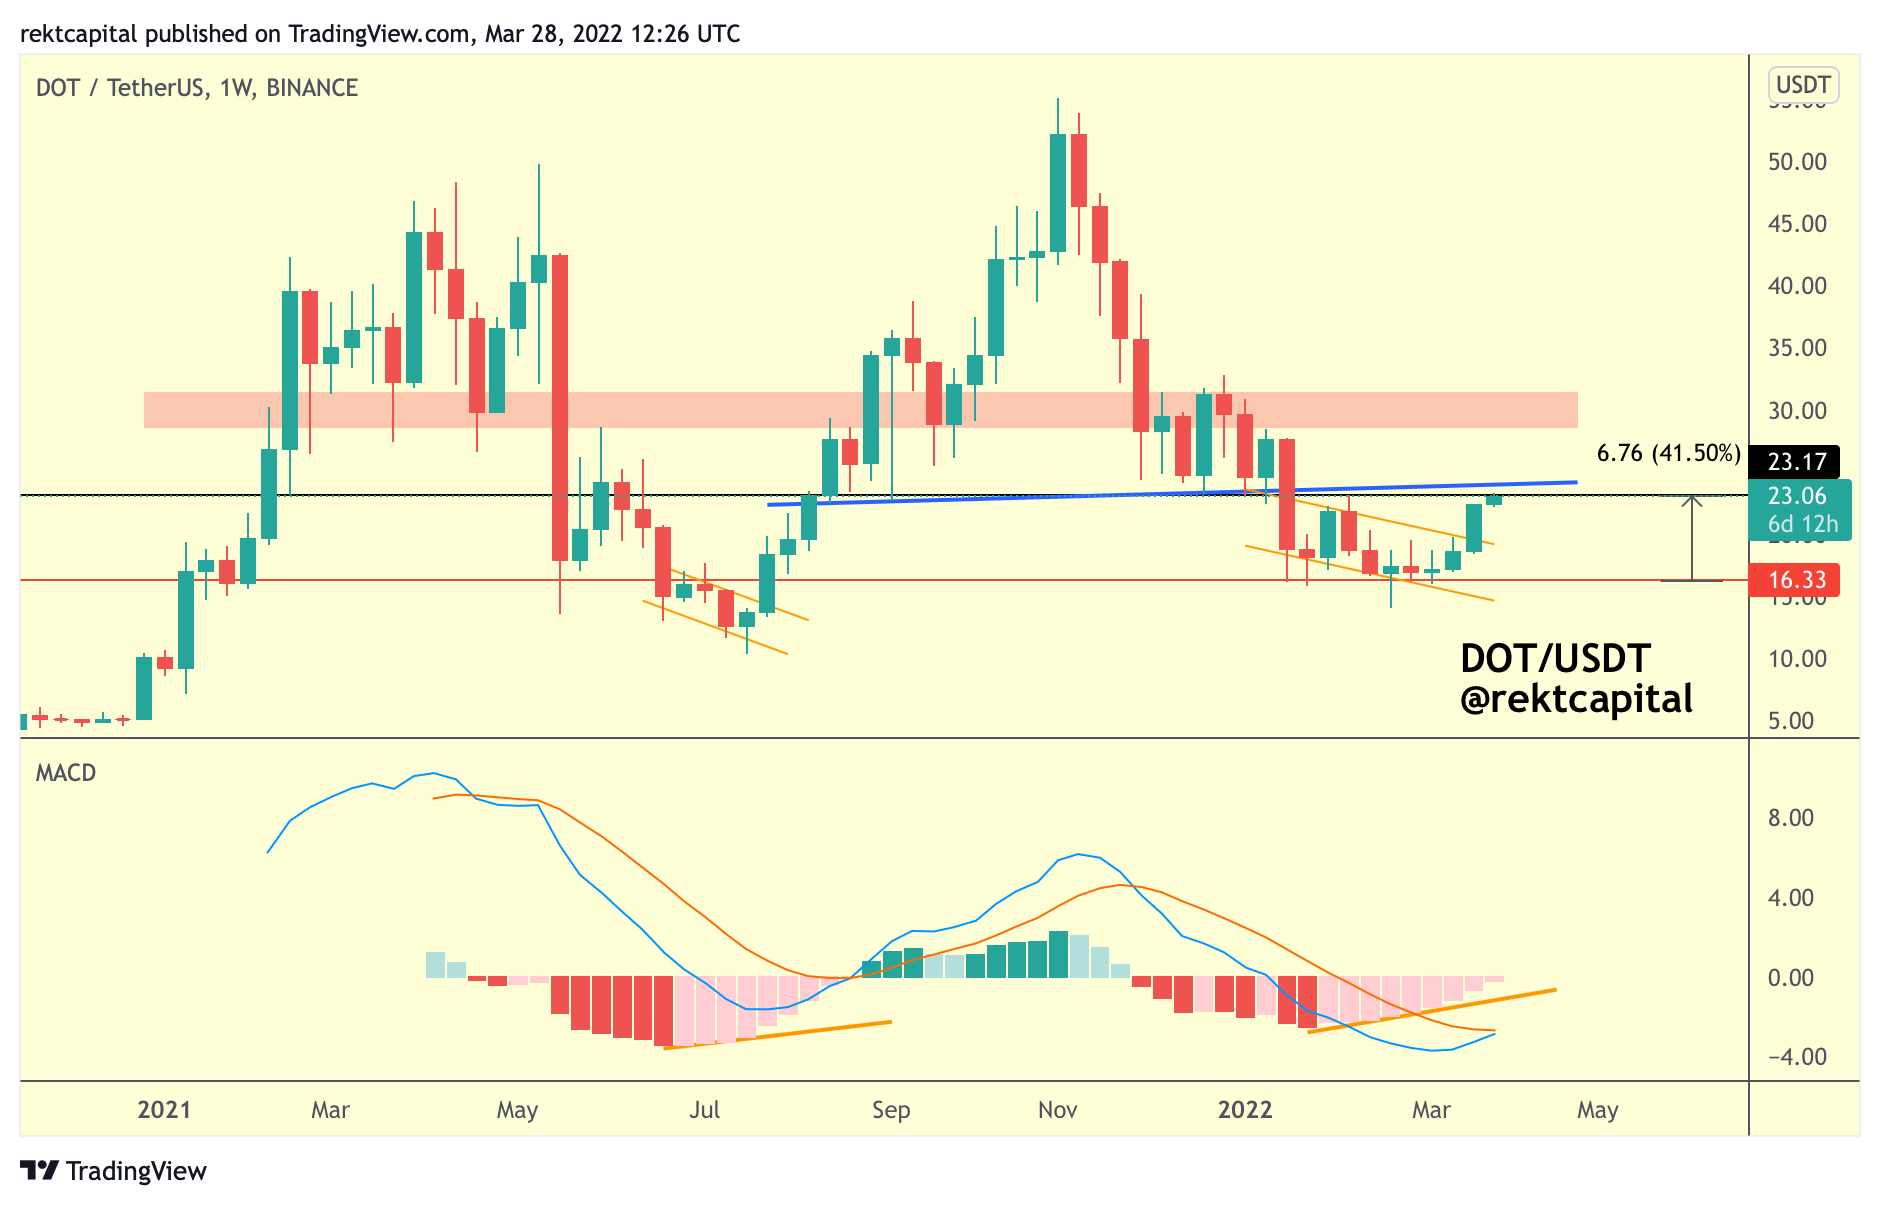
DOT has since curled up into a +41% rally, rallying towards the top of what was a $16.33-$23.17 range (red-black).
This black Range High is also confluent resistance with the blue trendline which was the trendline that DOT broke down from to enter this multi-month sideways consolidation inside the $16.33-$23.17 range (red-black).
Of course, while this confluent Range High resistance may very well figure as a point of rejection, it’s still worth watching for whether by chance DOT will be able to reclaim this area into support.
Doing so would enable DOT To rally to the $30 region (red box).
However, price will continue to consolidate inside the $16.33-$23.17 range (red-black) until DOT is able to reclaim the black $23.17 level as support to confirm a breakout.
Elrond - EGLD/USDT
Earlier this month, EGLD was another Altcoin we paid special focus to:
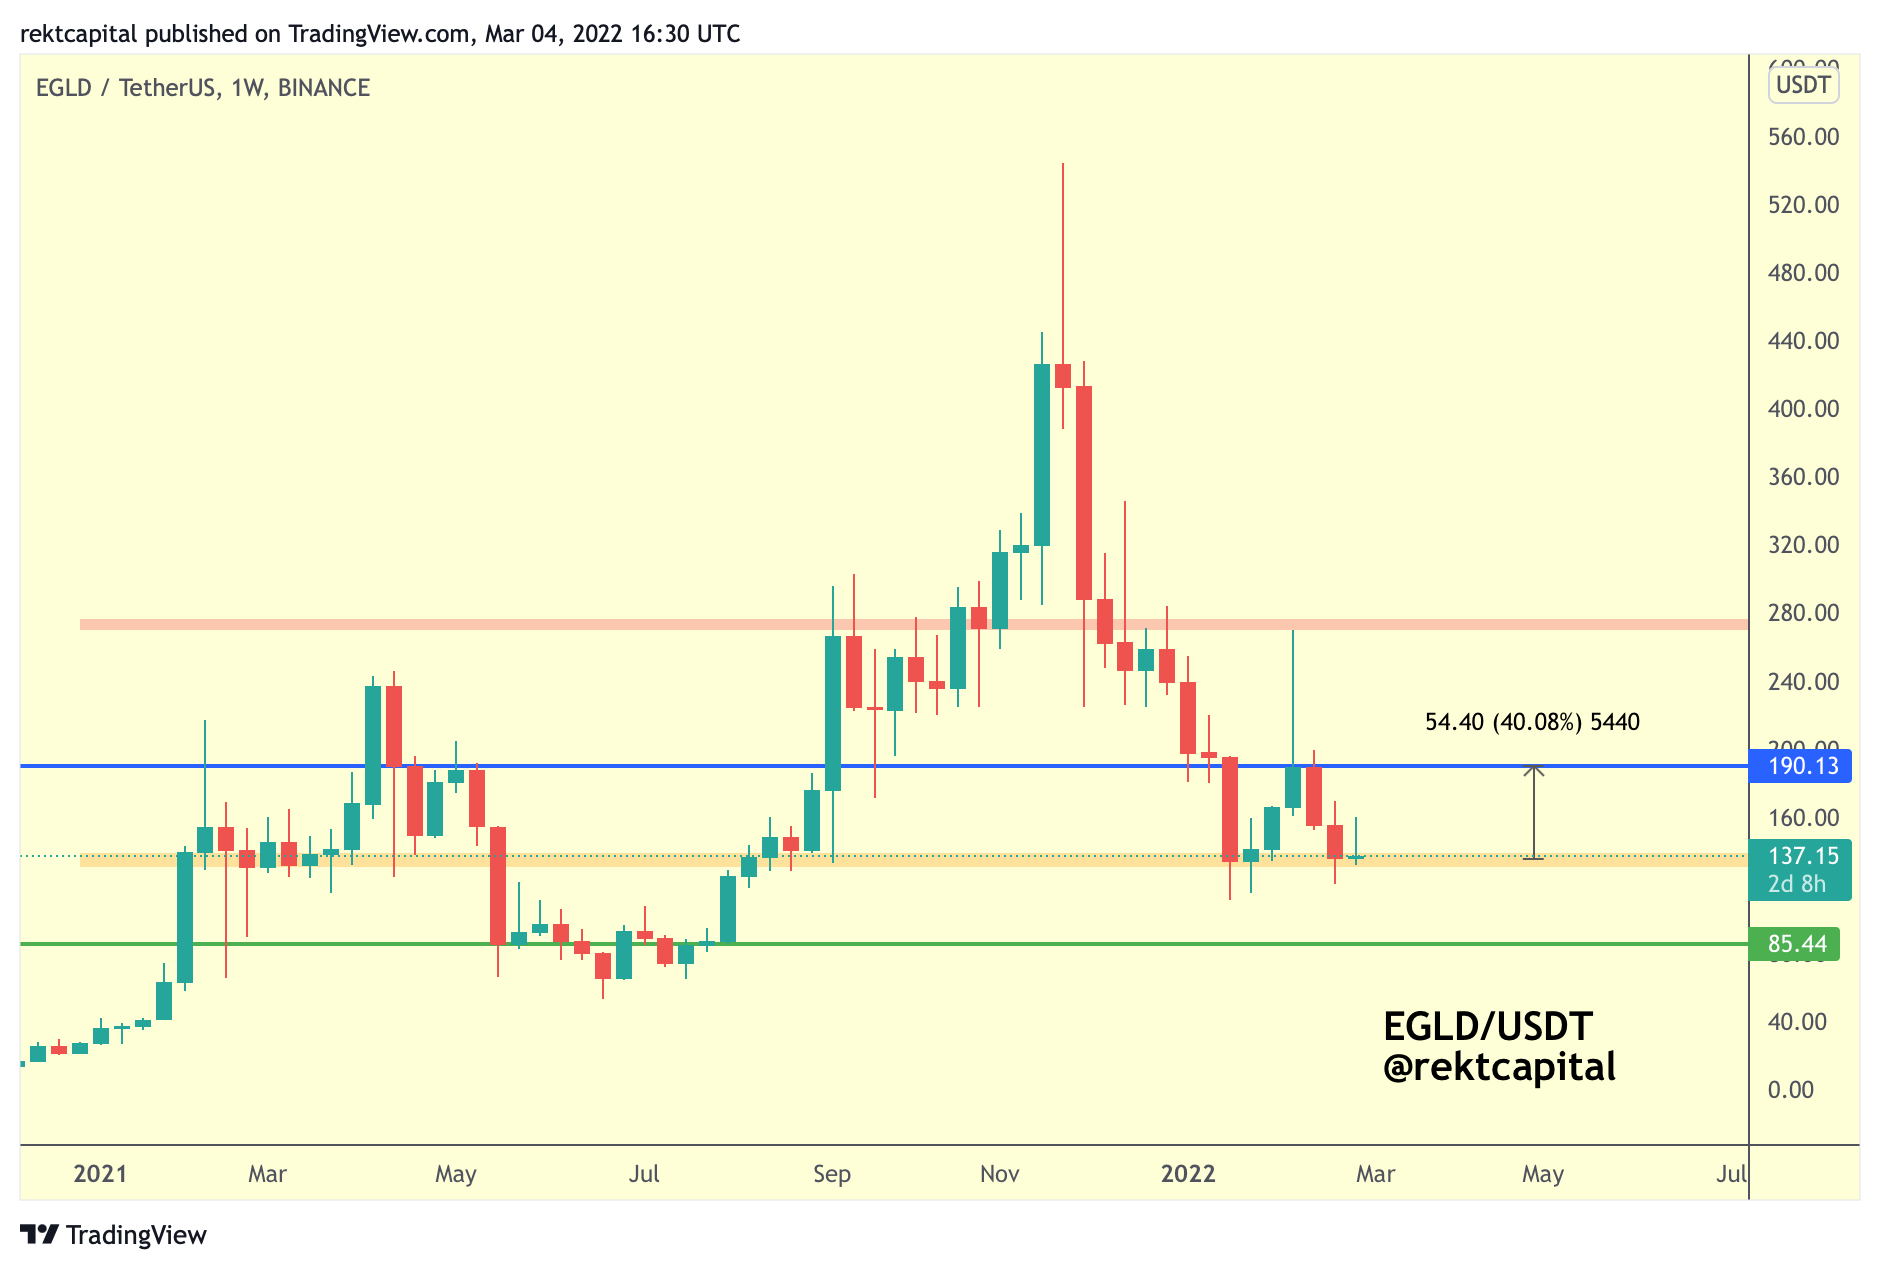
EGLD was in the process of forming a second bottom at the orange support area; successful rebound from here would’ve seen EGLD rally across the entire range to the blue $190 level.
Here is an update:
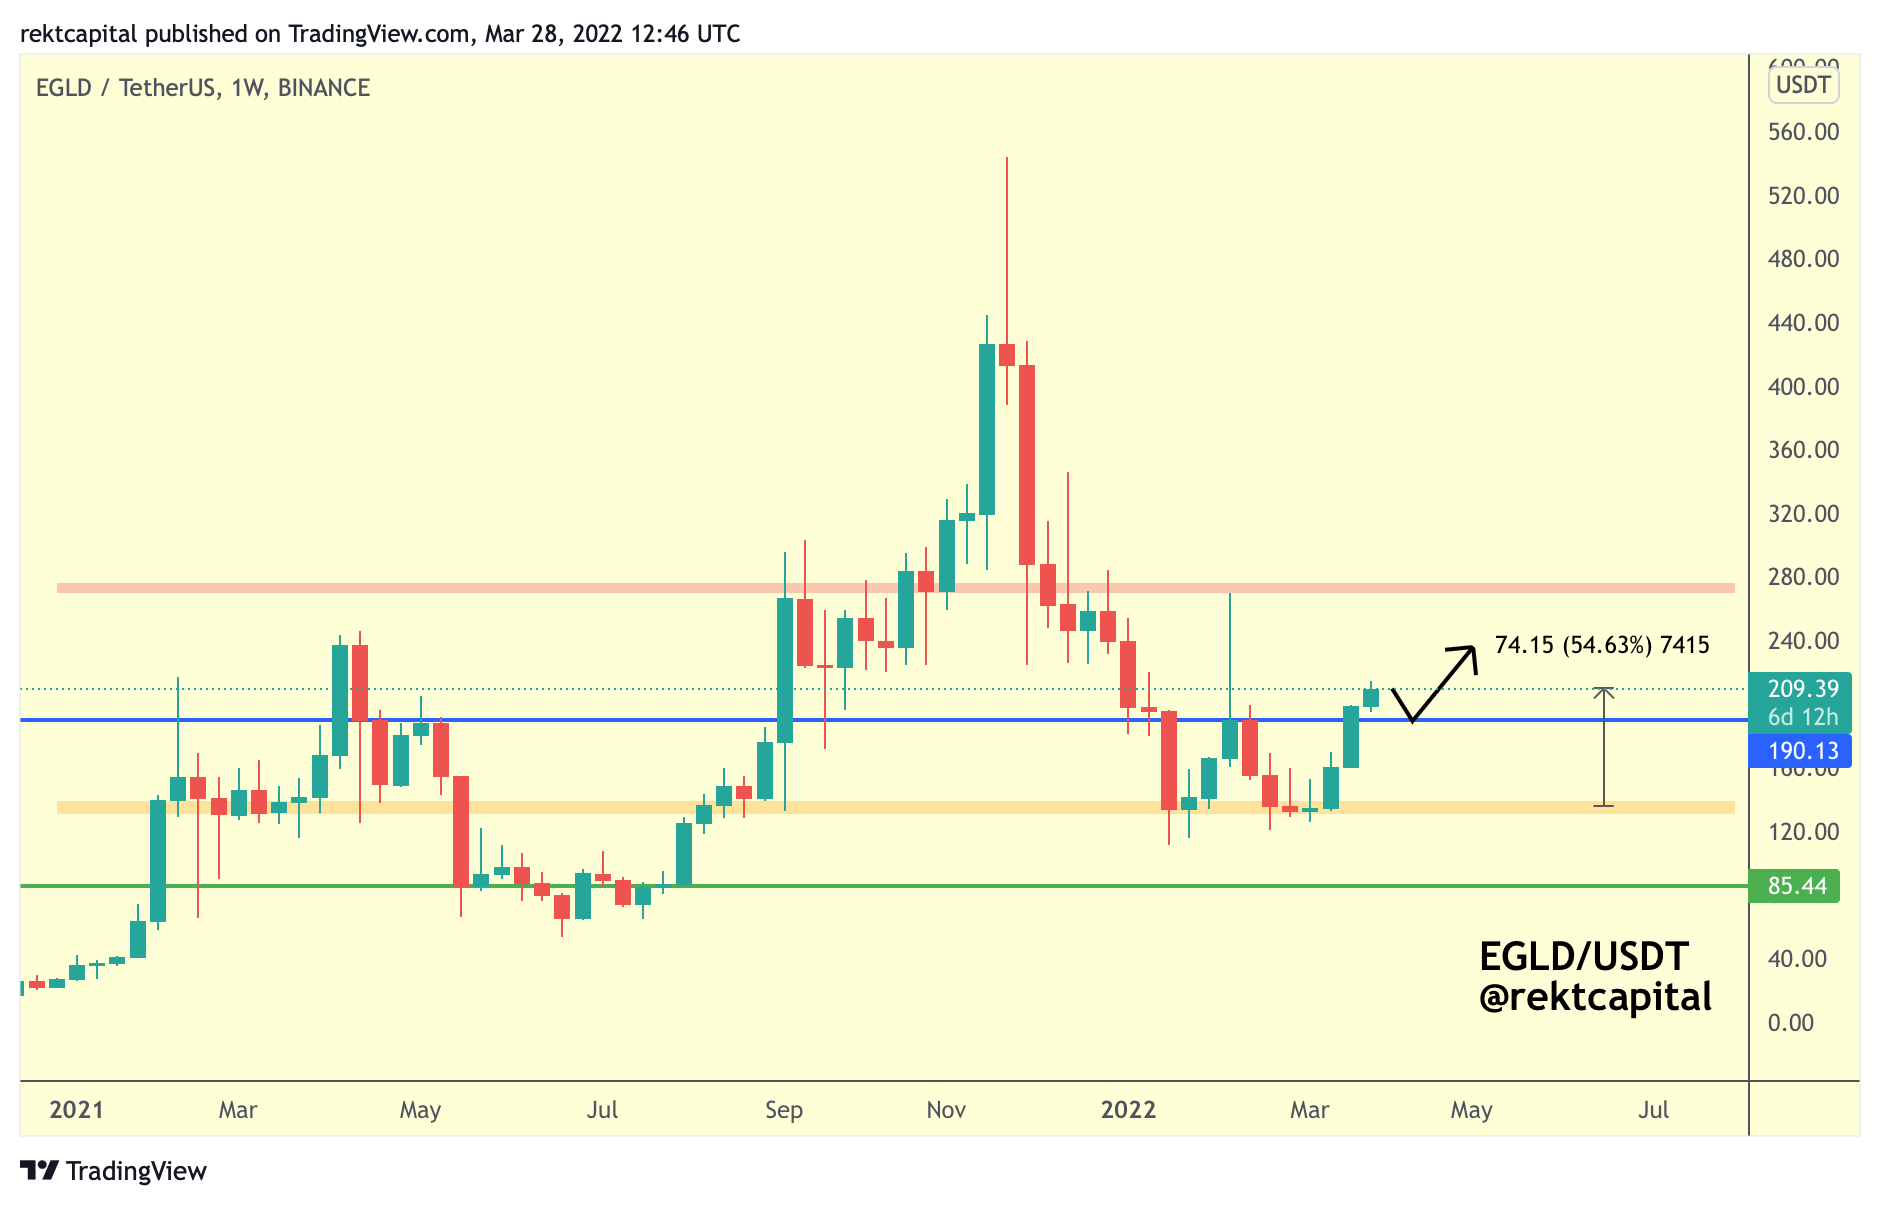
EGLD rallied +54%, fully developing the Double Bottom formation and in fact also breaking out from it.
EGLD could very well now dip into the blue level for a retest attempt to fully confirm the breakout, after which price could rally to the $230 level and even as high as the $270 region (red).
Generally, as long as the blue $190 level holds as support, EGLD will enjoy continuation as a result of its Double Bottom breakout.
Litecoin - LTC/USD
Earlier this March, I mentioned that LTC/USD was forming a Falling Wedge:
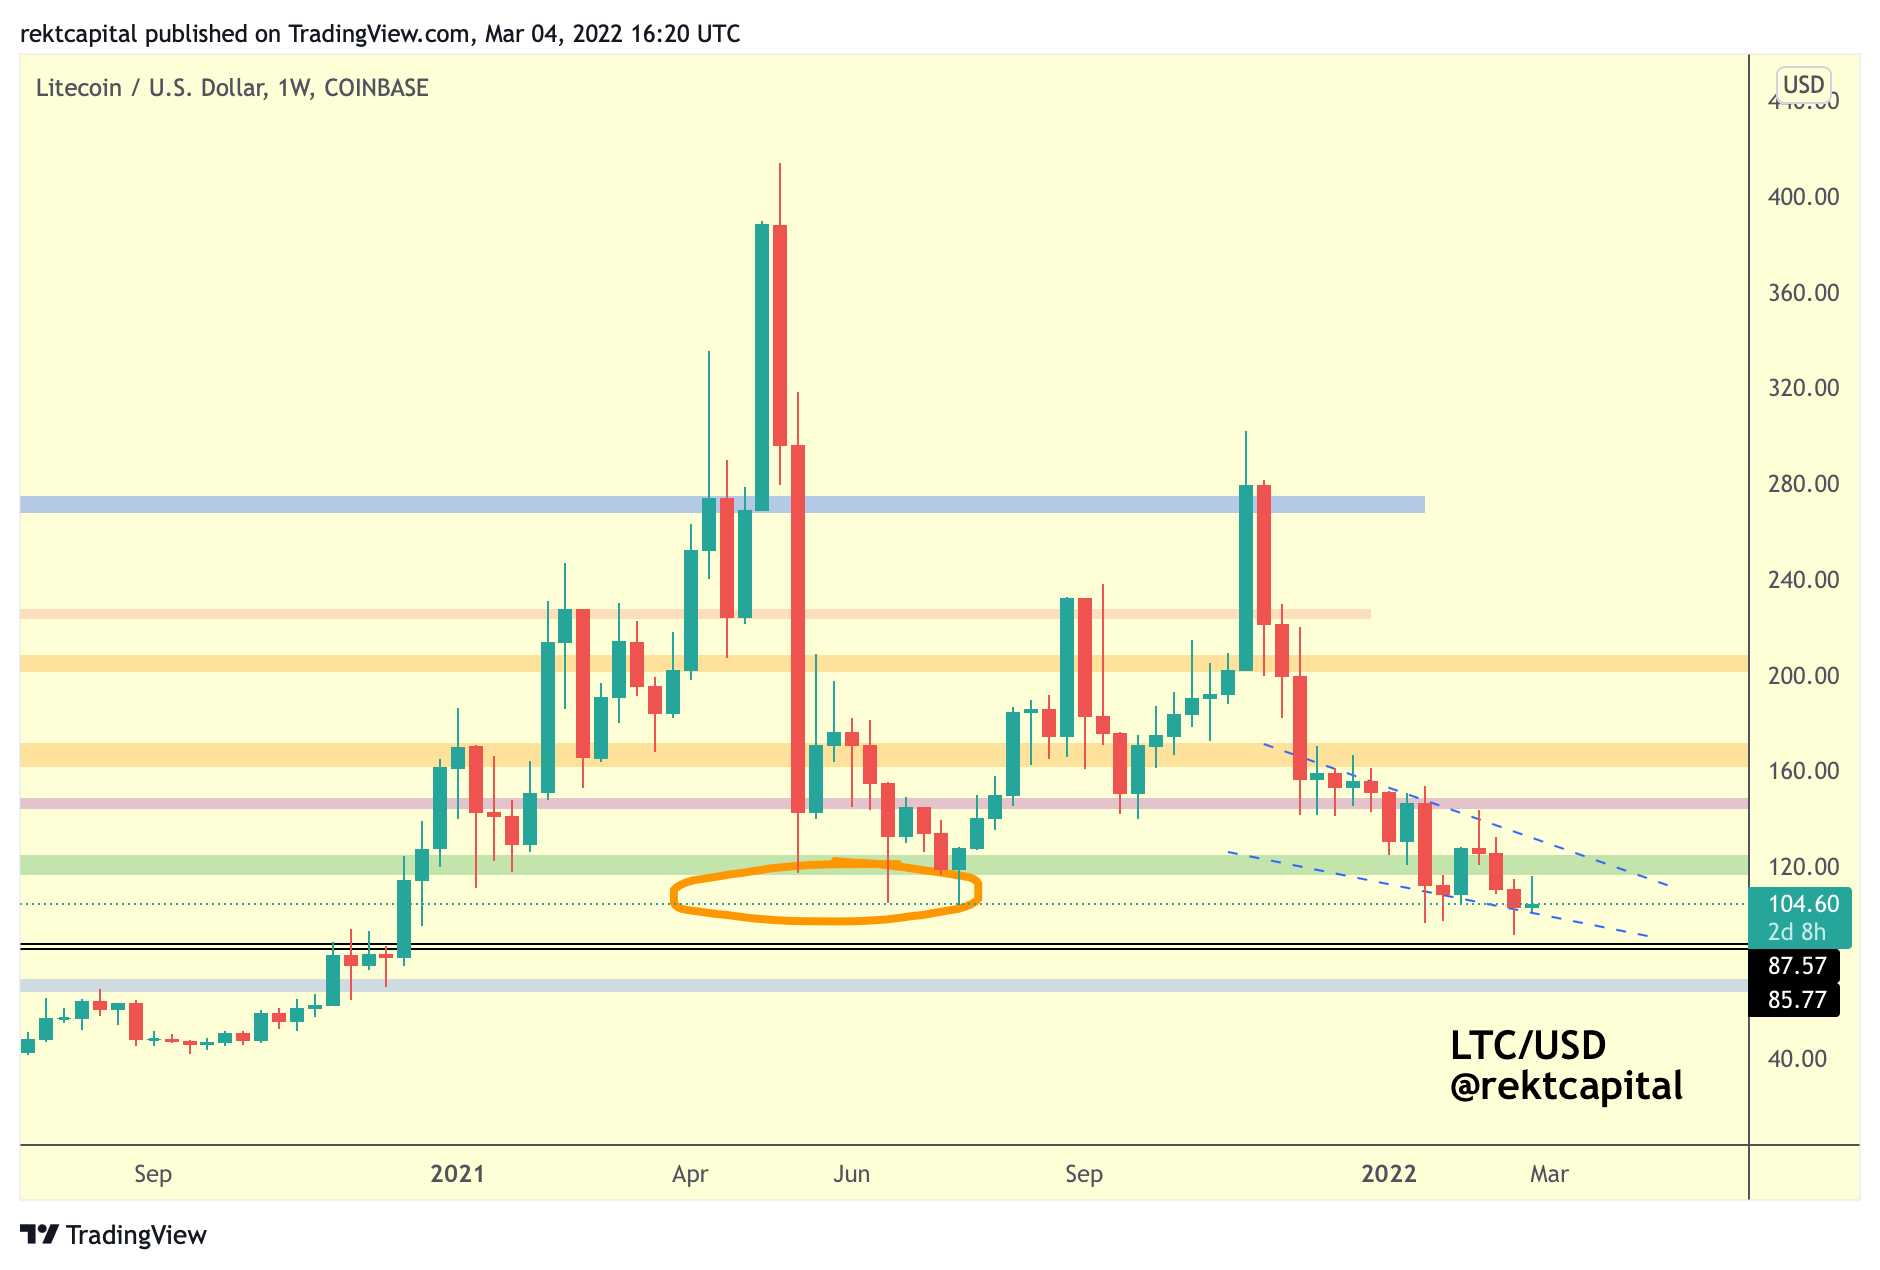
Here is an update:
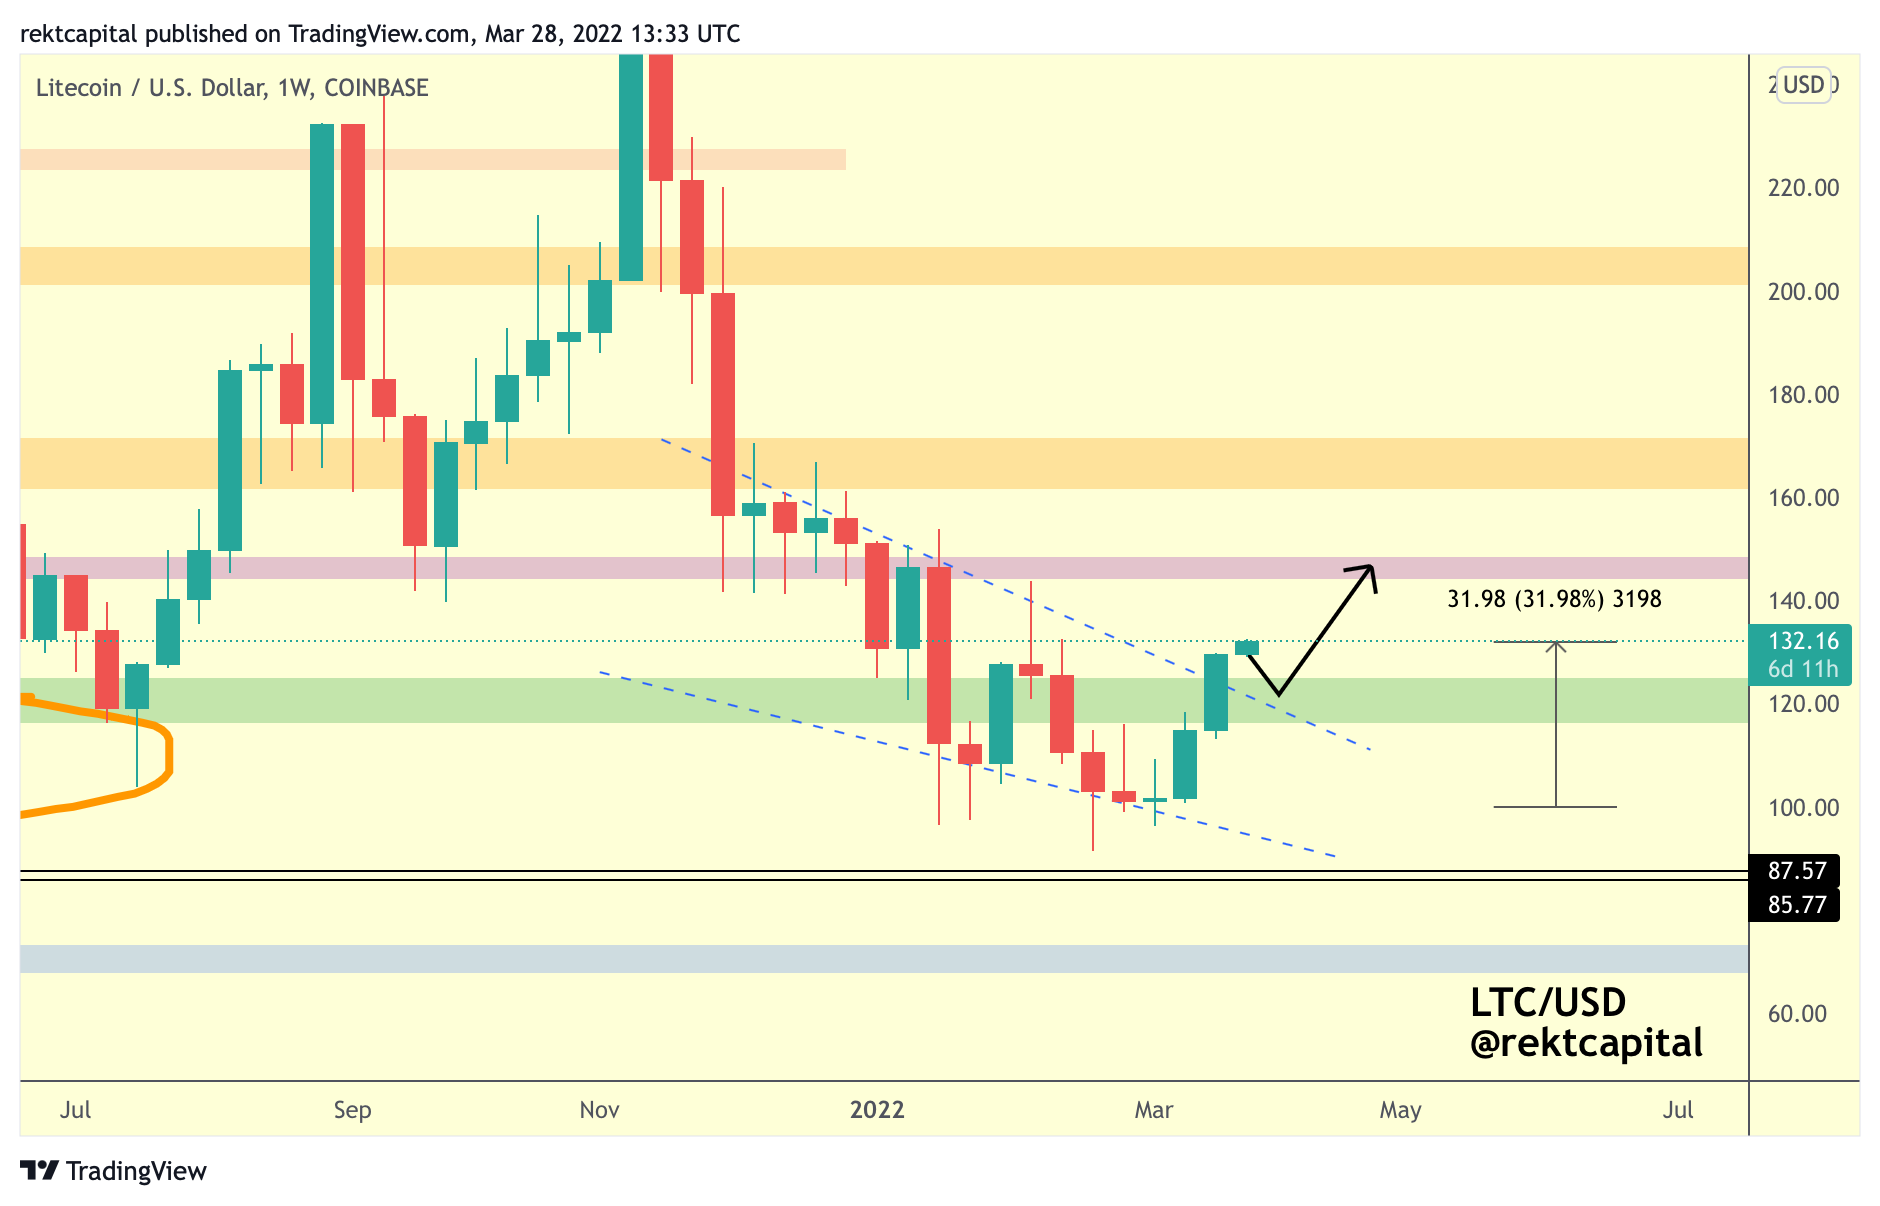
LTC has rebounded from the very bottom of the Falling Wedge and rallied +32%, effectively breaking out from the pattern.
Now LTC has a chance to fully confirm this breakout via a retest of the green area which is a confluent region of support with the top of the Falling Wedge.
Generally, this Falling Wedge breakout has enabled a return into a Weekly range ($120-$148; green-purple).
Therefore, technically, it would make sense to try to a) confirm a post-breakout retest of the Falling Wedge, and b) in doing so, re-affirm the new green Range Low as a support.
Such a turn of events would be healthy and would enable LTC to move towards the Range High of $148 over time.