Where Could Bitcoin Ultimately Bottom?
Worst Case Scenario For Bitcoin On This Retrace...

Welcome to the Rekt Capital newsletter, a resource for investors who want to better navigate the crypto markets with the help of cutting-edge crypto research and unbiased market analysis.
This free edition of the Rekt Capital newsletter is brought to you by… Ledn

Ledn helps you do more with your Bitcoin through their Bitcoin savings accounts, their bitcoin backed loan programme and their b2x programme.
Their Bitcoin Savings Accounts let you earn 9.5% on your USDC and 6.25% on your Bitcoin.
With their Bitcoin Backed Loan programme, you can take out a stablecoin or dollar loan of off your Bitcoin which is much more tax-efficient way to keep your Bitcoin exposure while gaining dollar liquidity.
And through Ledn’s B2X programme, you can double your exposure to the Bitcoin you already own.
Checkout Ledn and do more with your Bitcoin today:
BTC/USD - Bitcoin
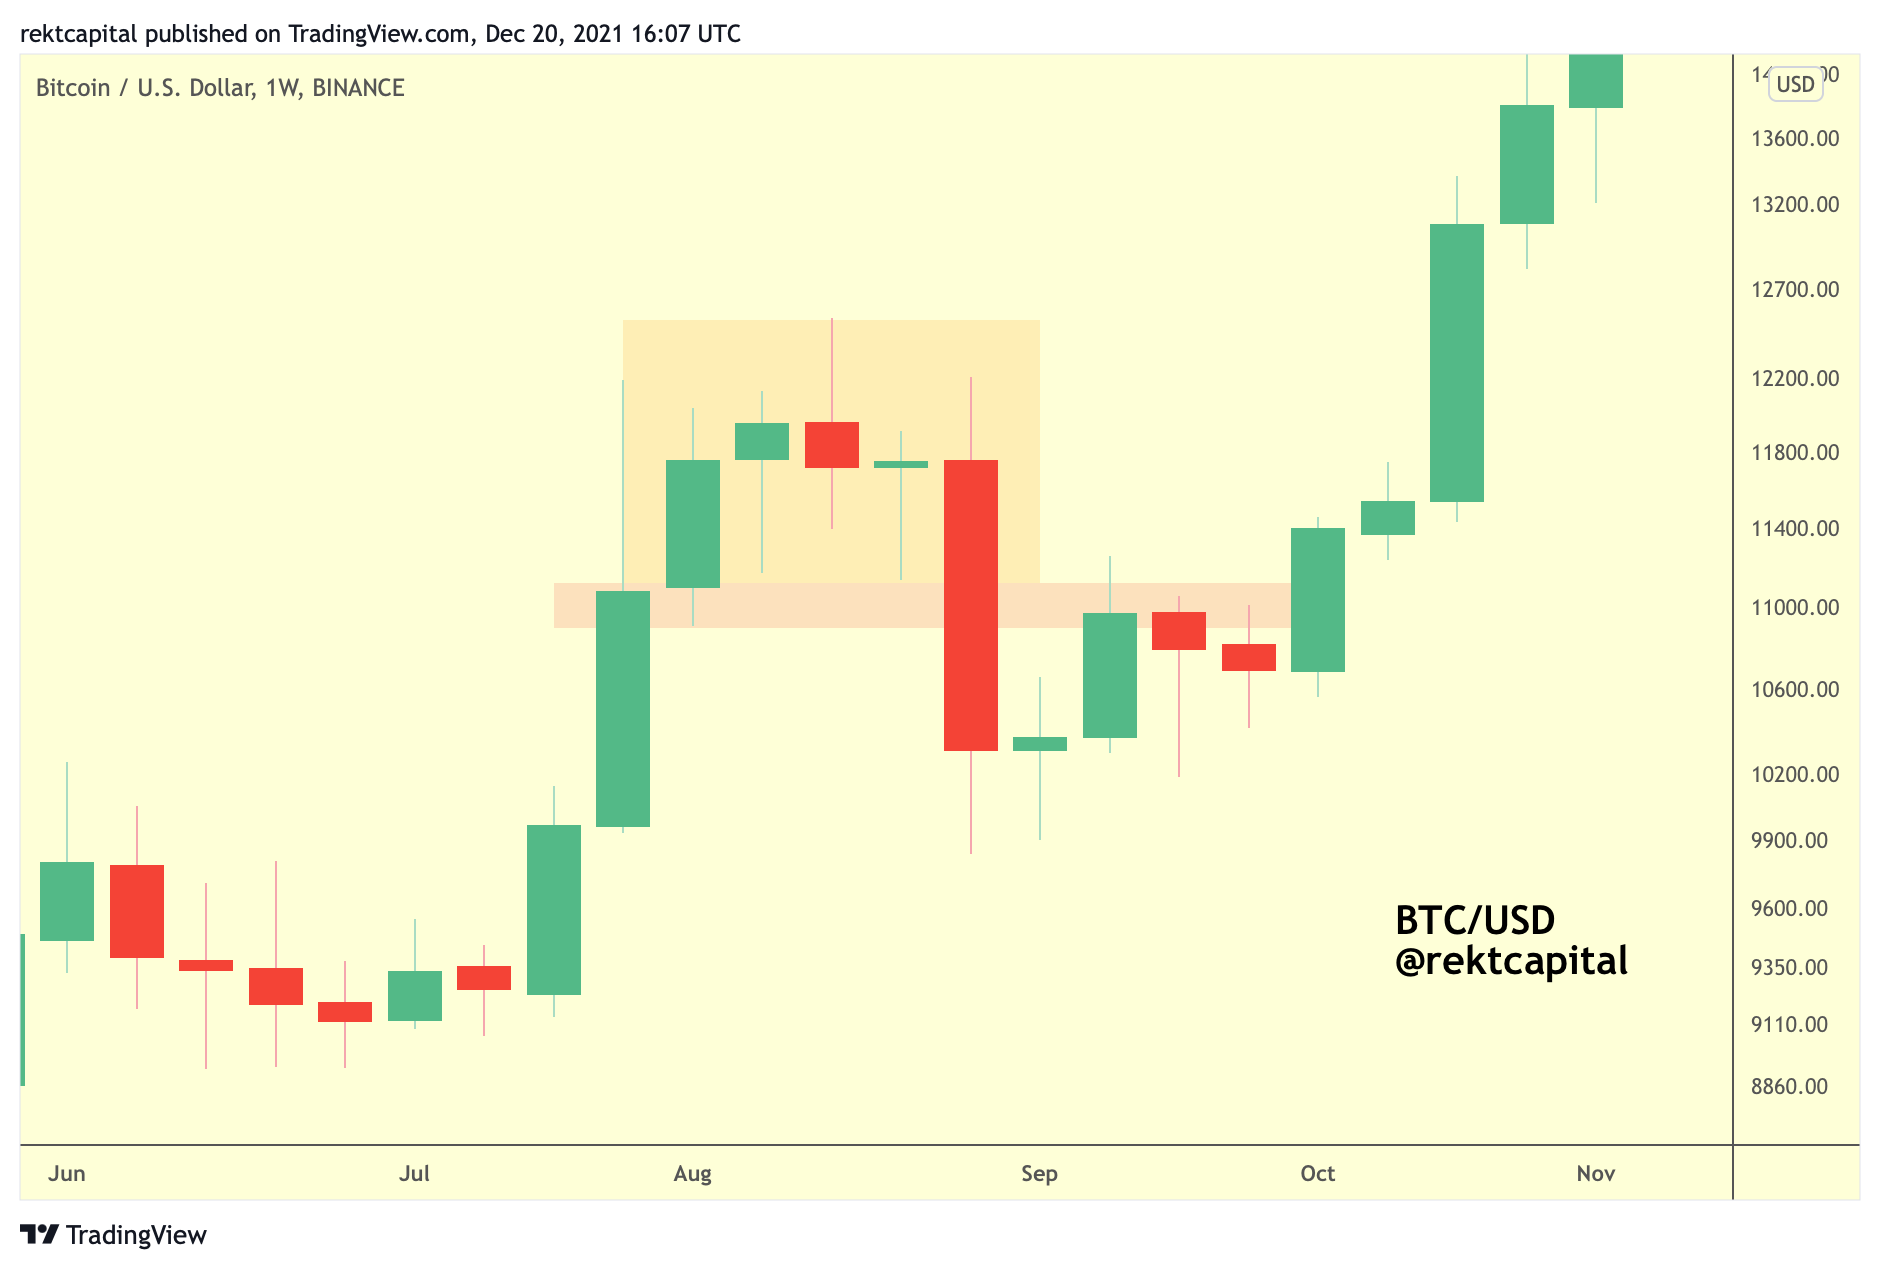
In May 2021, there was lots of talk about a Wyckoff Distribution Range:

The price action in orange resembled pre-Wyckoff Distribution movement, with the red area being the validation point for the actual Wyckoff distribution.
And while BTC broken down from the red area, achieving one form of Wyckoff confirmation - it didn’t flip the red area into a new resistance to achieve the second, more important Wyckoff confirmation.
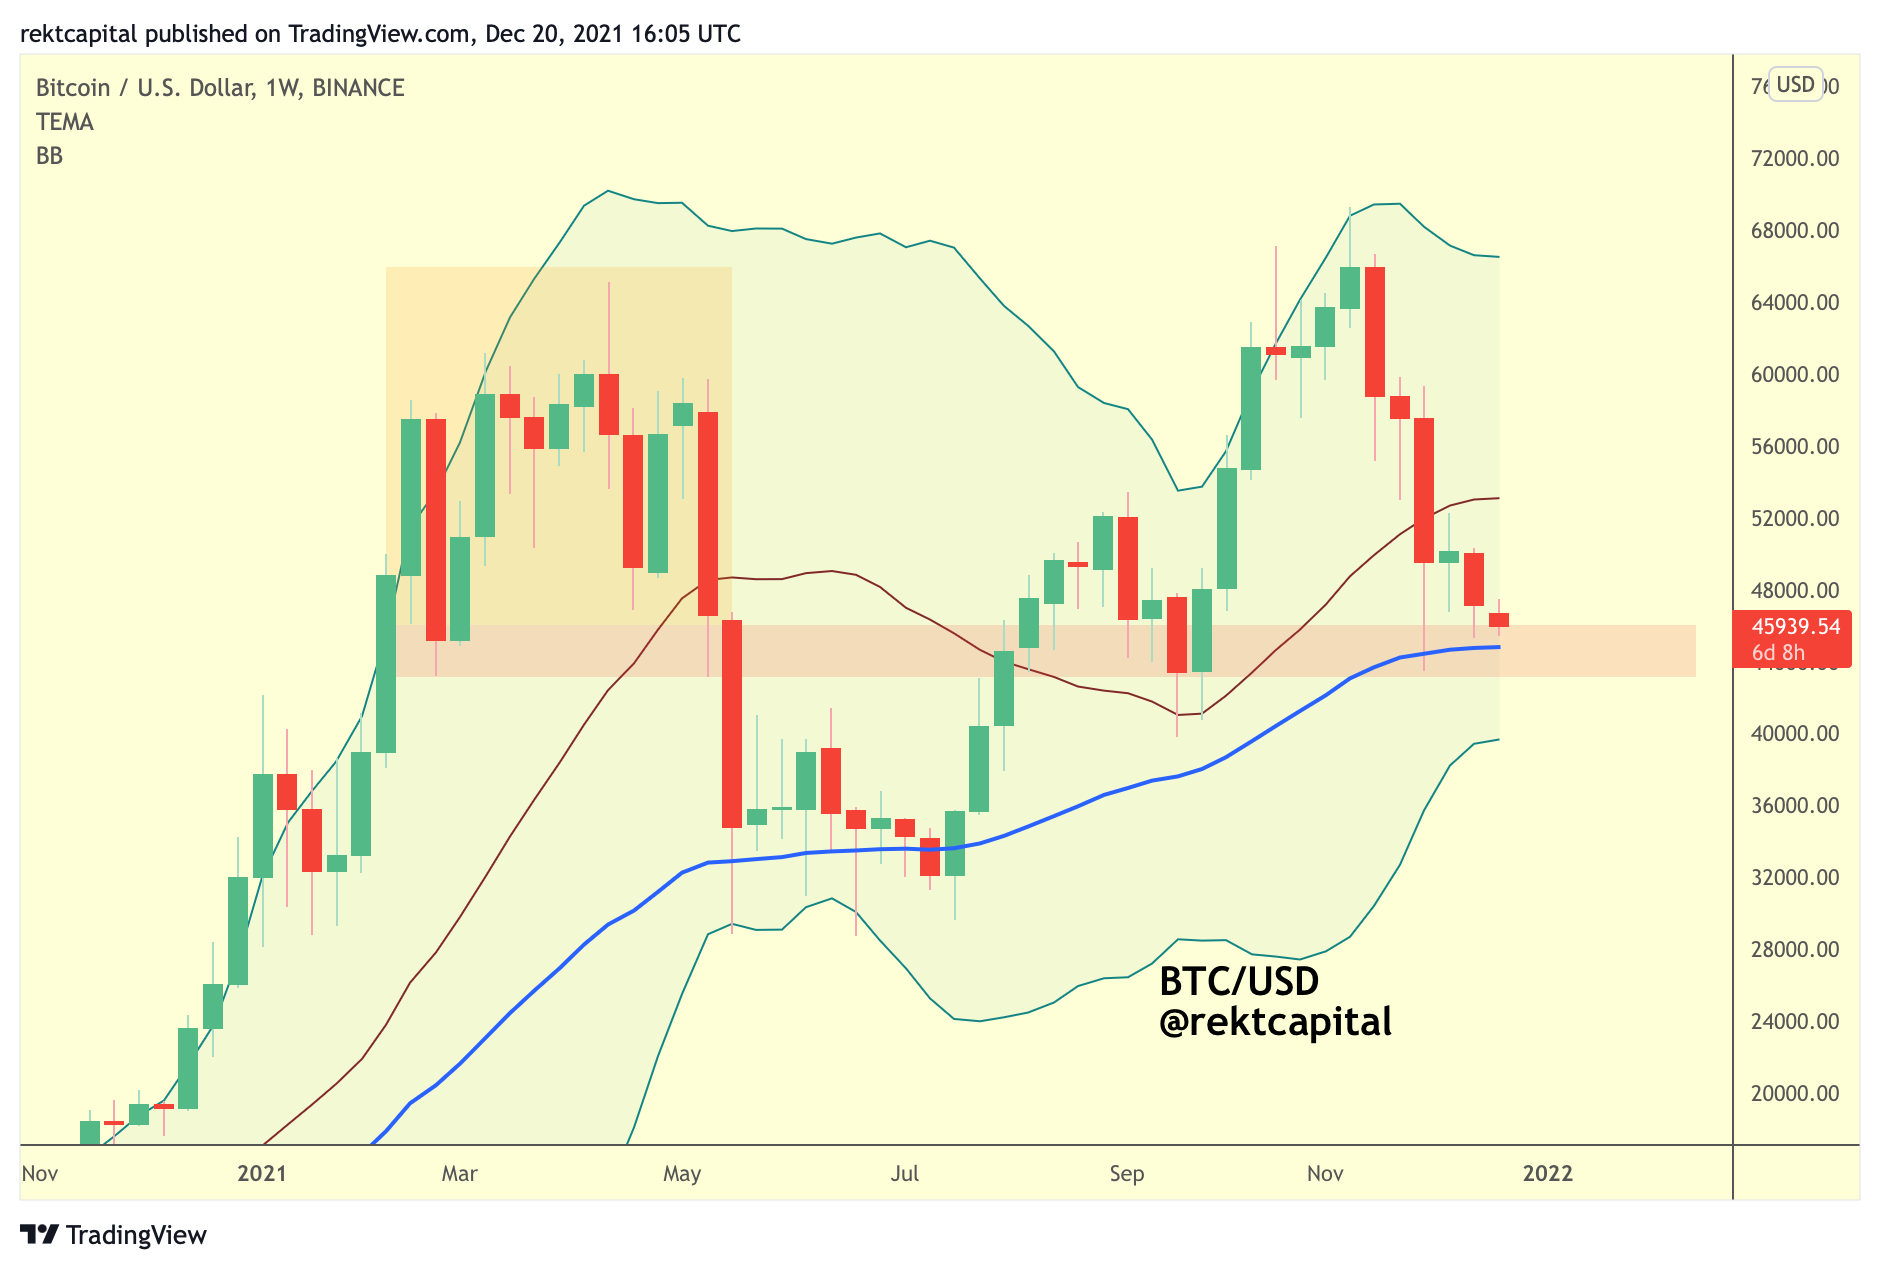
With BTC breaking back above the red area - the Wyckoff Schematic was fully invalidated, an invalidation I’d long suspected:
Because yes - Wyckoff Distribution Ranges precede Local Tops but never actual Market Cycle Tops.
Both May 2021 and even earlier - August 2020 are fantastic examples of this tendency:
Why do I bring up the Wyckoff Schematics?
Two reasons:
Firstly - because of the validation points (i.e. the red areas) and the importance of these areas for Bitcoin’s current price action.
Secondly - because of the important of these validation points relative to macro Bollinger Bands.
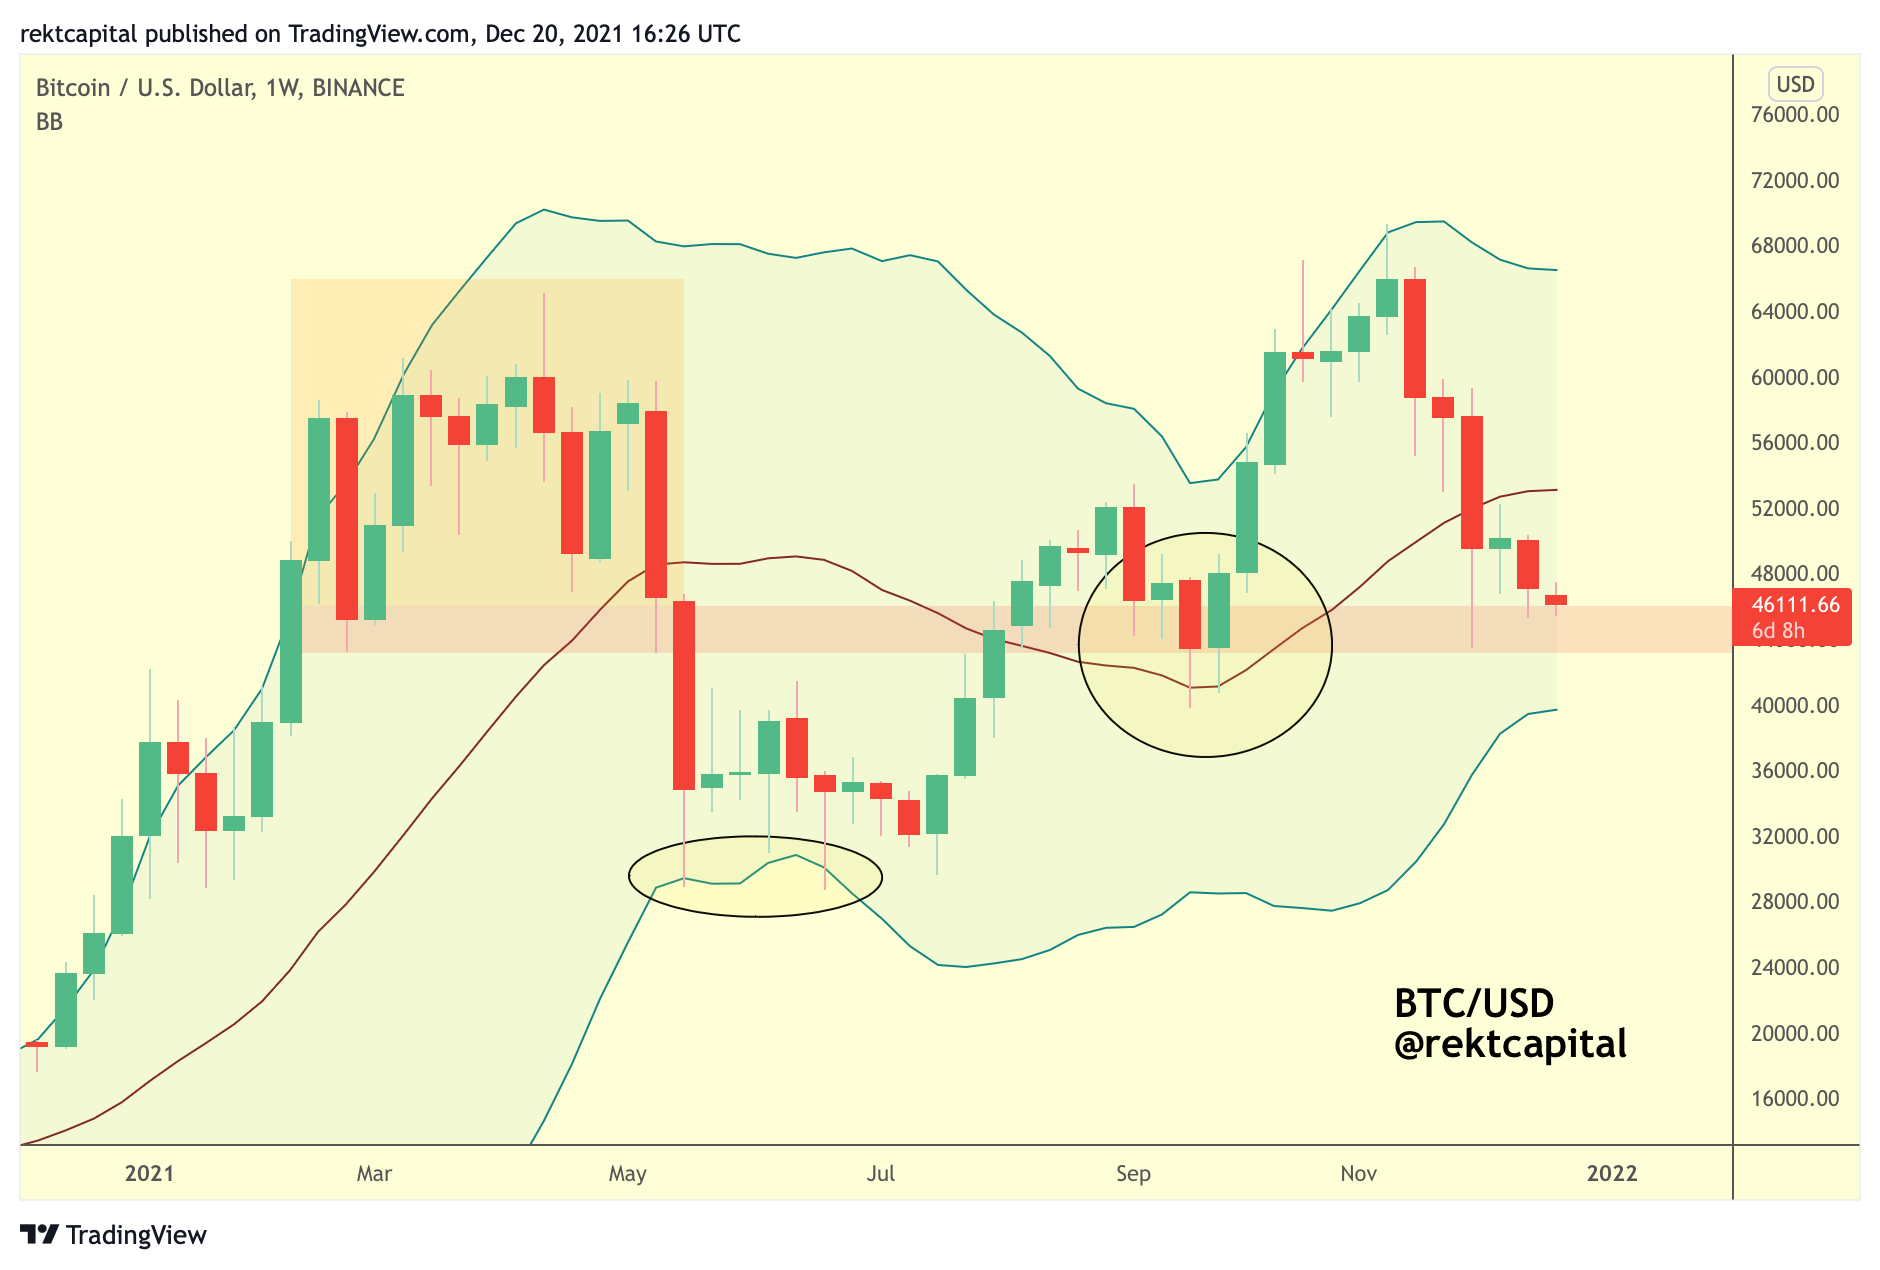
Let’s take a look at the August 2020 period first:
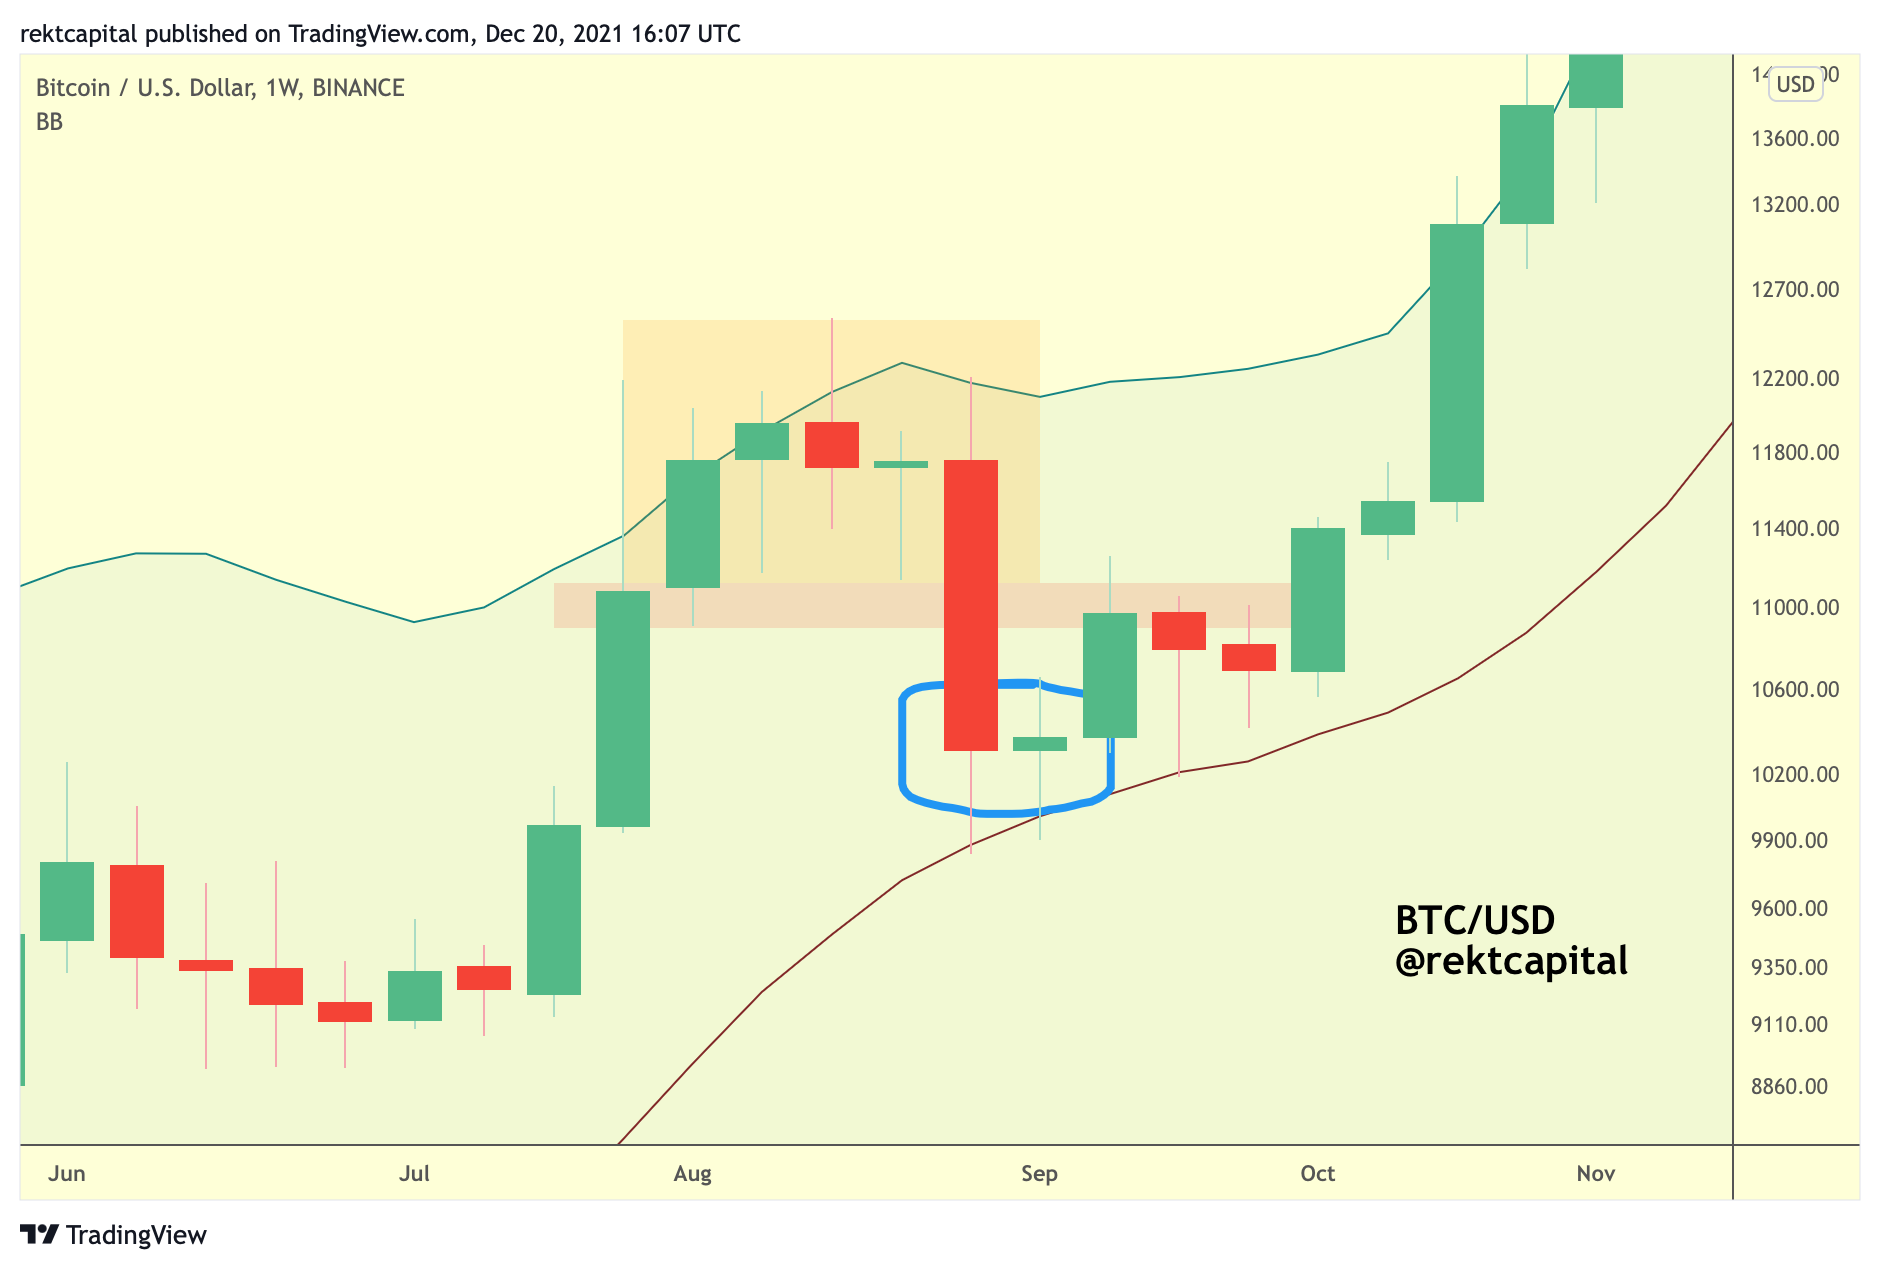
Bitcoin forms its Wyckoffian Local Top at the top macro Bollinger Band but finds support at the brown 20 MA which is the mid-point Bollinger Band.
The red area, which is the validation point of the Wyckoffian Distribution Range, needs to figure as support to facilitate a move to the upside.
So in August 2020, Bitcoin was able to find support at a key Bollinger Band area and also reclaim the key red area as support before moving higher.
Let’s take a look at May 2021 through the same lens.
Bitcoin formed its May 2021 Wyckoffian Local Top at the top of the macro Bollinger Band.
And then found support at the very bottom of the Bollinger Band, which was approximately confluent with the blue 50-week EMA support:
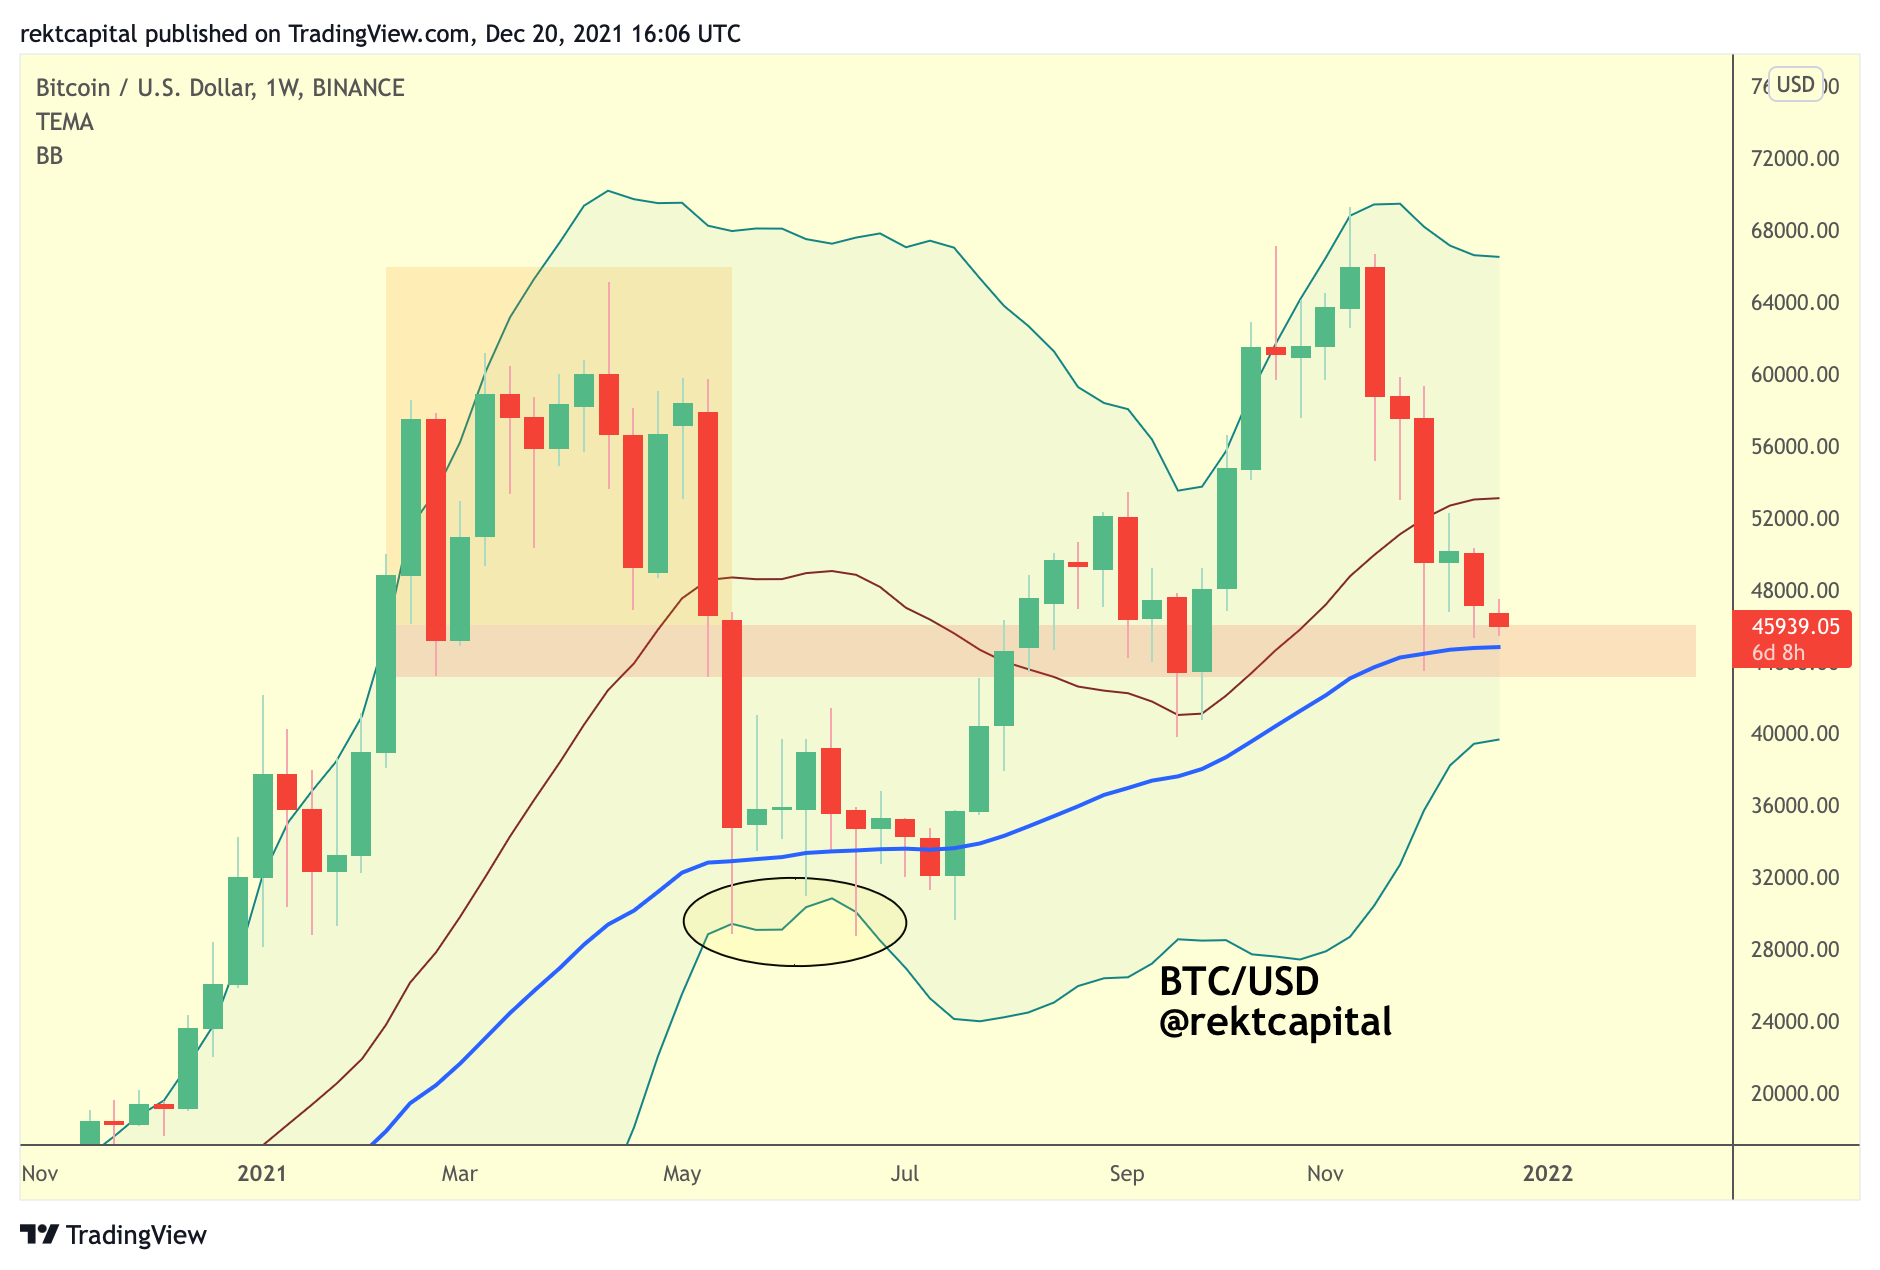
In fact, Bitcoin produced a few volatile downside wicks into the lower Bollinger Band, confirming support there before reversing to the upside.
During the upward ascent, BTC also finally reclaimed the red area as support, which was at that time a confluent support with the brown 20 MA mid-point of the Bollinger Band:
So in a nutshell:
- The top Bollinger Band prompts Local Tops
- Either the mid-point or the lower Bollinger Band prompt Local Bottoms
- The red area needs to be flipped back into support for upside continuation
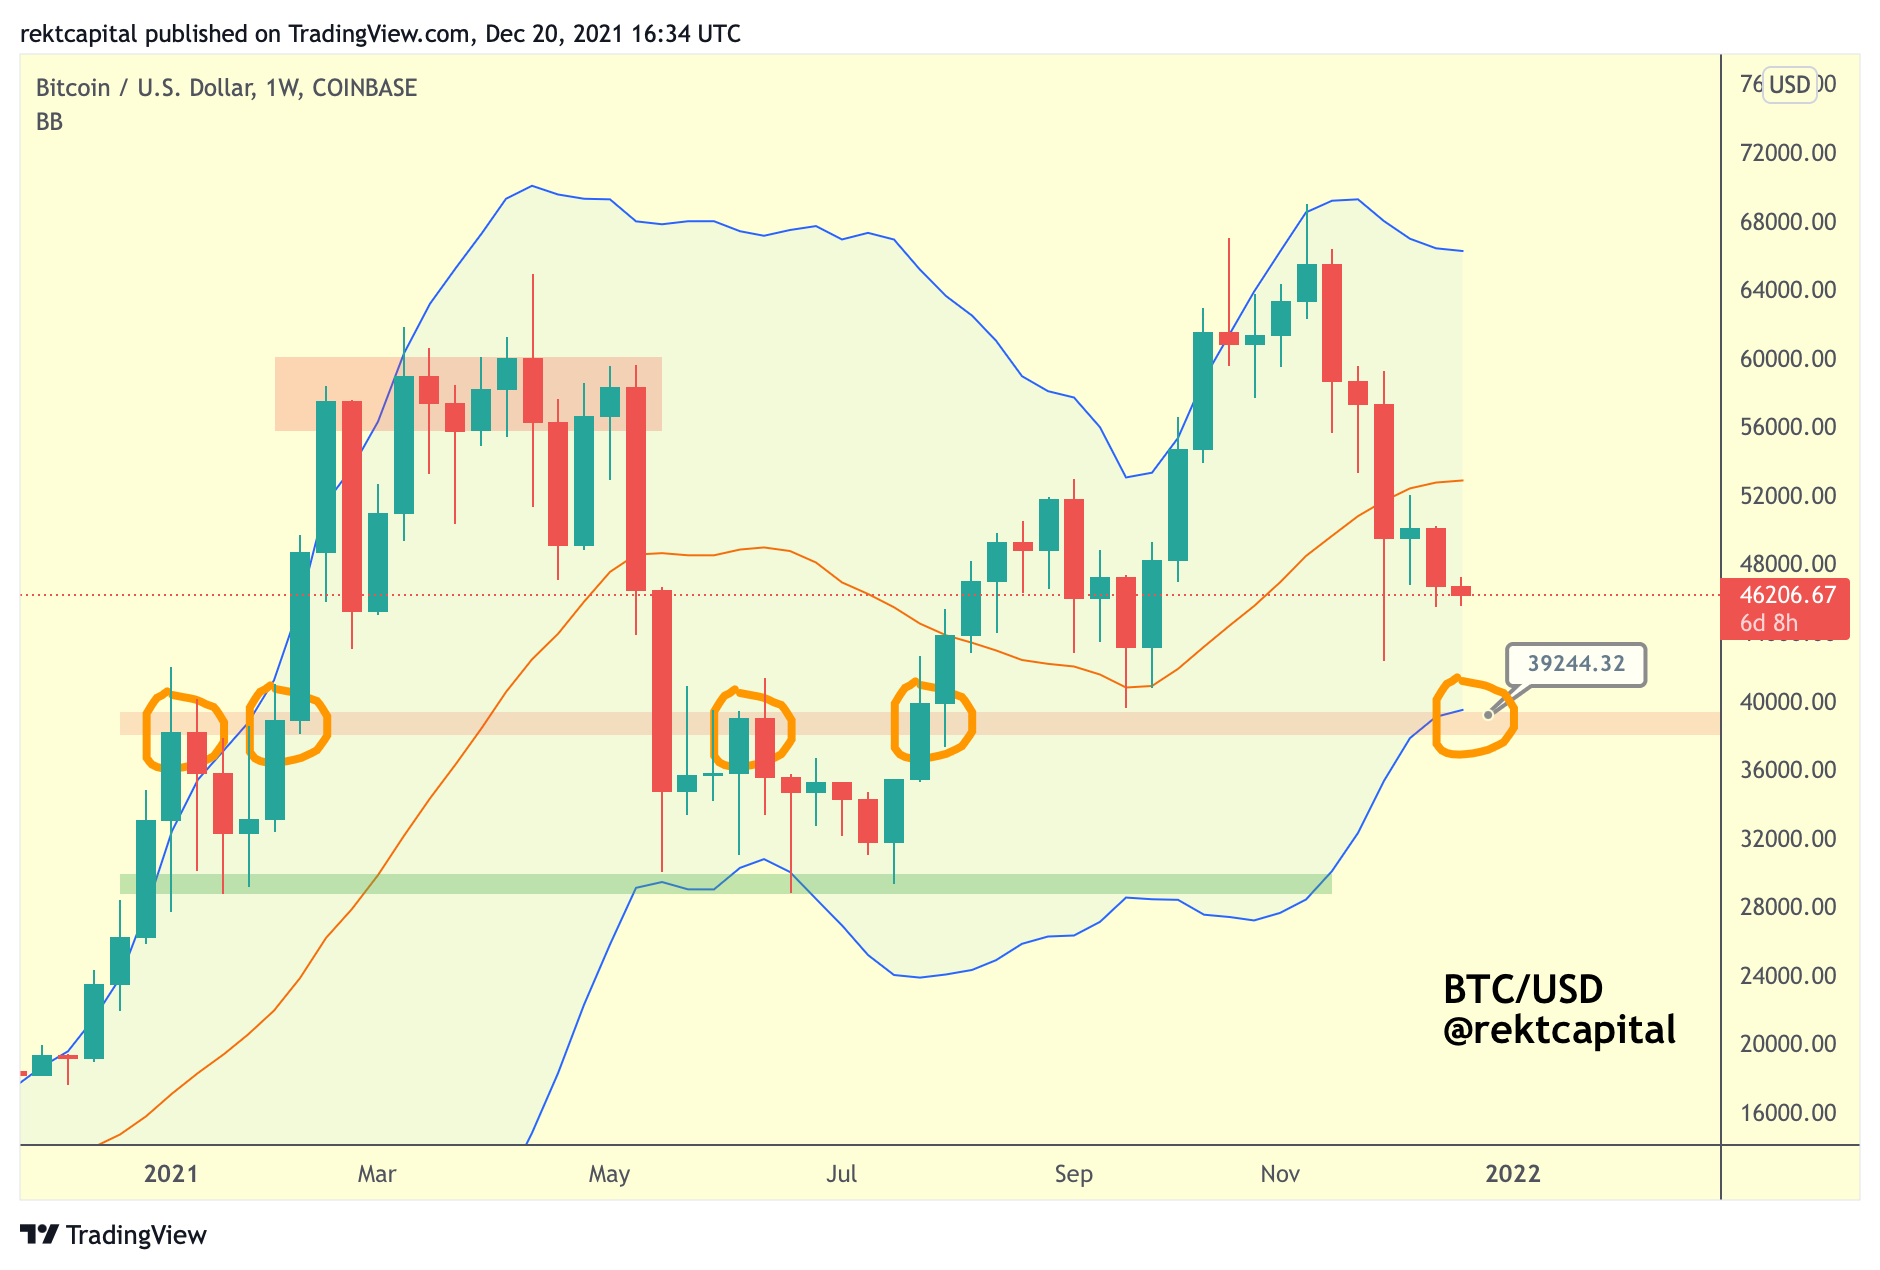
Let’s now take a look at this current period for BTC’s price action:

Bitcoin has now revisited the red area which needs to be held as support for trend continuation.
This red area is a confluent support with the blue 50-week EMA.
It’s important that the red area and blue 50-week EMA hold as support.
However, if the red area and blue 50-week EMA are lost as support - that wouldn’t be the end of the World. Because these have failed as support before.
What needs to be mentioned here is that it’s fine if the red area is lost as support and the 50-week EMA sees a fake-breakdown to the downside as long as BTC revisits the bottom Bollinger Band to confirm a bottom there and reverse to the upside:
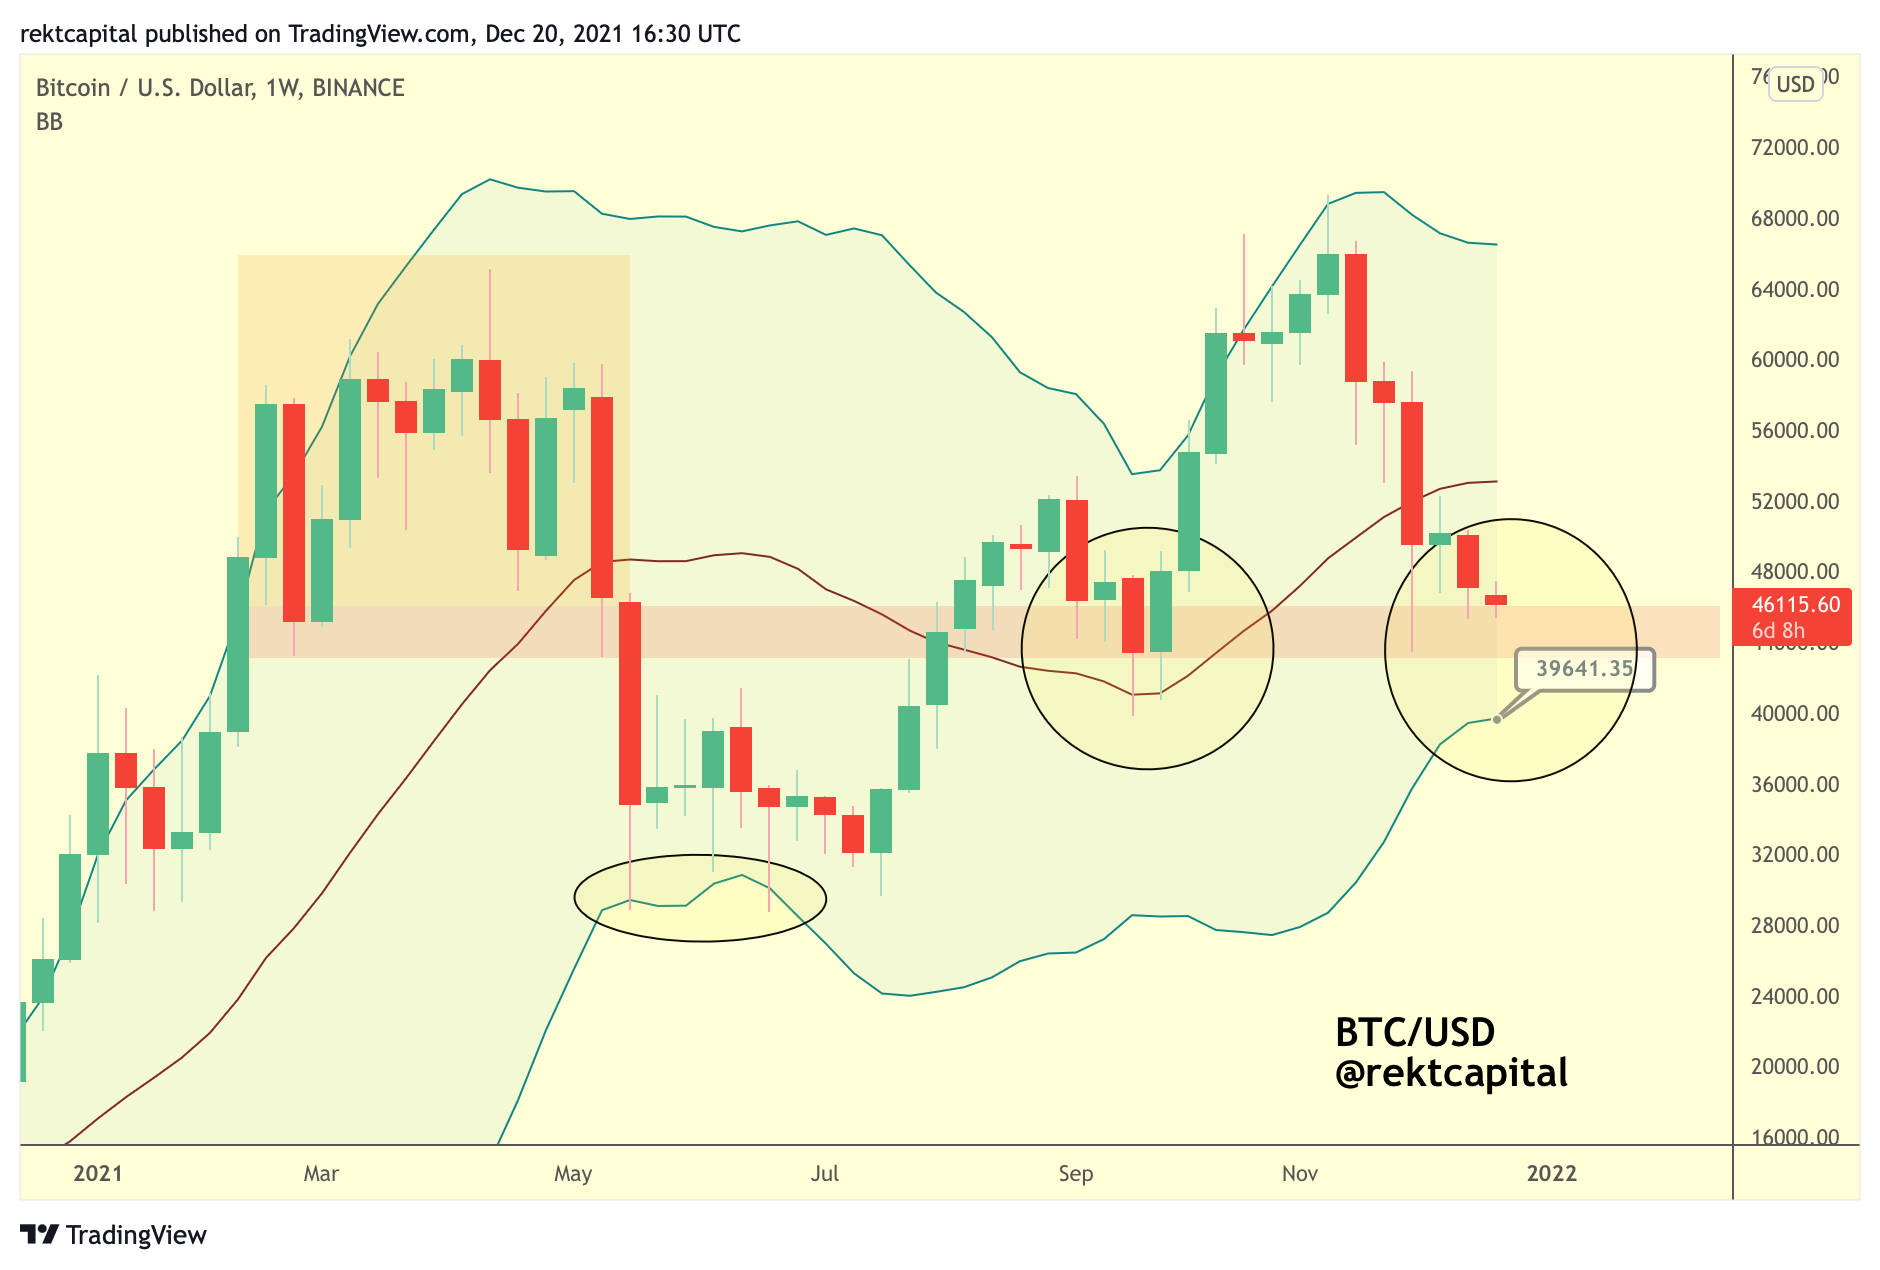
If the bottom is not finally confirmed to be in at ~$42,000…
I feel Bitcoin could see a final retrace to as low as the bottom Bollinger Band to ultimately exact a bottom for Bitcoin.
The lower BBand represents the price point of ~$39,650.
Interestingly, the bottom of the BBand also denotes a key macro Re-Accumulation range for Bitcoin (i.e. $28000-$39000):

Earlier this year during the middle of this year - BTC would consolidate inside this range, only to finally break beyond $39000 and turn it into a support before moving higher.
If BTC were to revisit the lower BBand, then BTC would exact a successfully retest of this $28000-$39000 Re-Accumulation Range and finally move higher.
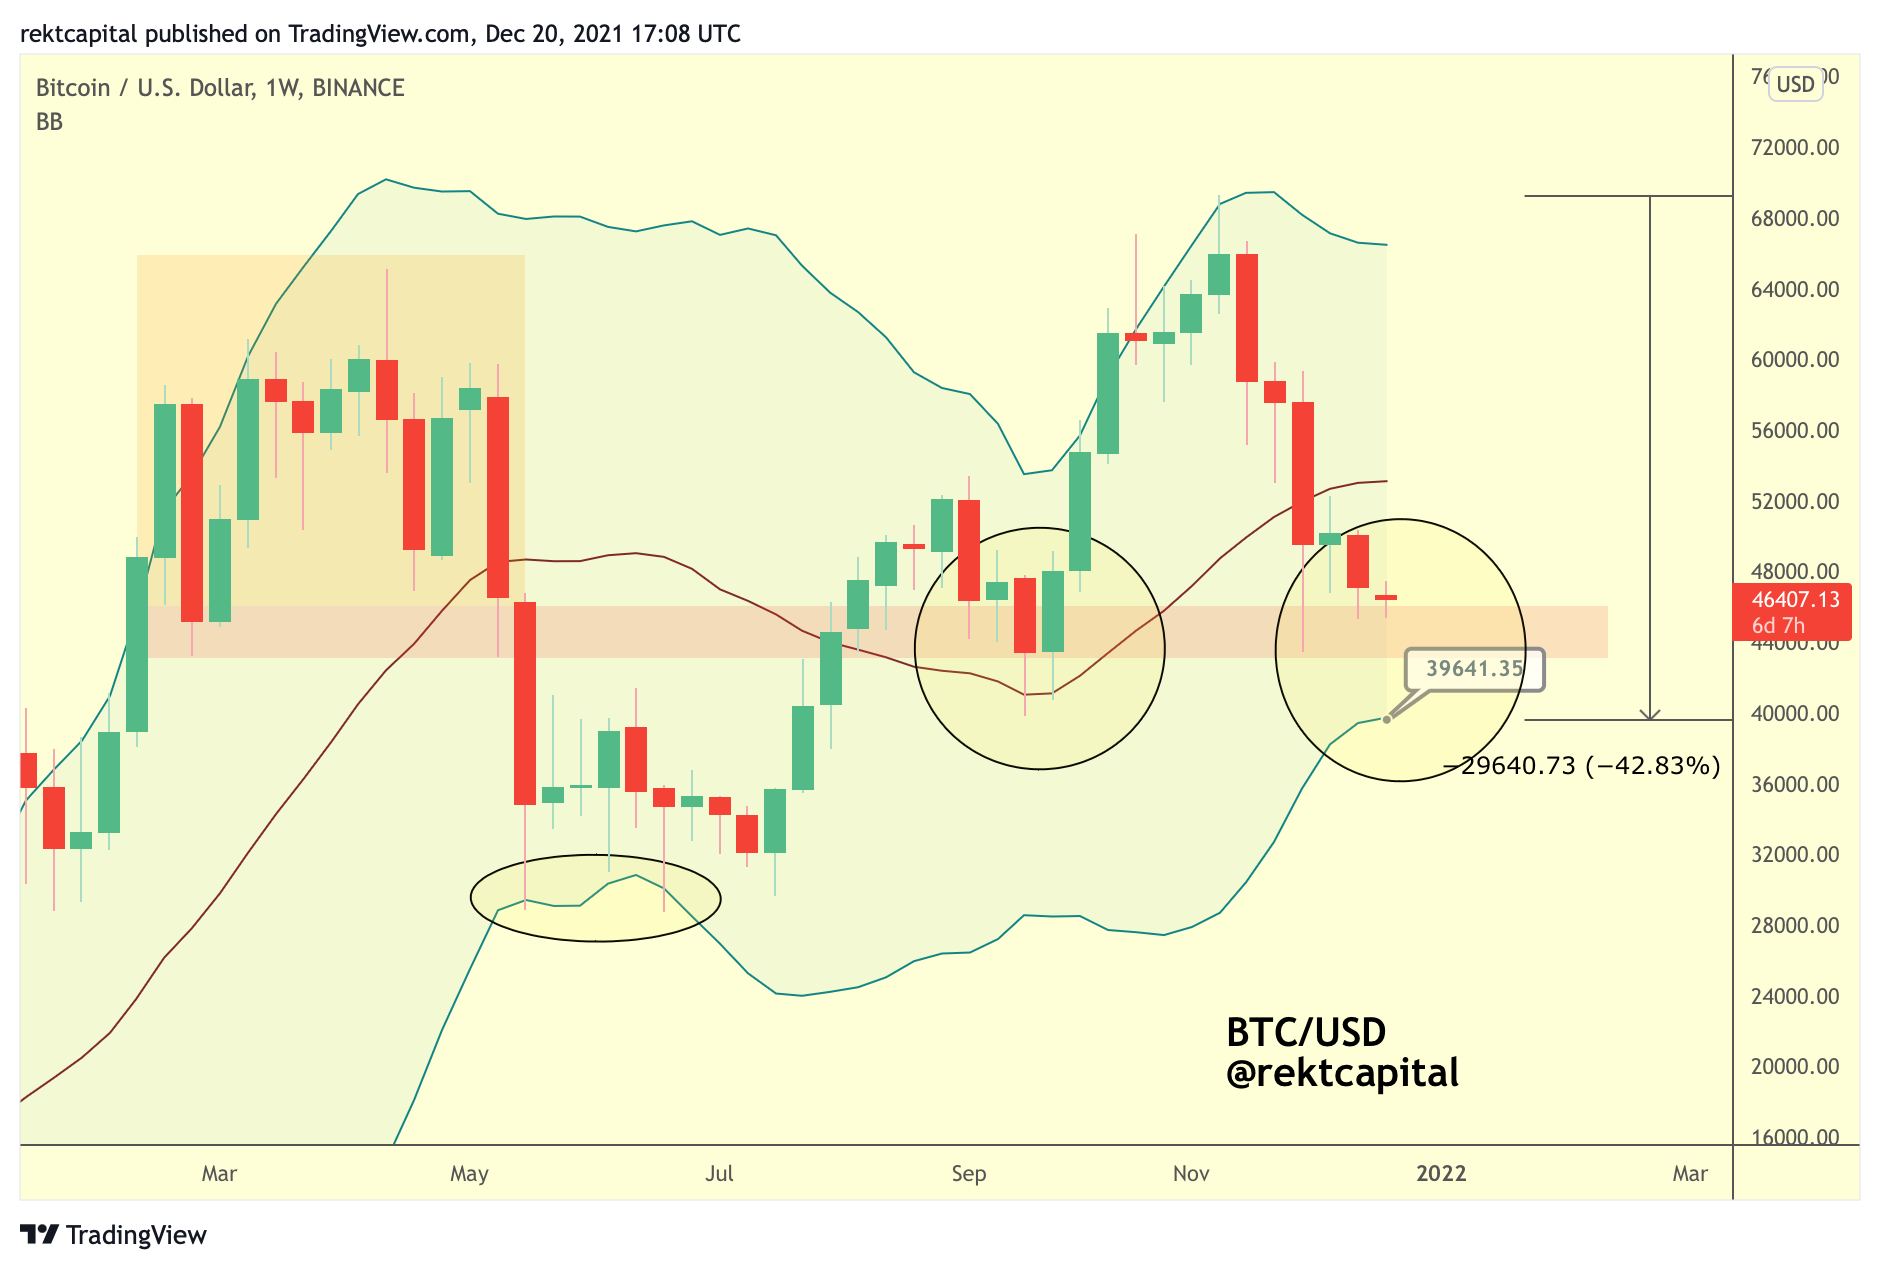
In my view, this could be the worst-case scenario for Bitcoin on this retrace, but for this to be possible - the $42000 support would need to first be lost.
The Bitcoin Logarithmic Growth Curves also, theoretically, allow for this scenario, under a few conditions:
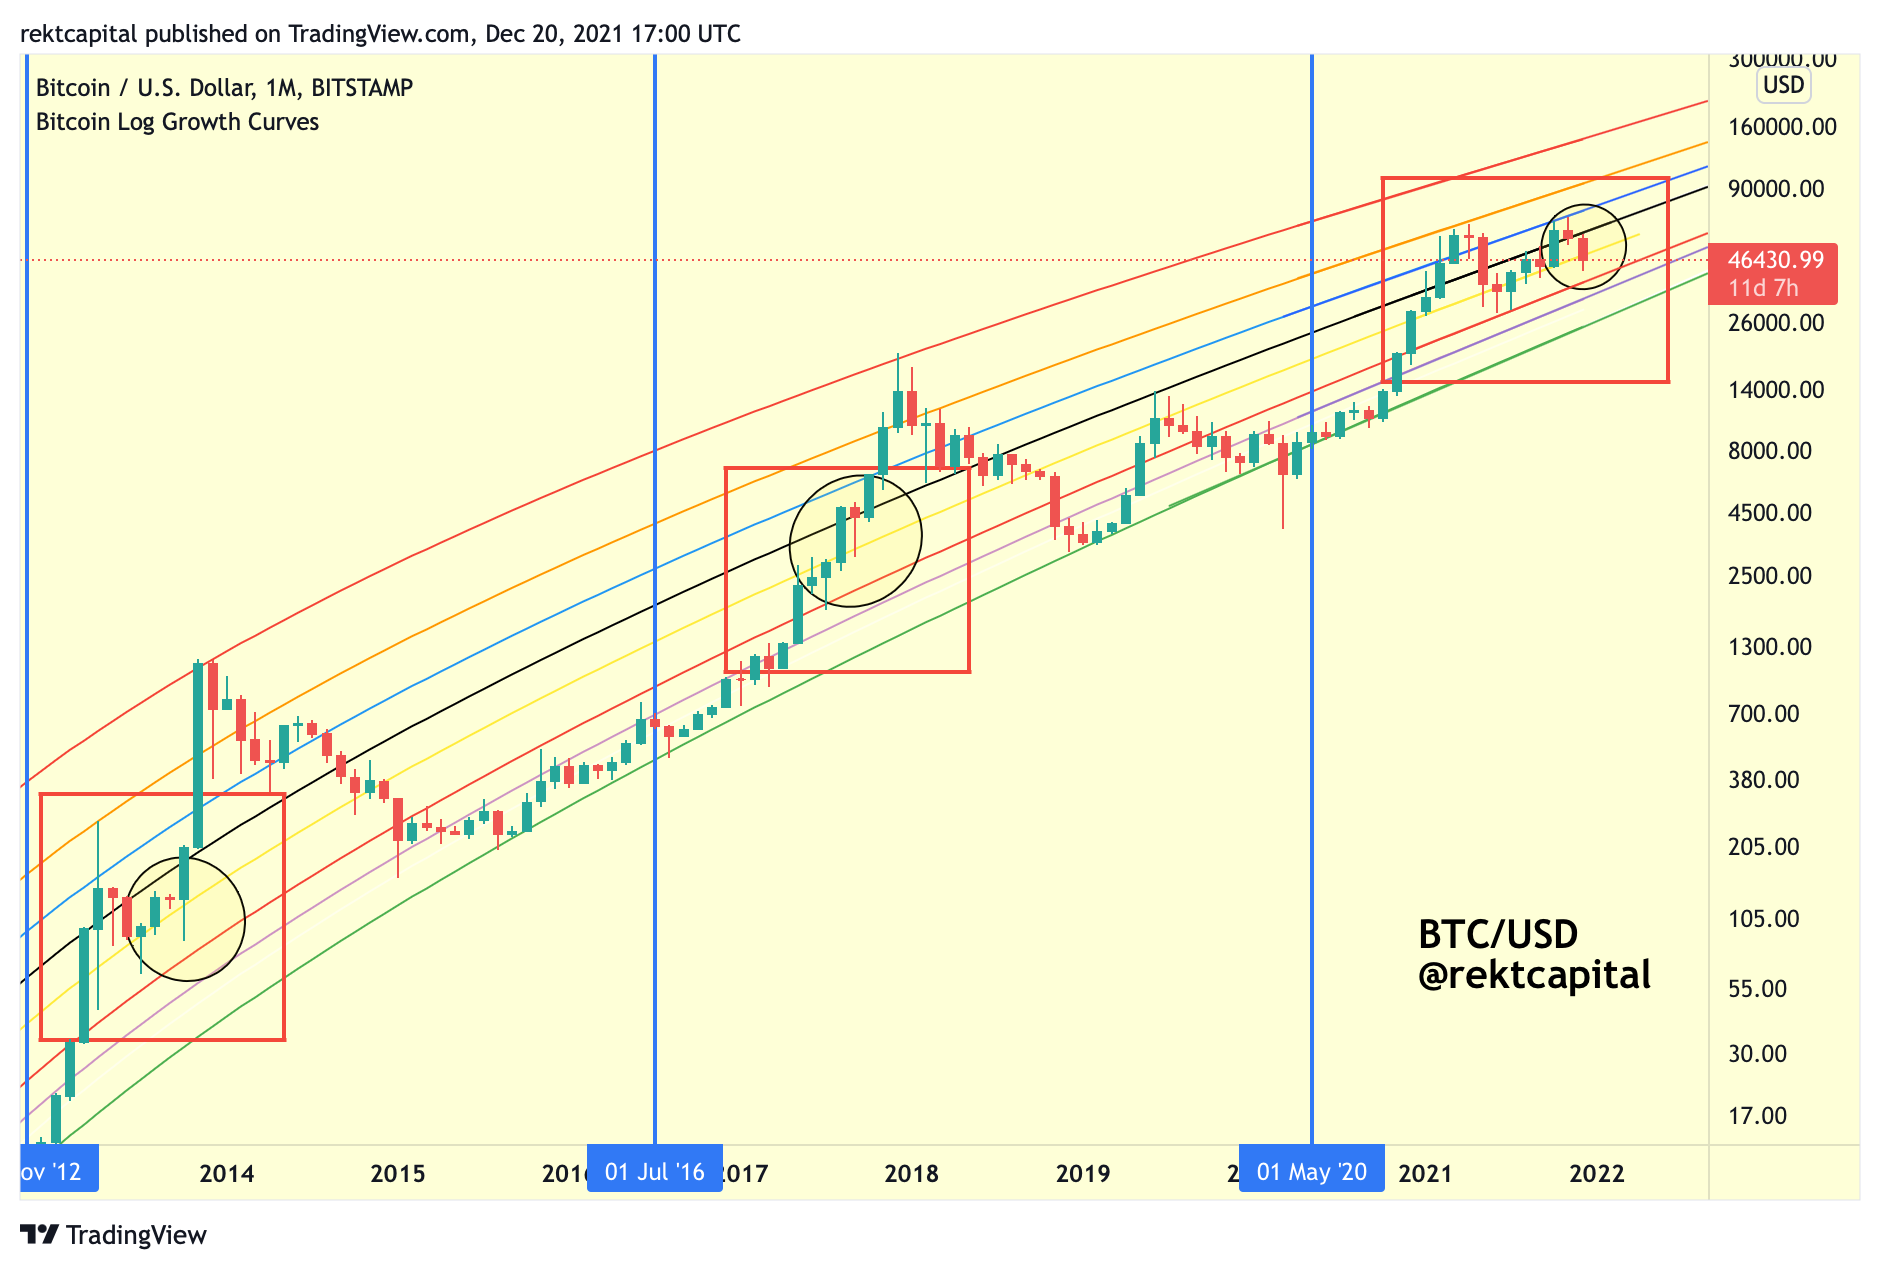
Historically, Bitcoin can produce downside wicks to as low as the red 0.236 Fib support but without actually touching this Fib before quickly recovering and ultimately performing a Monthly Close above the yellow 0.382 Fib Curve support.
If Bitcoin were to see such a scenario take place once again (i.e. quick wick to as low as the red 0.236 Fib Curve, but never actually touching it, before ultimately recovering back above the yellow 0.382 Fib Curve support just in time to Monthly Close above it…):
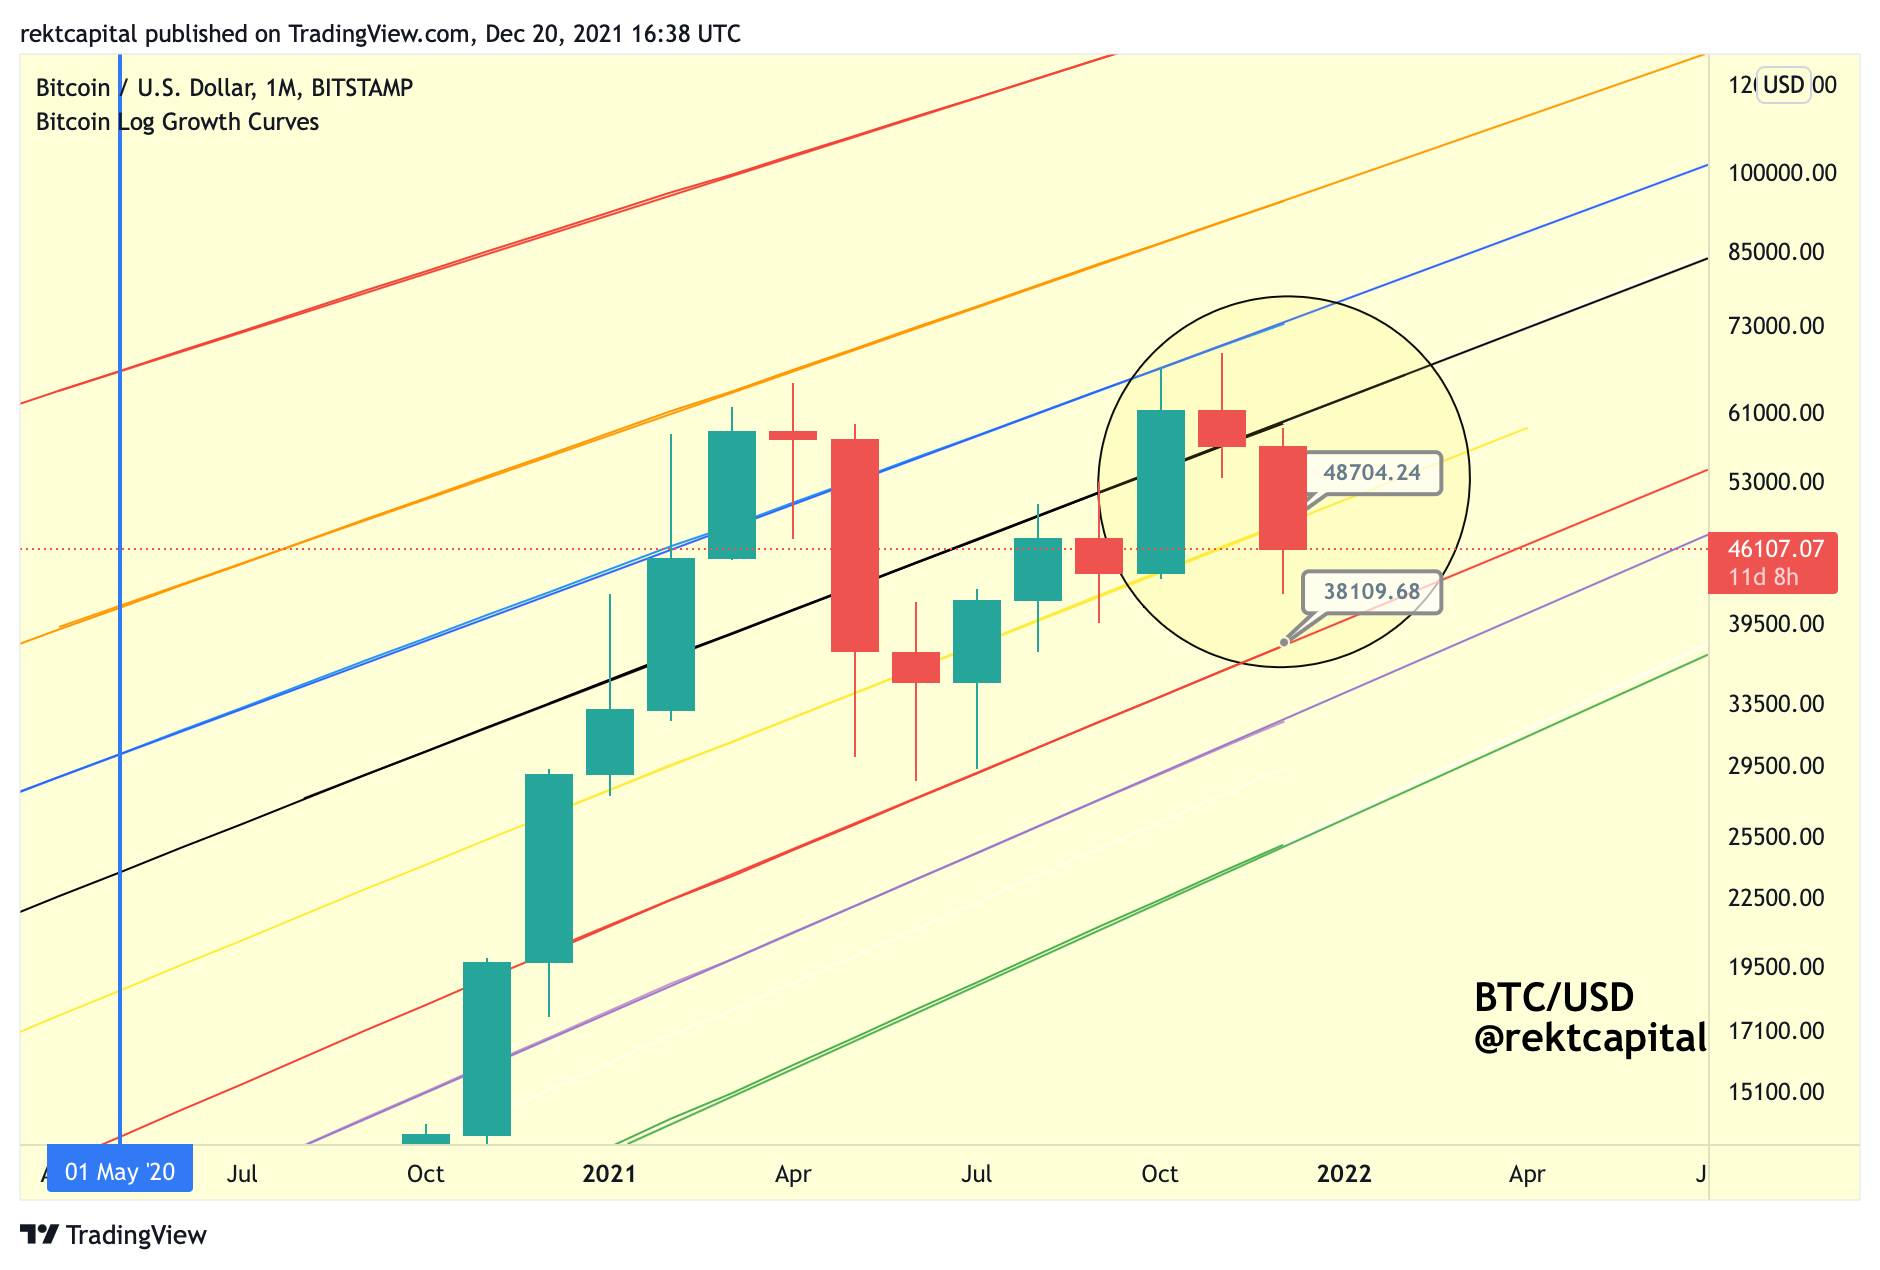
Then that would suggest that BTC could dip to as low as the ~$38000 Fib, without actually touching it, before recovering back above the yellow Fib of ~$48700 just in time to Monthly Close above there.
Generally, I’m watching for Bitcoin to Monthly Close above the yellow Fib at ~$48700 as such as Monthly Close would preserve historically recurring price tendencies across cycles - so through the lens of this Fib, downside volatility below it is just noise. Monthly Closes above it are what ultimately matter.
Of course, the red 0.236 Fib is at ~$38000 whereas the Range High of the early Jan and mid-year range is at ~$39000:
So a pullback to the ~$39000 would satisfy the fact that the 0.236 Fib Curve wouldn’t get touched.
All in all, it is difficult to time the exact bottom of the retrace - but history suggests that the majority of the retrace has already occurred and that the bottom is getting closer to being confirmed with each passing day.
Rather than focus on timing the exact bottom, a consistent, strategic dollar cost averaging strategy at deeply retraced price levels tends to work best for all types of investors.
Because after all - Bitcoin has already experienced a -37% retracement from the ~$69000 highs:

A further retracement to the ~$39000 would signify and extra -6% downside, amounting to -43% in total:
So while a pullback to as low as ~$39000 is possible - it doesn’t even need to happen.
Bitcoin is in the bottoming out process already and whether BTC needs an extra -5% to -10% to fully confirm that bottom or not is precisely what dollar-cost averaging controls against - getting the best possible average price across an entire corrective period.
Thank you for reading this free edition of the Rekt Capital newsletter.
If you enjoyed this edition - I guarantee you’ll love the Rekt Capital newsletter. Feel free to Subscribe today for only $14 a month: