What's Next For Bitcoin & Ethereum?
Extensive analysis on BTC & ETH
Welcome to the Rekt Capital newsletter, a resource for investors who want to better navigate the crypto markets with the help of cutting-edge crypto research and unbiased market analysis.
This free edition of the Rekt Capital newsletter is brought to you by… Ledn

Ledn helps you do more with your Bitcoin through their Bitcoin savings accounts, their bitcoin backed loan programme and their b2x programme.
Their Bitcoin Savings Accounts let you earn 9.0% on your USDC and 6.1% on your Bitcoin.
With their Bitcoin Backed Loan programme, you can take out a stablecoin or dollar loan of off your Bitcoin which is much more tax-efficient way to keep your Bitcoin exposure while gaining dollar liquidity.
And through Ledn’s B2X programme, you can double your exposure to the Bitcoin you already own.
Checkout Ledn and do more with your Bitcoin today:
BTC/USD - Bitcoin
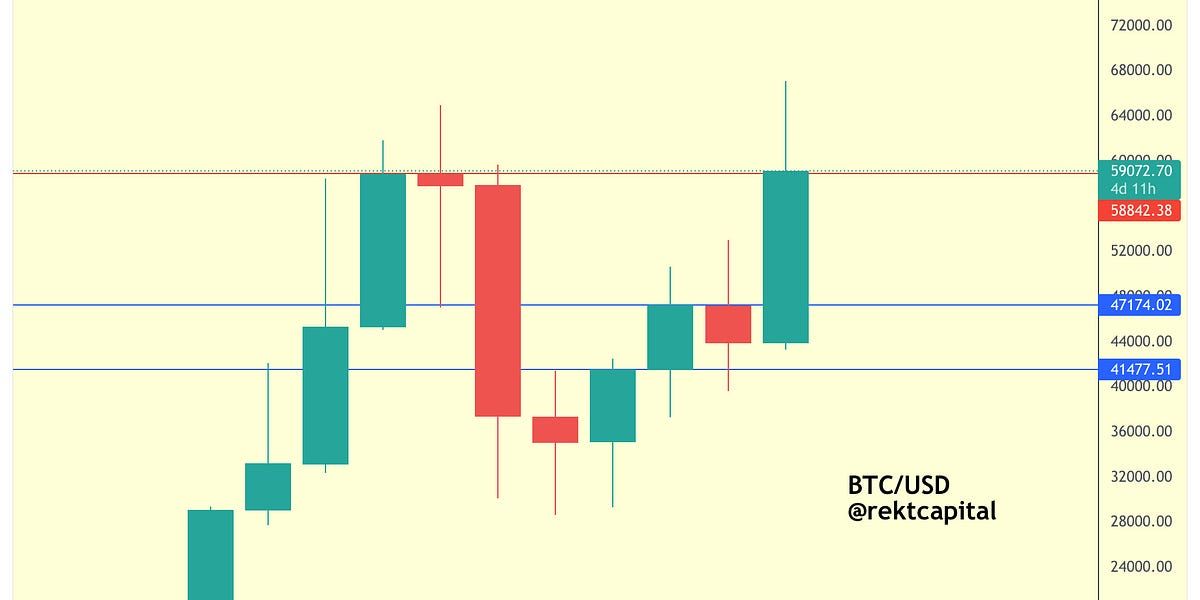
Bitcoin has broken out from its blue re-accumulation range, rallying to its final major resistance area before new All Time Highs (red):
A Monthly Close above this red resistance level of ~$58800 would be a great initial sign for this resistance potentially giving way in November.
However, let’s assume BTC Monthly Closes below the red resistance level.
When it comes to higher timeframe, BTC tends to enjoy retest attempts of the Range High of the previous breakout range. But the Range High in this case is the top blue line at ~$47,000.
Does such a retest need to happen?
There are two things to consider.
Here’s the first thing:
The last time that BTC visited the red resistance for the first time back in March 2021, price rejected and actually pulled back into the blue Range High (~$47000).
So this retesting behaviour isn’t out of the ordinary, but there is a legitimate question of this current resistance weakening to the point where perhaps it isn’t able to reject price that deep this time around.
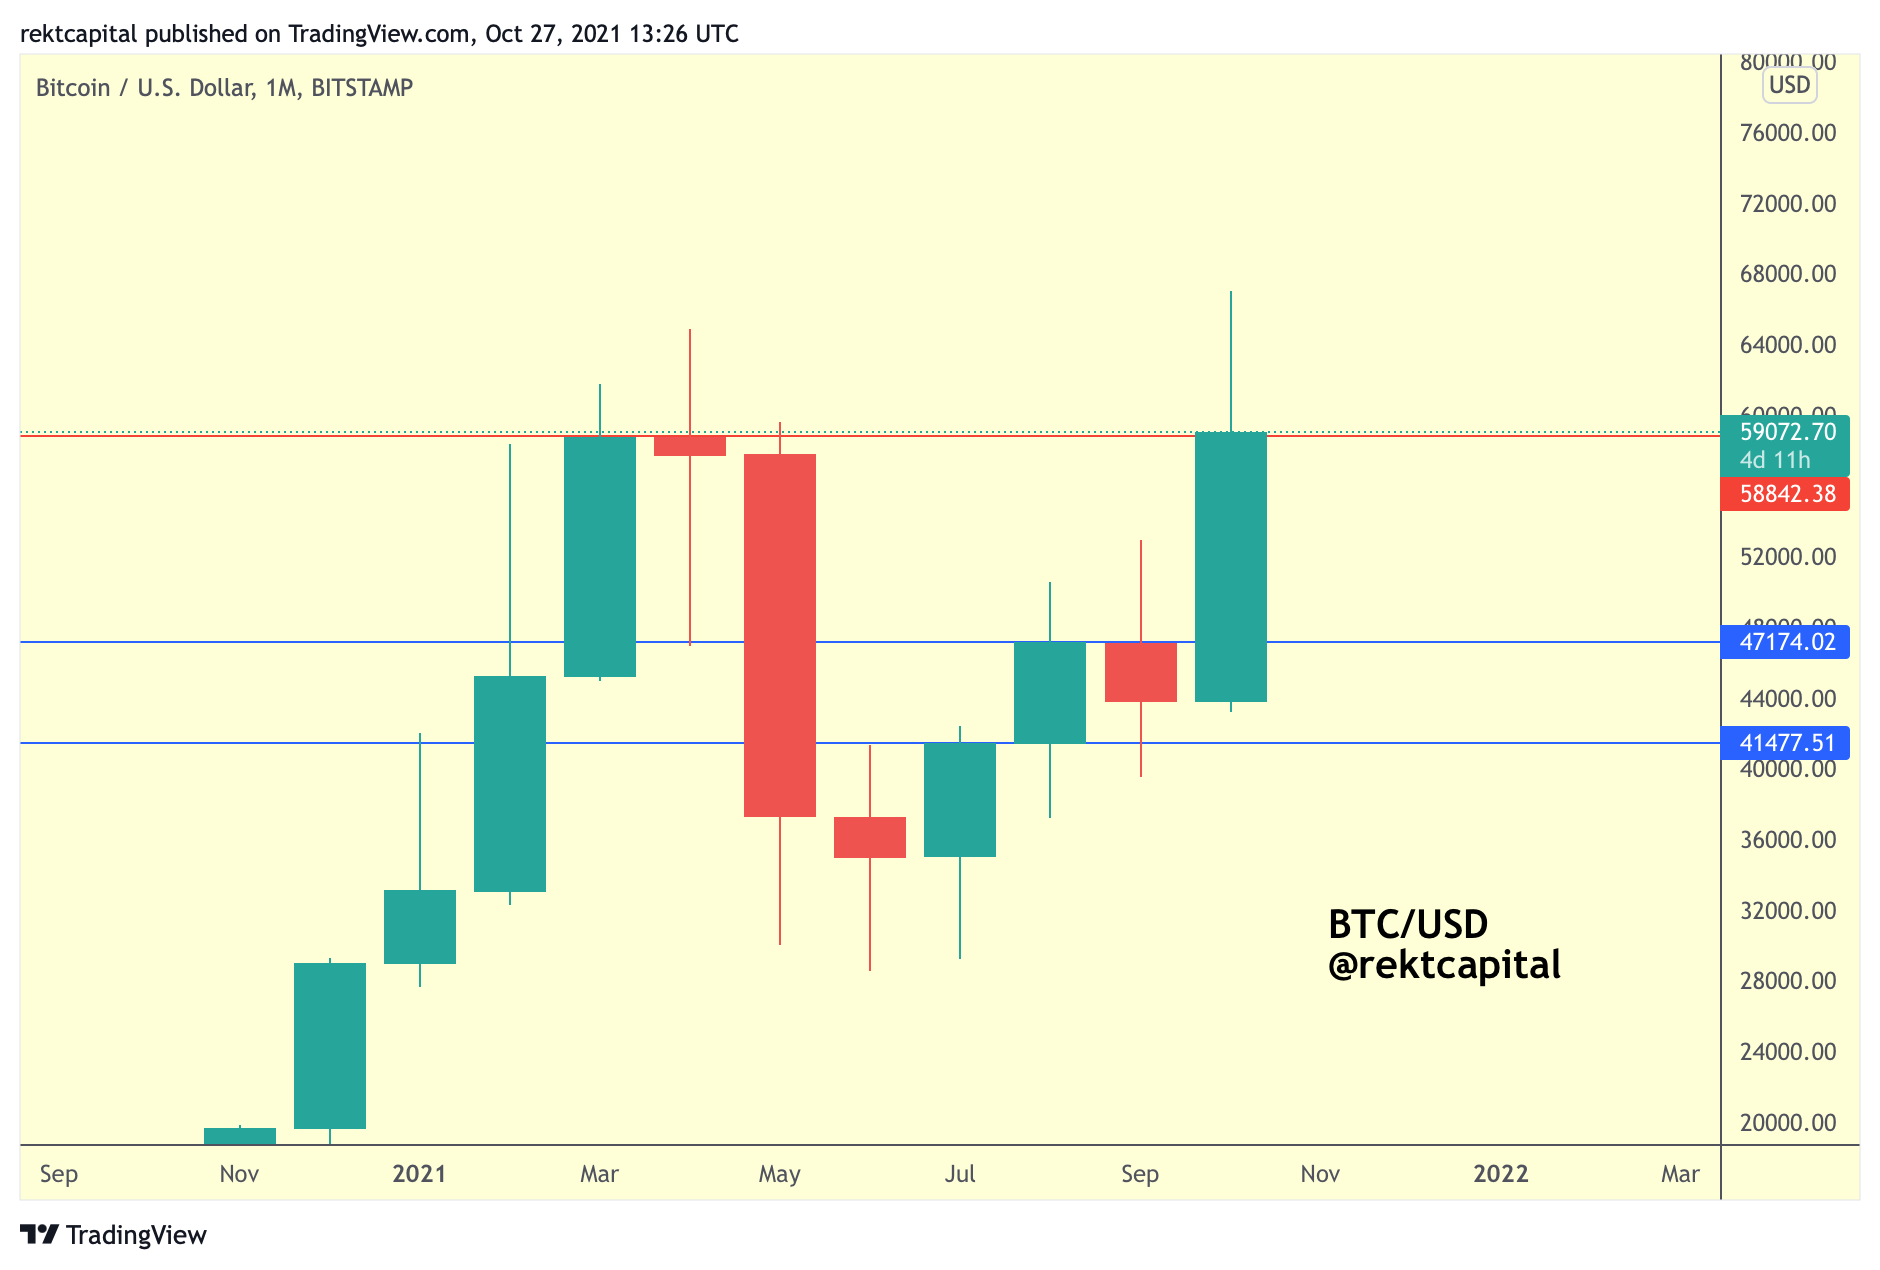
The second thing is that Bitcoin is currently setting itself up for a Monthly Close above the black 0.5 Fibonacci growth curve level, which is represented by the price point of ~$54,200:
In other words, a Monthly Close above ~$54200 would effectively confirm that Bitcoin will continue to repeat its historically recurring mid-cycle price tendencies. I share more on that in an earlier edition.
But this black 0.5 Fib level may need to enjoy a retest of its own, in which case the mid-$50,000s are a possibility.
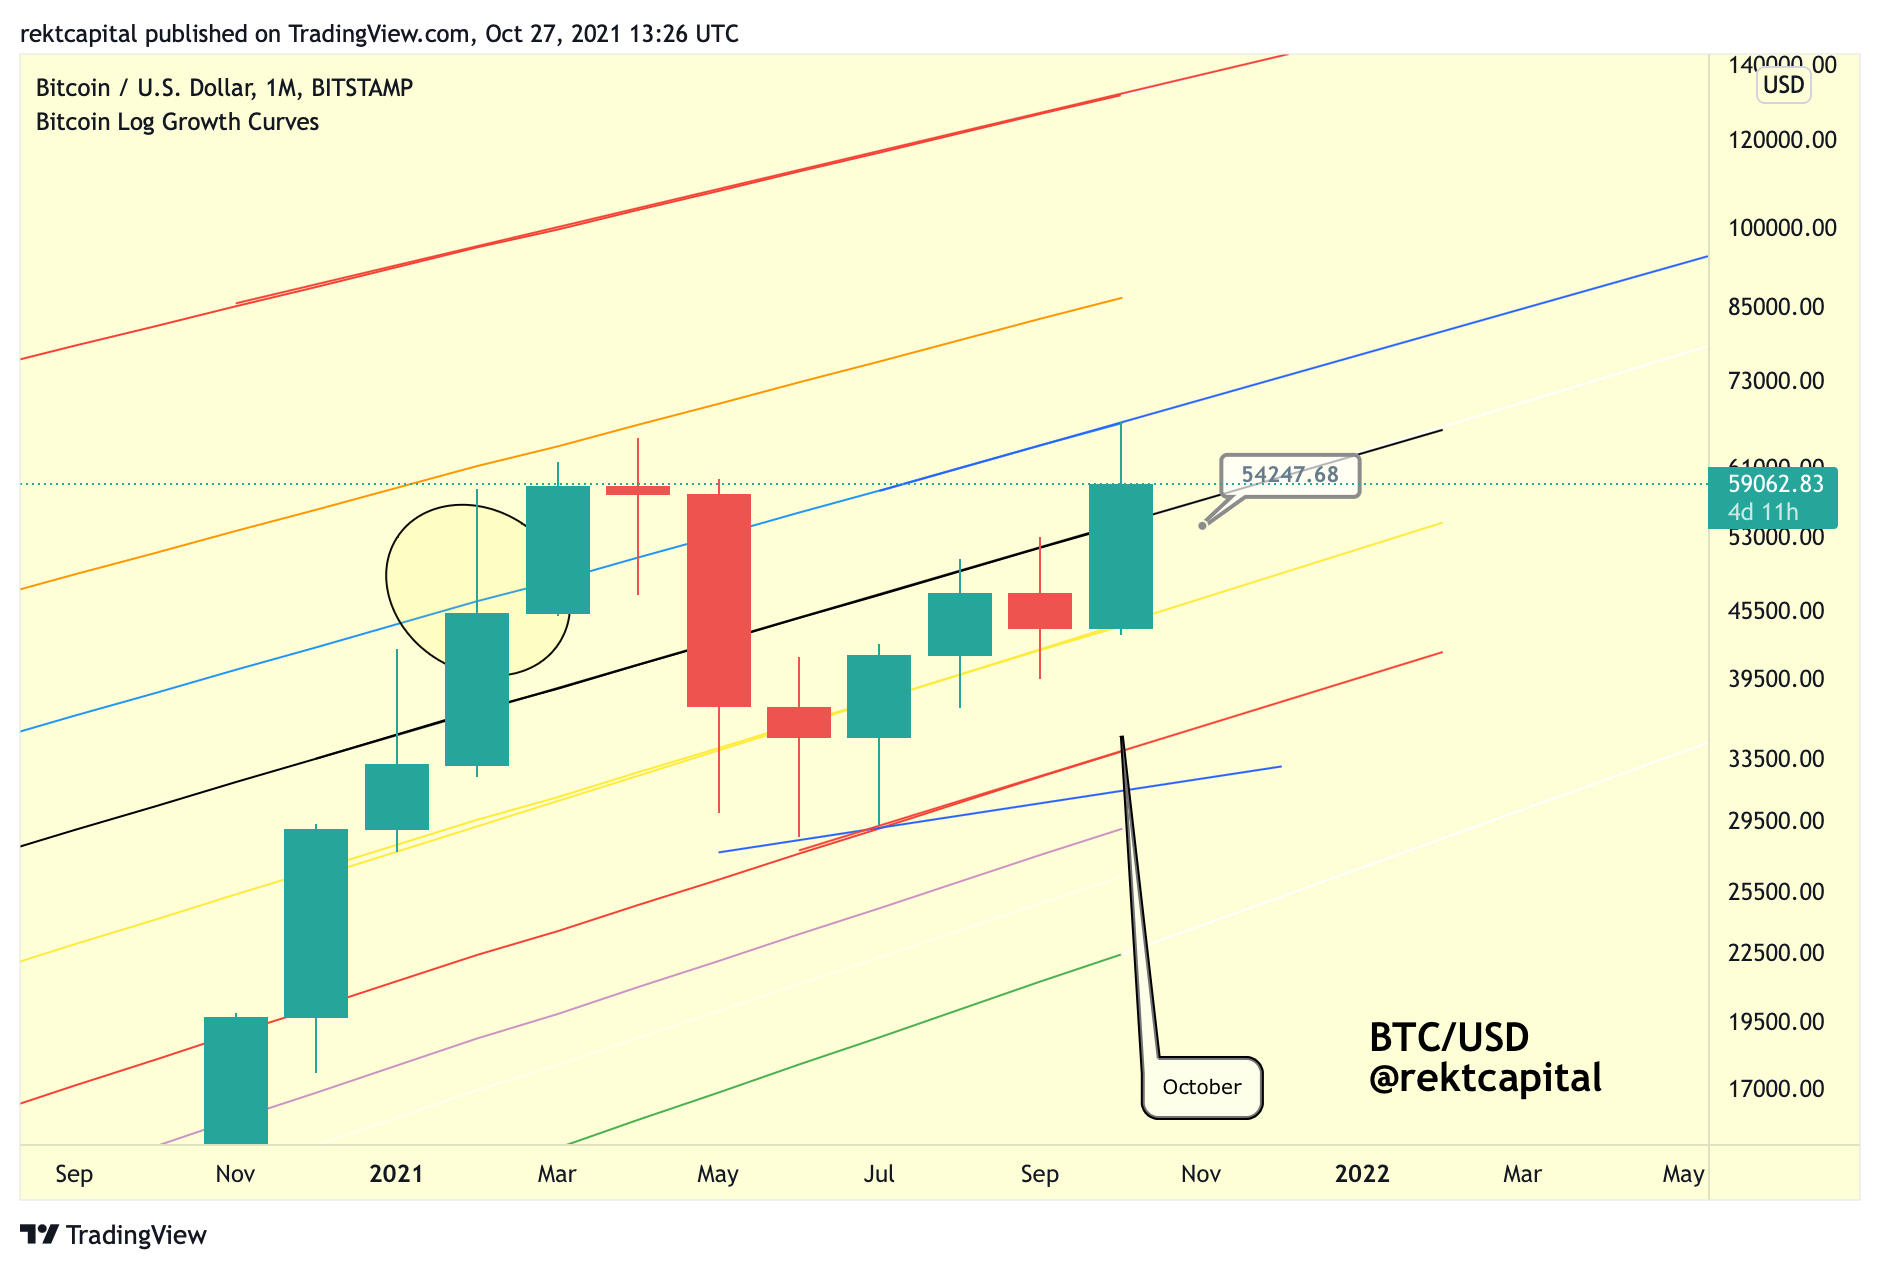
Especially since Bitcoin is currently retesting a previous area of resistance (red) in an effort to turn said region into new support (green) on the Weekly timeframe:
In this case, the Weekly timeframe as well as Fib growth curve analysis suggest a possible revisit of the mid-$50000s with the sole goal being:
Flip a previous major resistance area into an area of new support.
As for the Monthly perspective suggesting even a revisit of the mid-$40000s, I explain how likely of a scenario this could be in a previous newsletter.
ETH/USD - Ethereum
Ethereum’s price action is closely mimicking Bitcoin’s in the sense that Ethereum has broken out from a Monthly Range of its own:
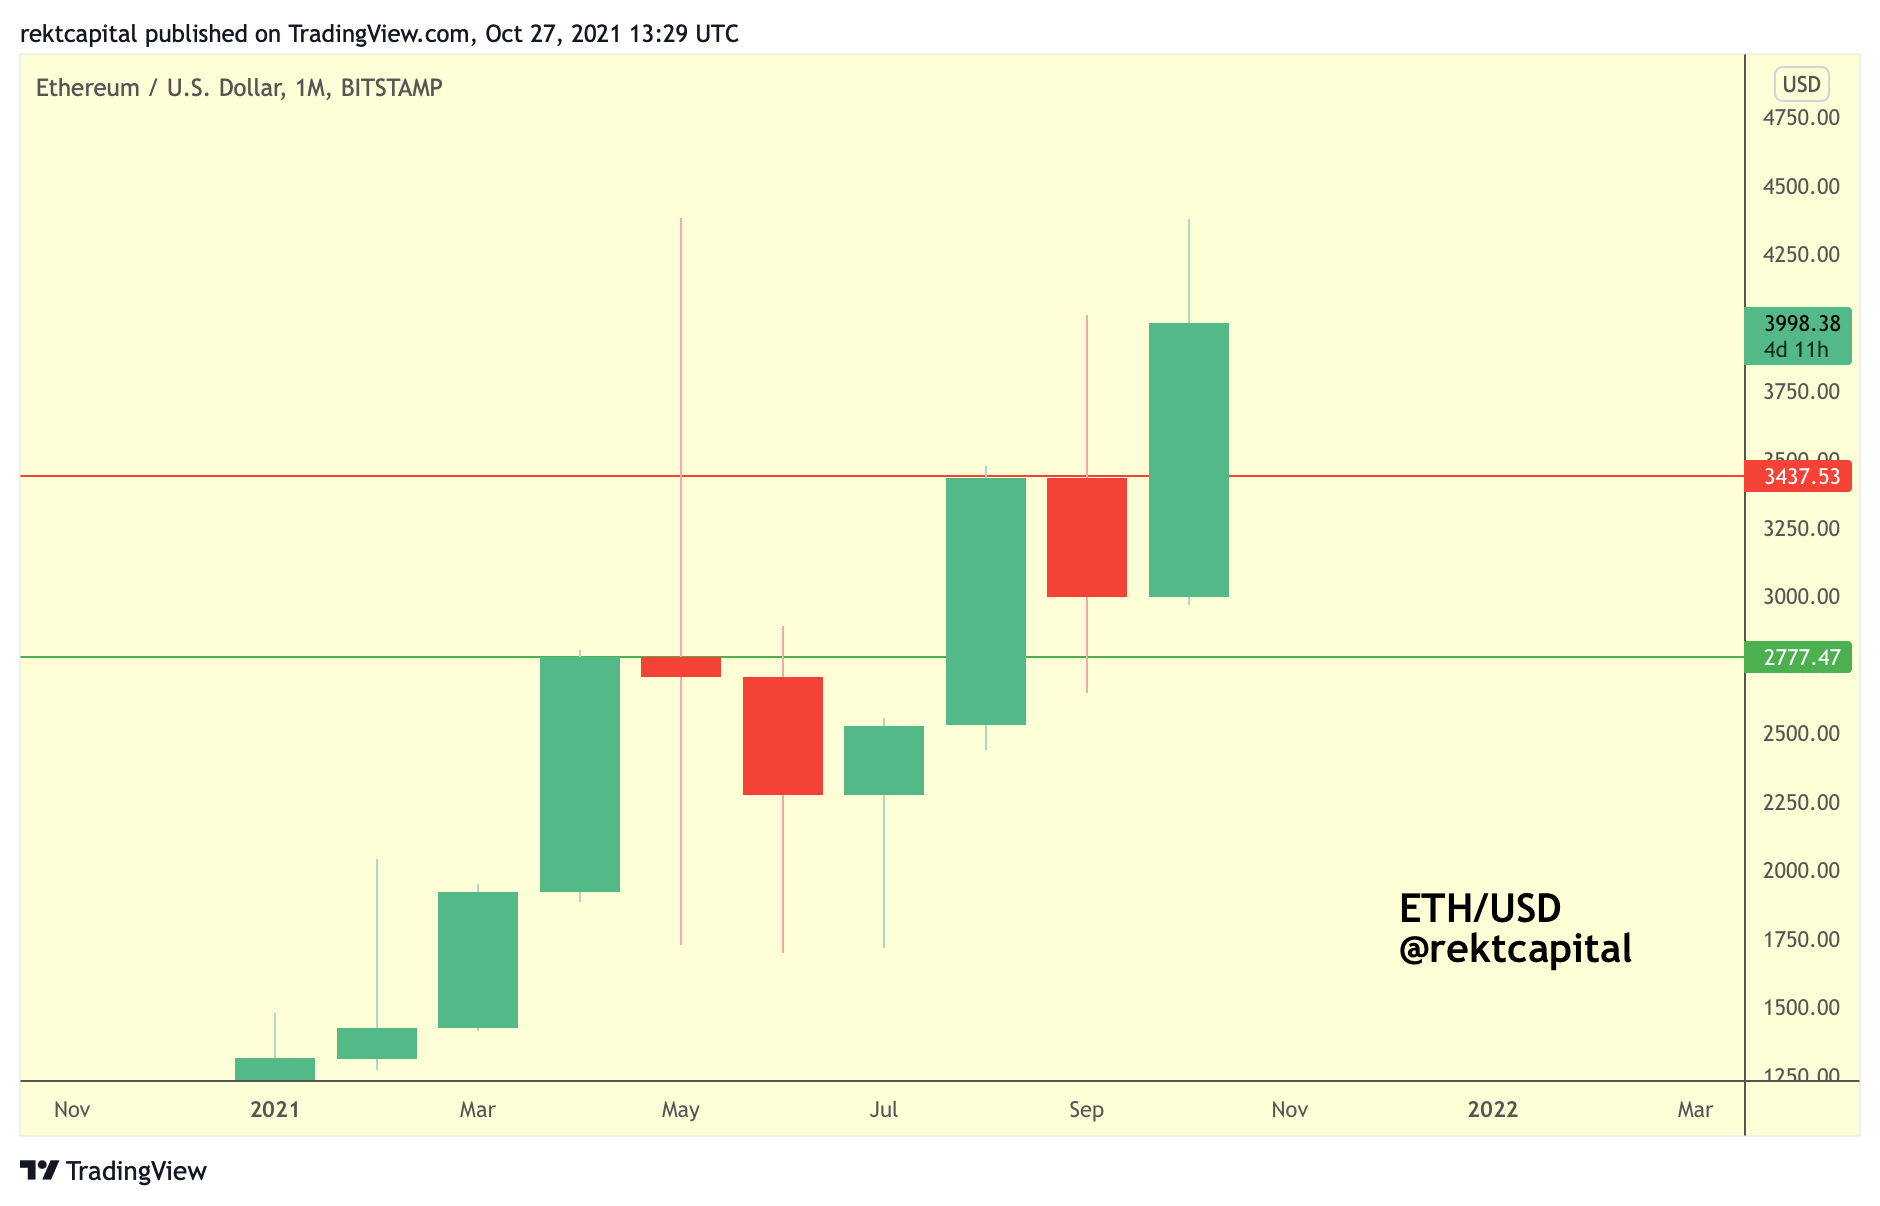
Could Ethereum pullback into its Range High of ~$3400 for a Monthly retest attempt?
It wouldn’t be out of the ordinary either.
After all - ETH/USD likes to retest previous Monthly levels.
Case in point: in April 2021, ETH rejected at ~$2777 whereas in August ETH broke above this level only to retest it as support in September before moving higher.
A Monthly Close like this at these highs could indeed precede such a pullback, simply because of ETH’s inherent price cyclicality.
A Monthly Close like this at these highs would also mean that ETH has closed below the two resistance levels it needs to breach for new All Time Highs: ~$4000 and $4380 (blue):
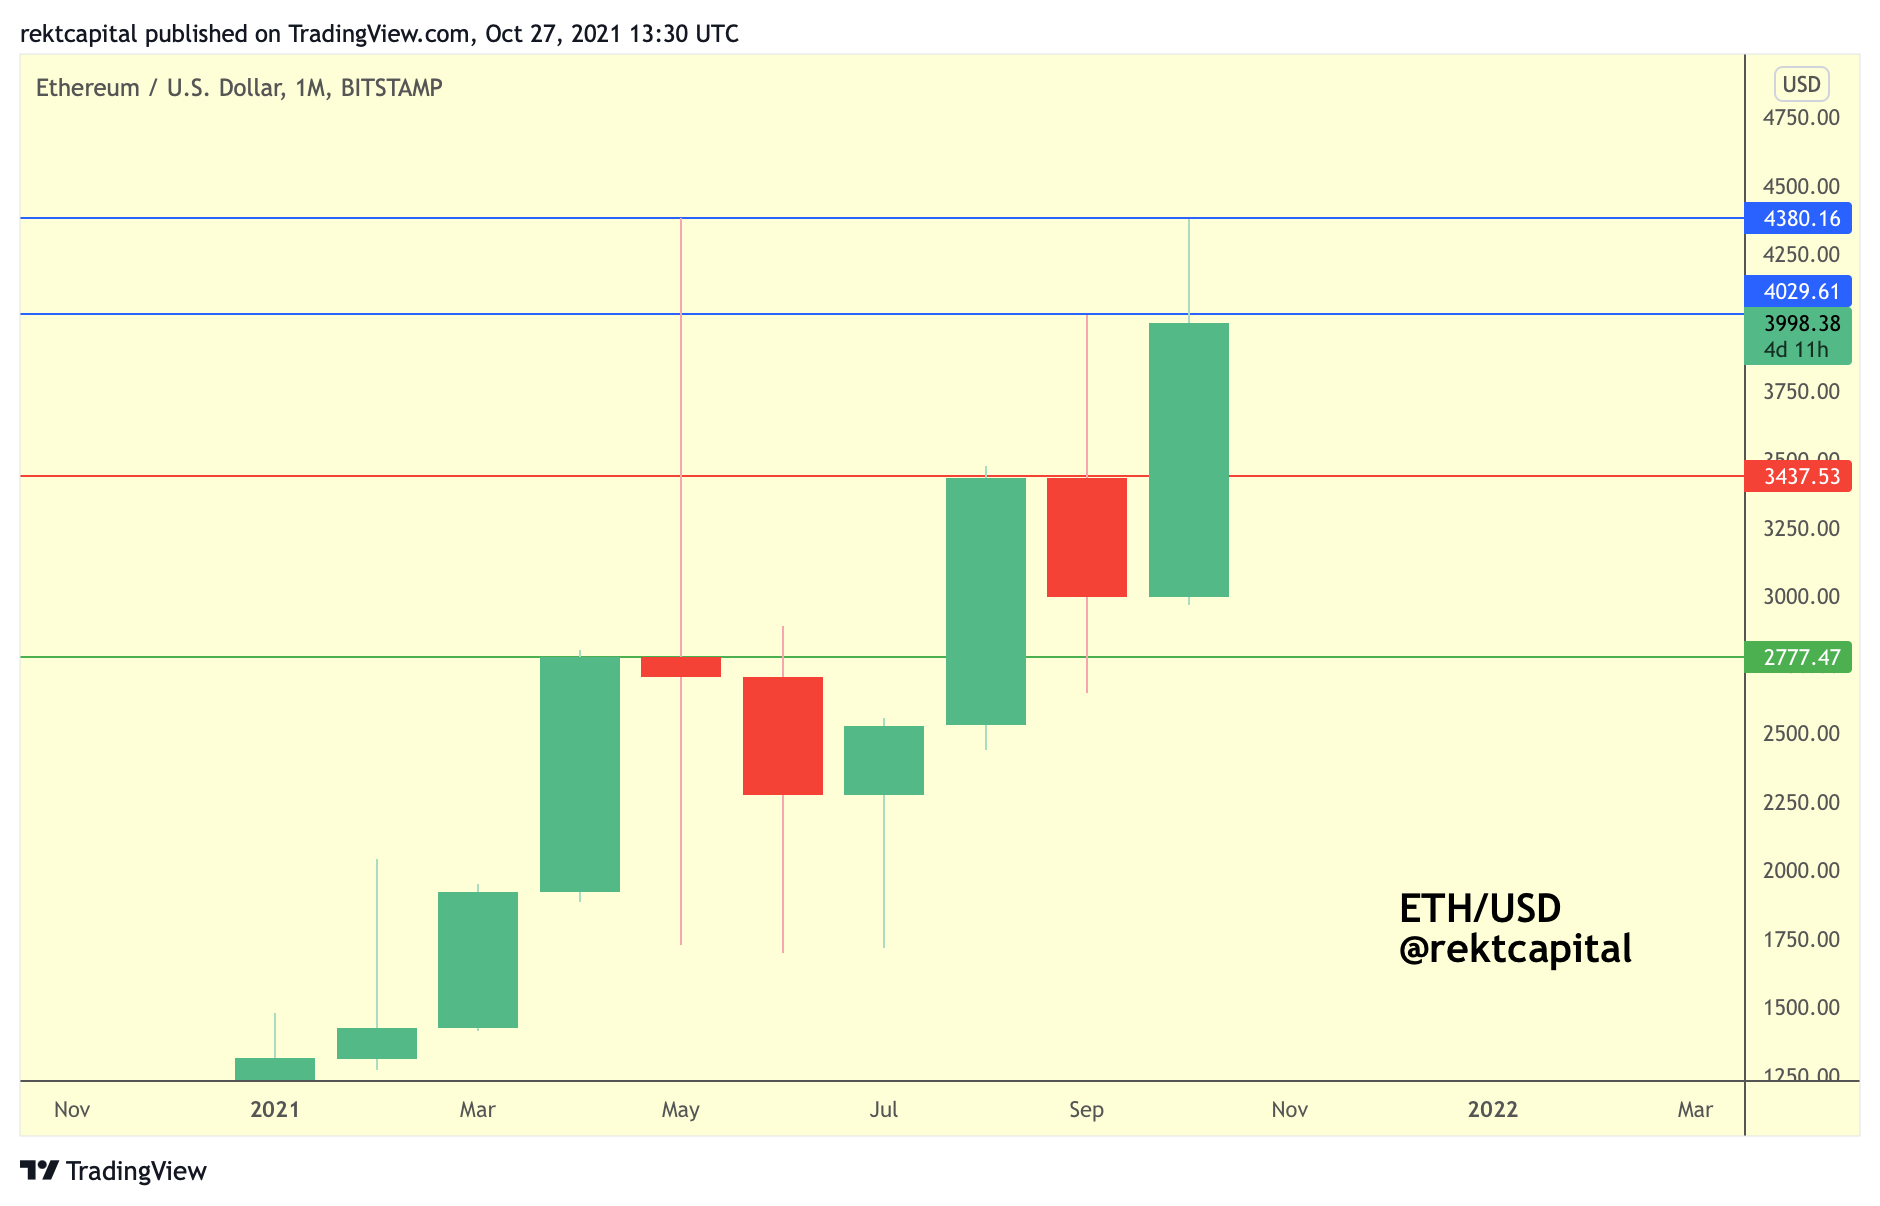
Monthly Close below these two blue resistances could reject price a bit, but generally, much like Bitcoin, these upcoming potential Monthly resistance rejections are supposed to showcase to analysts how much these levels are actually weakening as resistance before they inevitably end up being breached in the weeks ahead.
But before we can consider the mid-$3000s again, the necessary confirmation to watch out for is what’s going on on the Weekly timeframe:
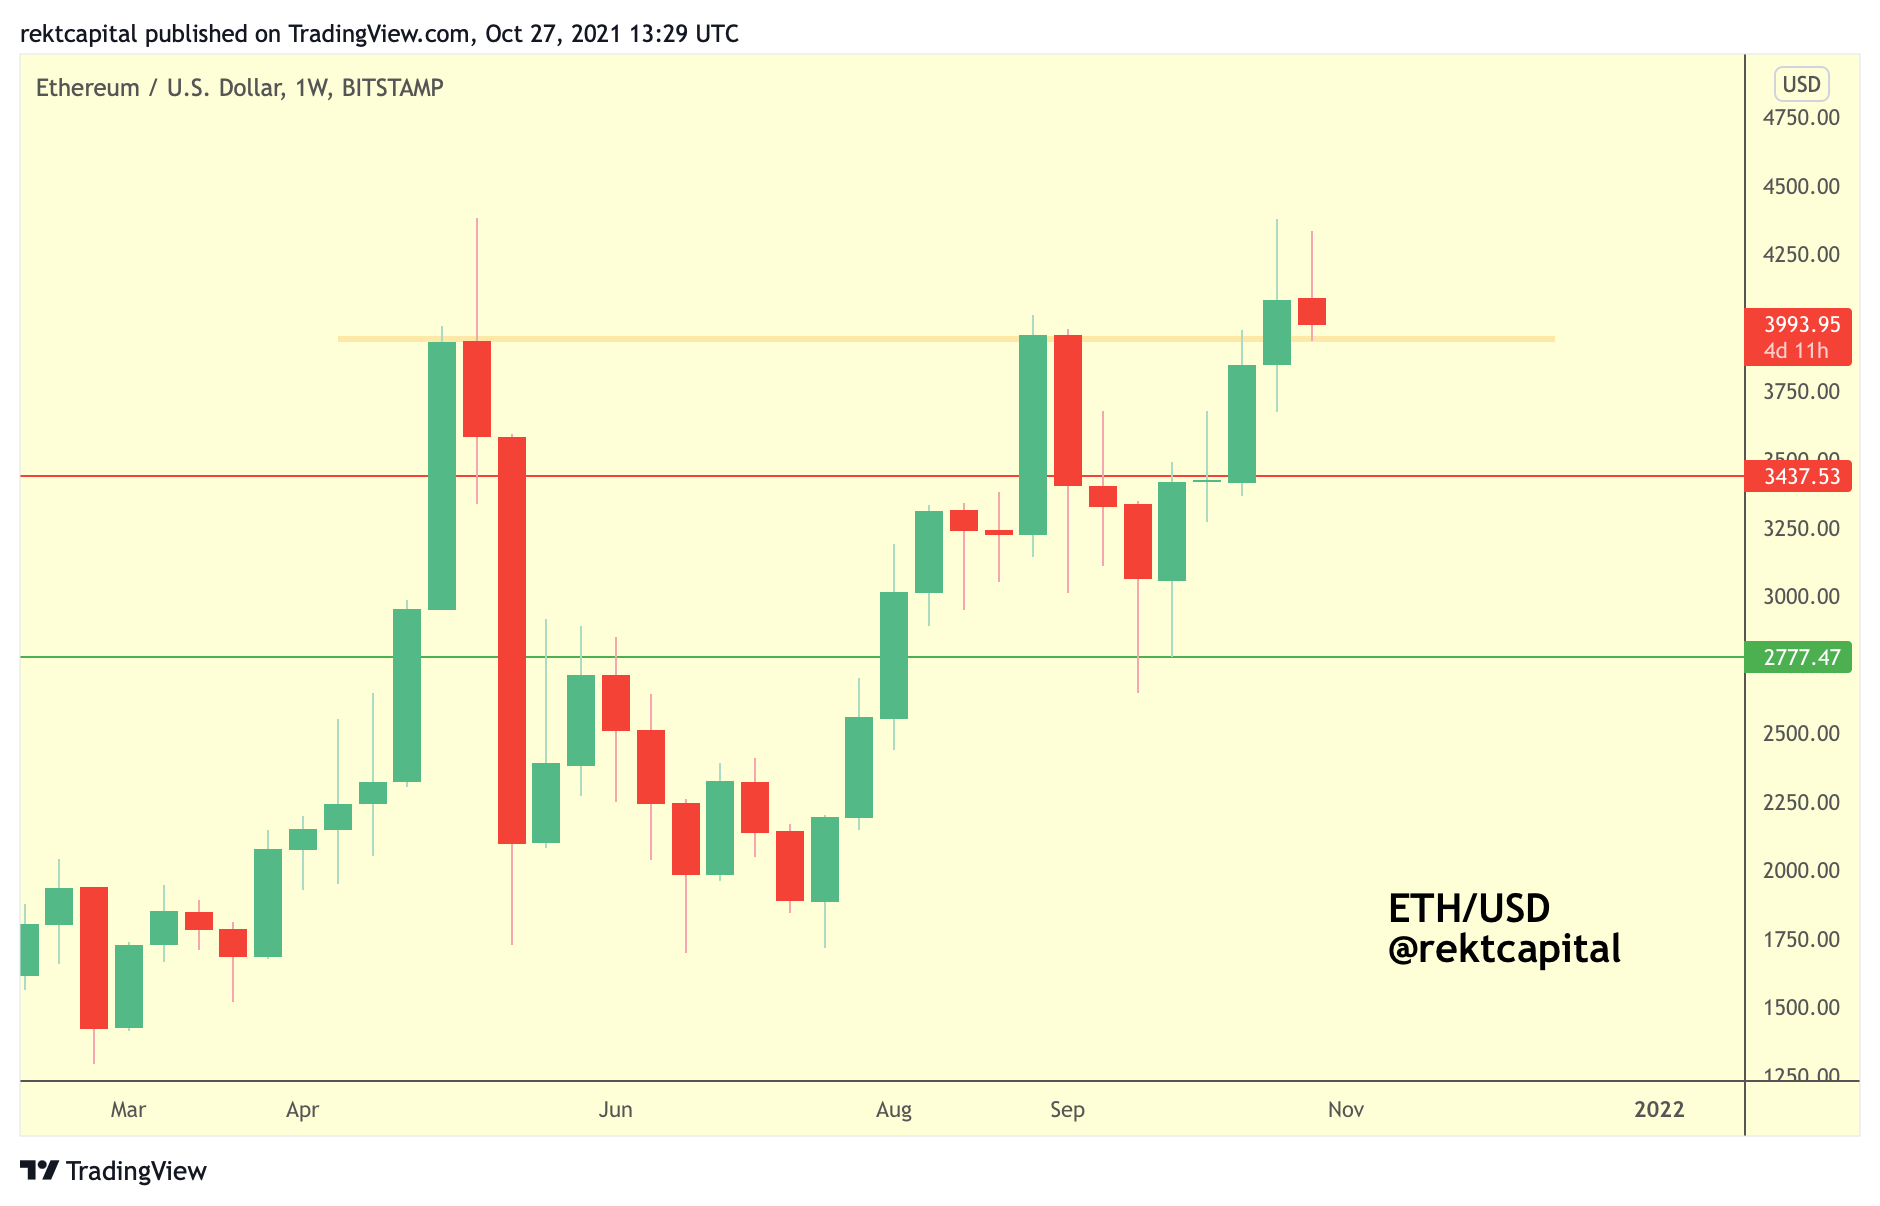
Specifically, ETH is in the process of retesting the ~$3850 region as support.
In May and late August, ETH rejected from this area of resistance whereas now ETH is trying to hold this same area as support.
Retest attempt is in progress and in fact this retest is approximately confluent with a macro trendline retest also:
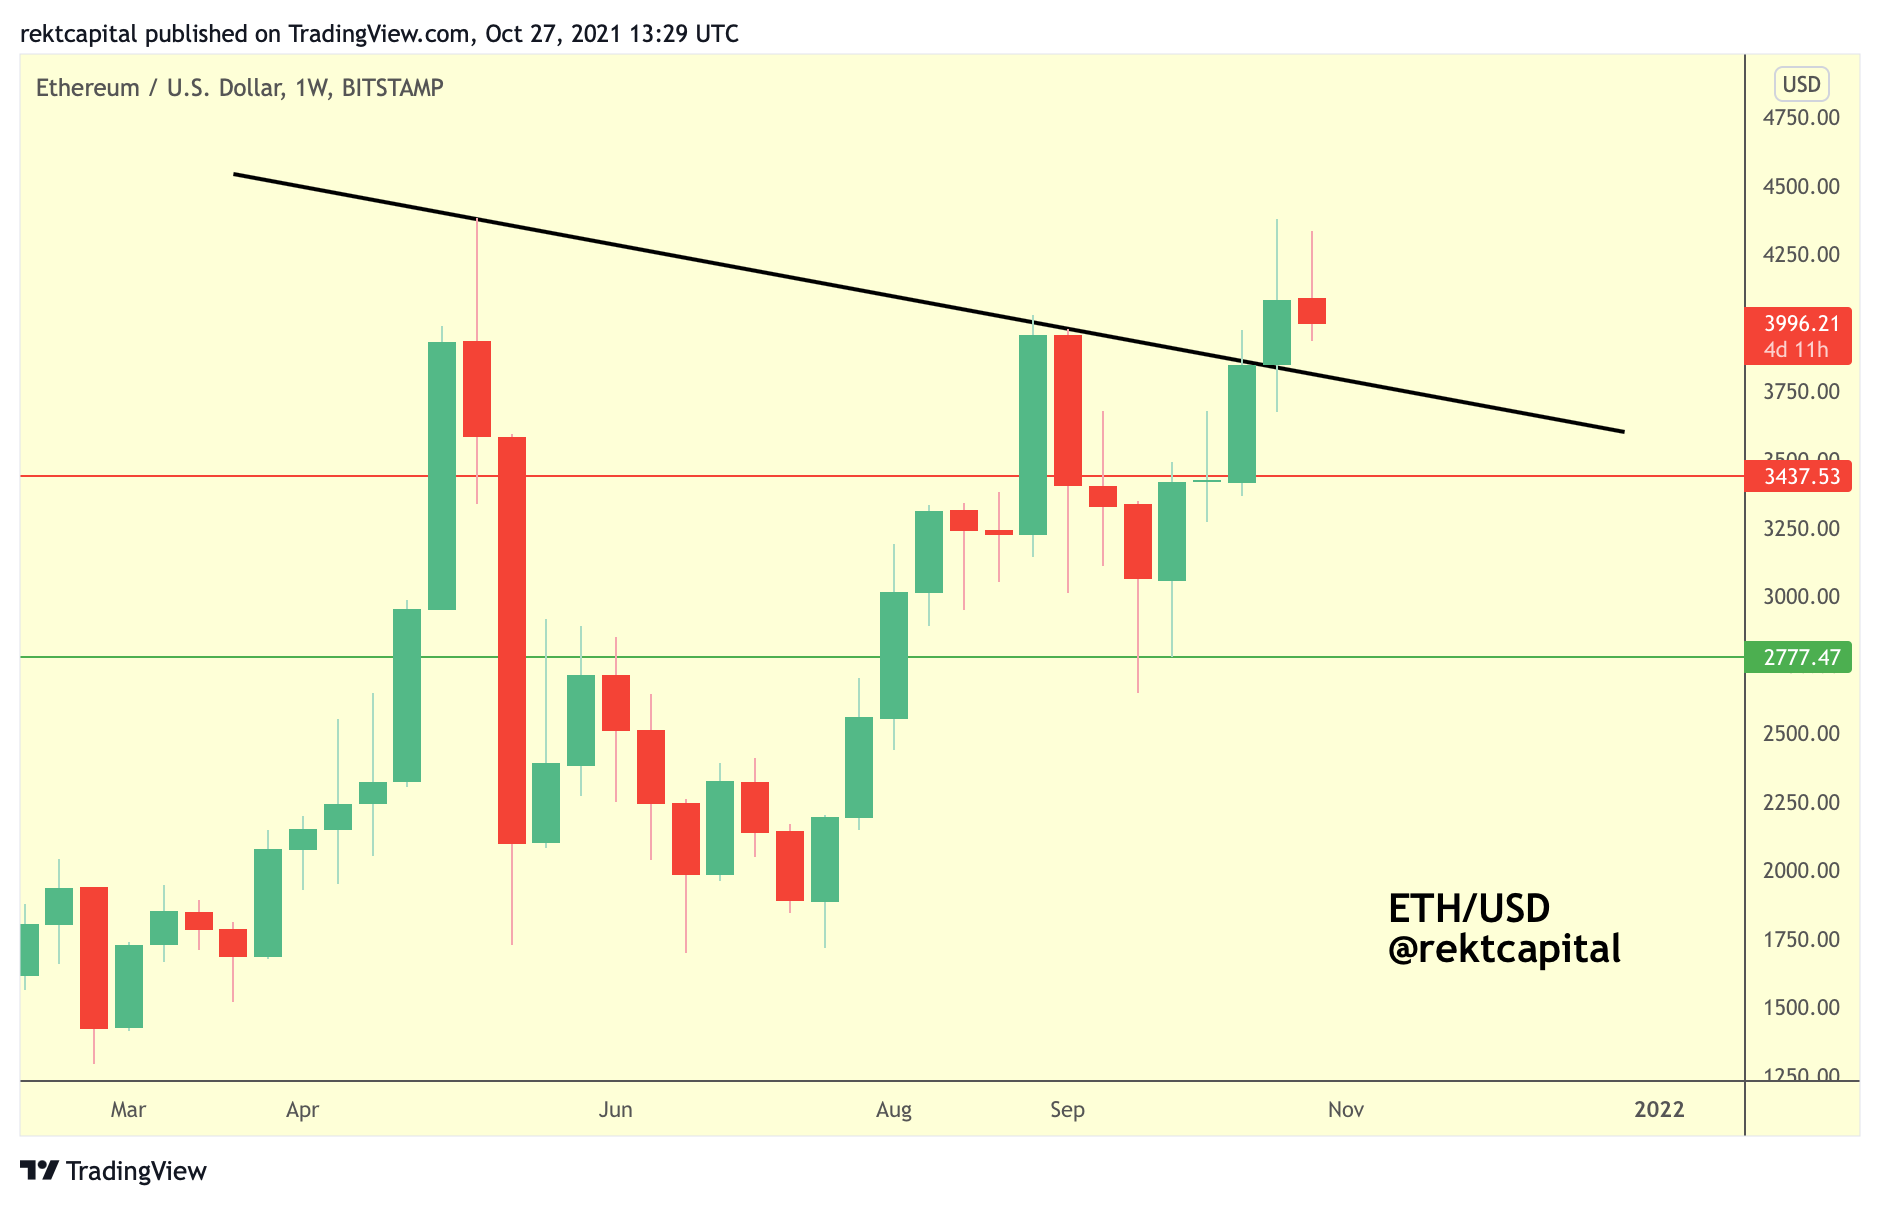
However, should this retest fail, the Weekly price chart would lend bearish confirmation contributing to the Monthly perspective taking precedence in which case that revisit of the mid-$3000s would become a distinct possibility.
Thank you for reading this free edition of the Rekt Capital newsletter.
If you enjoyed this edition - I guarantee you’ll love the Rekt Capital newsletter. Feel free to Subscribe today for only $12 a month: