What's Going On With Bitcoin?
An in-depth look at what BTC could do next
Welcome the Rekt Capital newsletter, a place for people who want to better navigate the crypto markets with the help of cutting-edge macro research and unbiased market analysis. This is a free pre-launch bonus issue for all of you who signed up early.
Monday, Wednesday, and Friday coverage officially begins on October 12th. And so the countdown continues - only a few days left until official launch! Feel free to make the most of the early-bird discount which ends next week. If you like the newsletter, please forward it to a friend - it would mean a lot to me. And if you’ve been forwarded this, feel free to sign up here:
Having said that, let’s dive in to today’s newsletter about Bitcoin.
In this newsletter we will cover:
- Bitcoin’s current price predicament on multiple timeframes
- How Bitcoin’s current price action fits in with its historical Post-Halving price tendencies
Bitcoin (BTC/USD) - Quarterly View
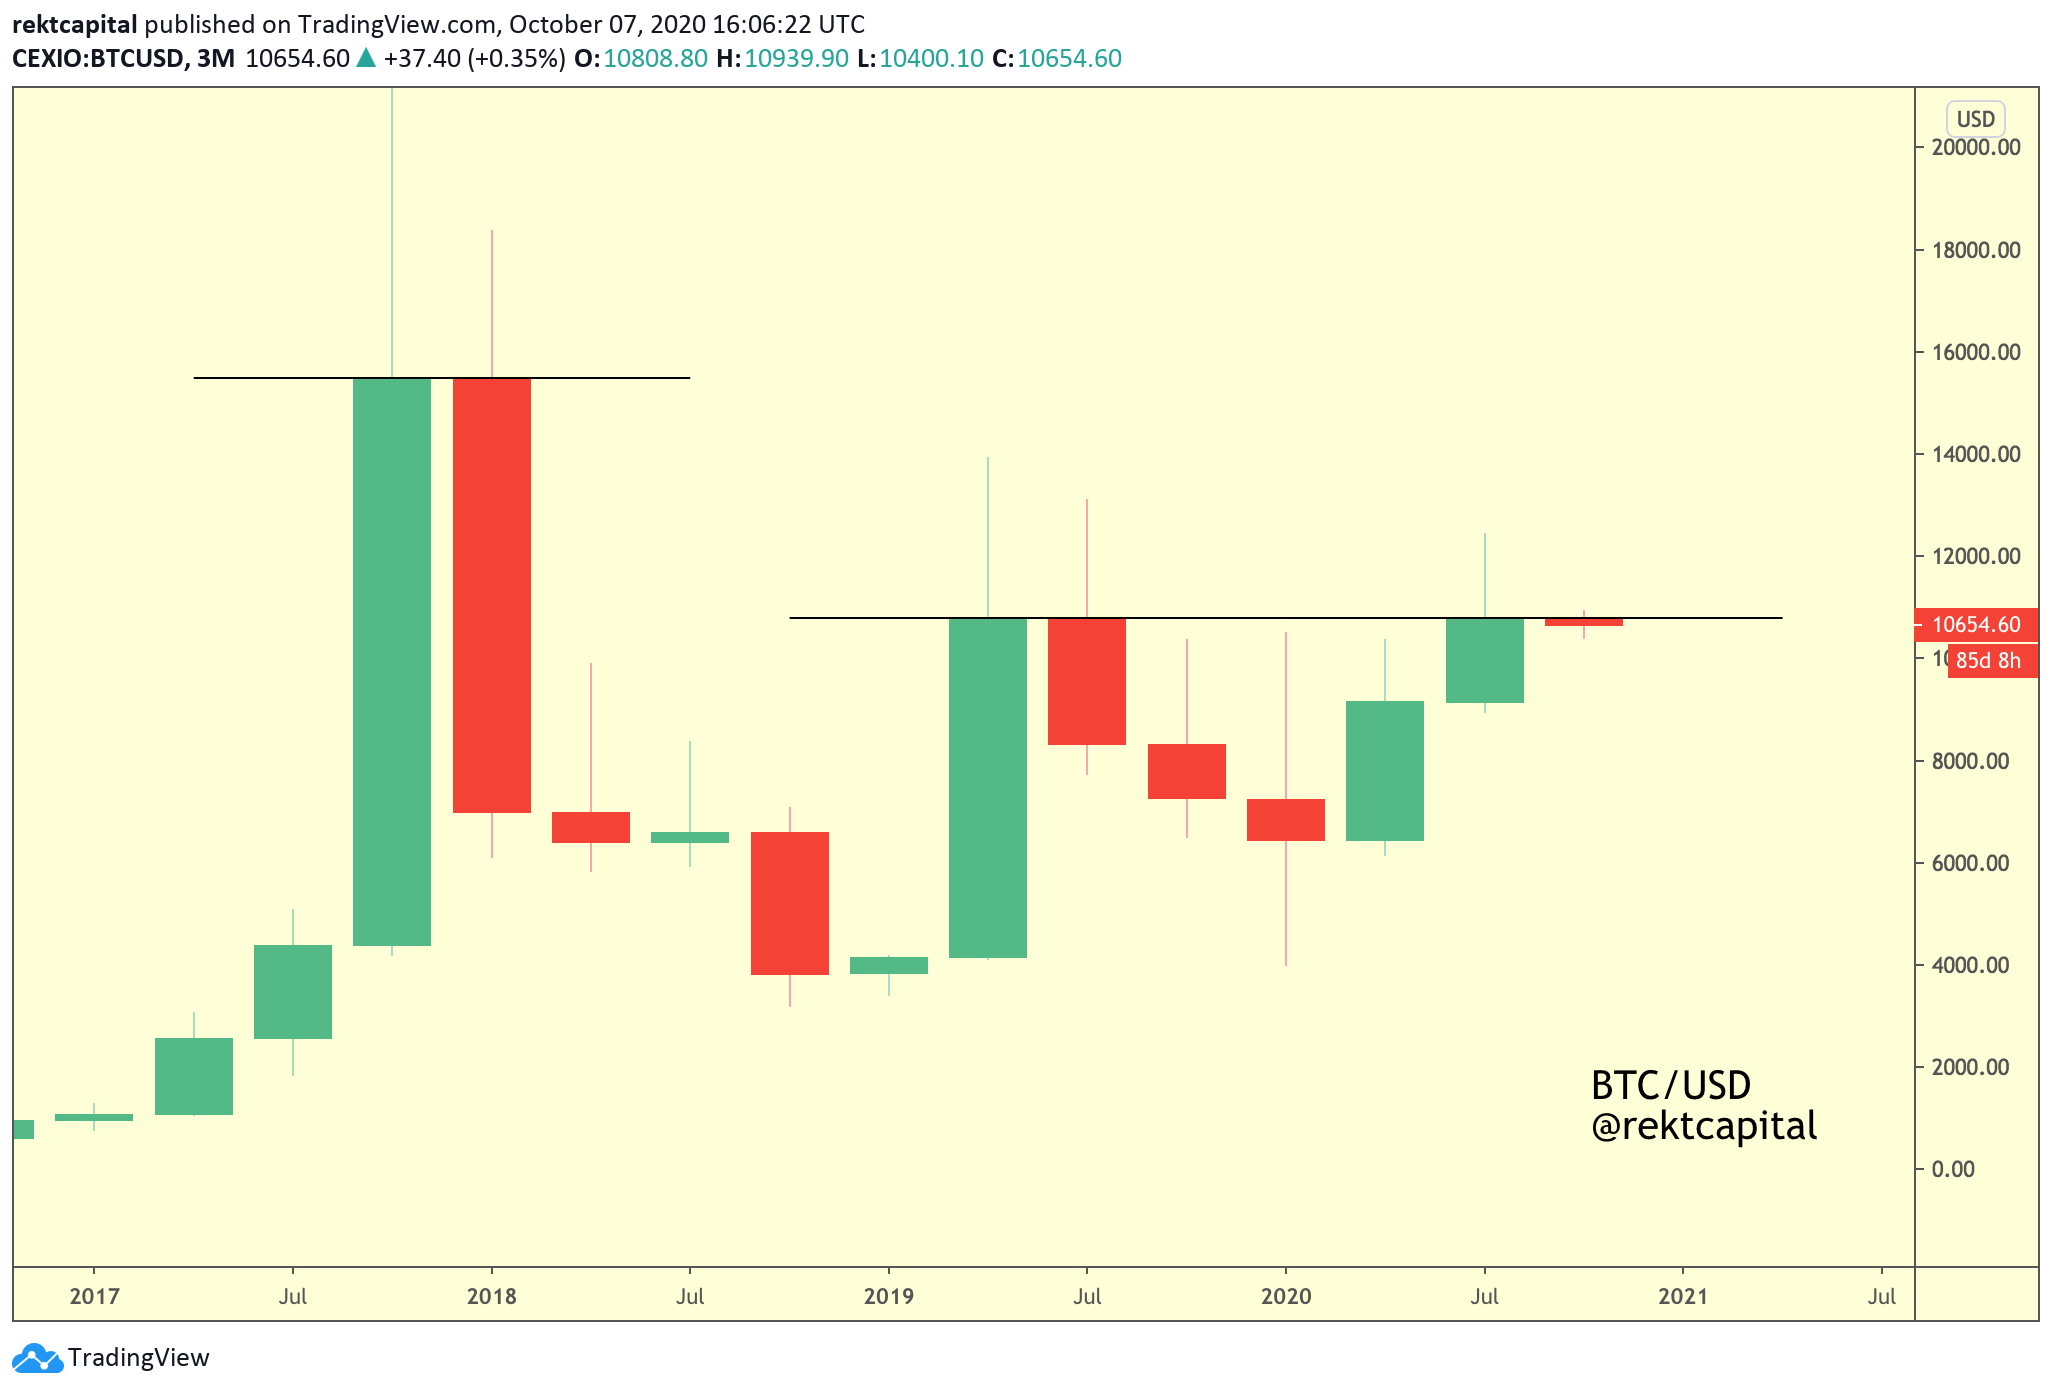
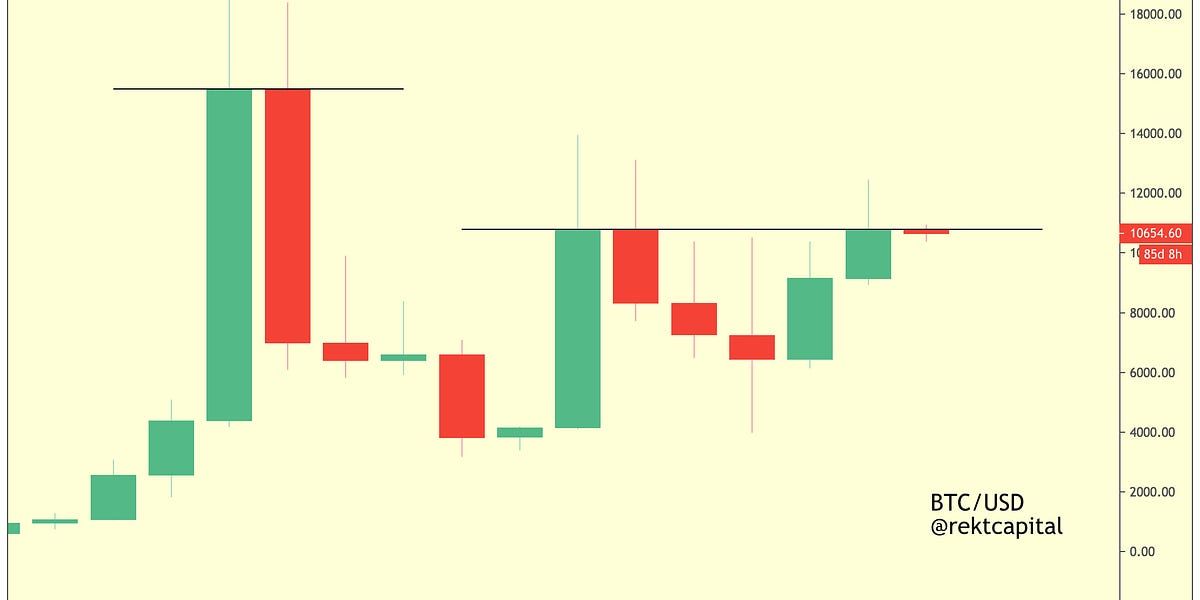
Bitcoin has Quarterly candle closed below $10.800 for the second time in its entire price history. The last time BTC 3M closed below $10.800, price rejected strongly.
And while Bitcoin may be primed for a rejection from here given its price positioning below $10.800, I don’t think the rejection will be as strong as the one in mid-July 2019.
In fact, should a retrace occur from this point, it would likely be a more shallow retrace than before, perhaps suggesting that the $10.800 resistance is weakening.
Another positive development is that this Quarterly Close invalidated the series of consecutive Quarterly Close Lower Highs dating back to late 2017. This small technical change has important psychological implications.
It means investors are no longer willing to consistently sell Bitcoin at lower and lower prices on a Quarterly basis; instead the sell-side pressure revolves around a particular price point (i.e. ~$10.800).
All in all, if BTC wants to reverse this bearish price positioning, it will need to claim $10.800 as a support and keep it that way until the Quarter 4 candle close.
Bitcoin (BTC/USD) - Monthly View
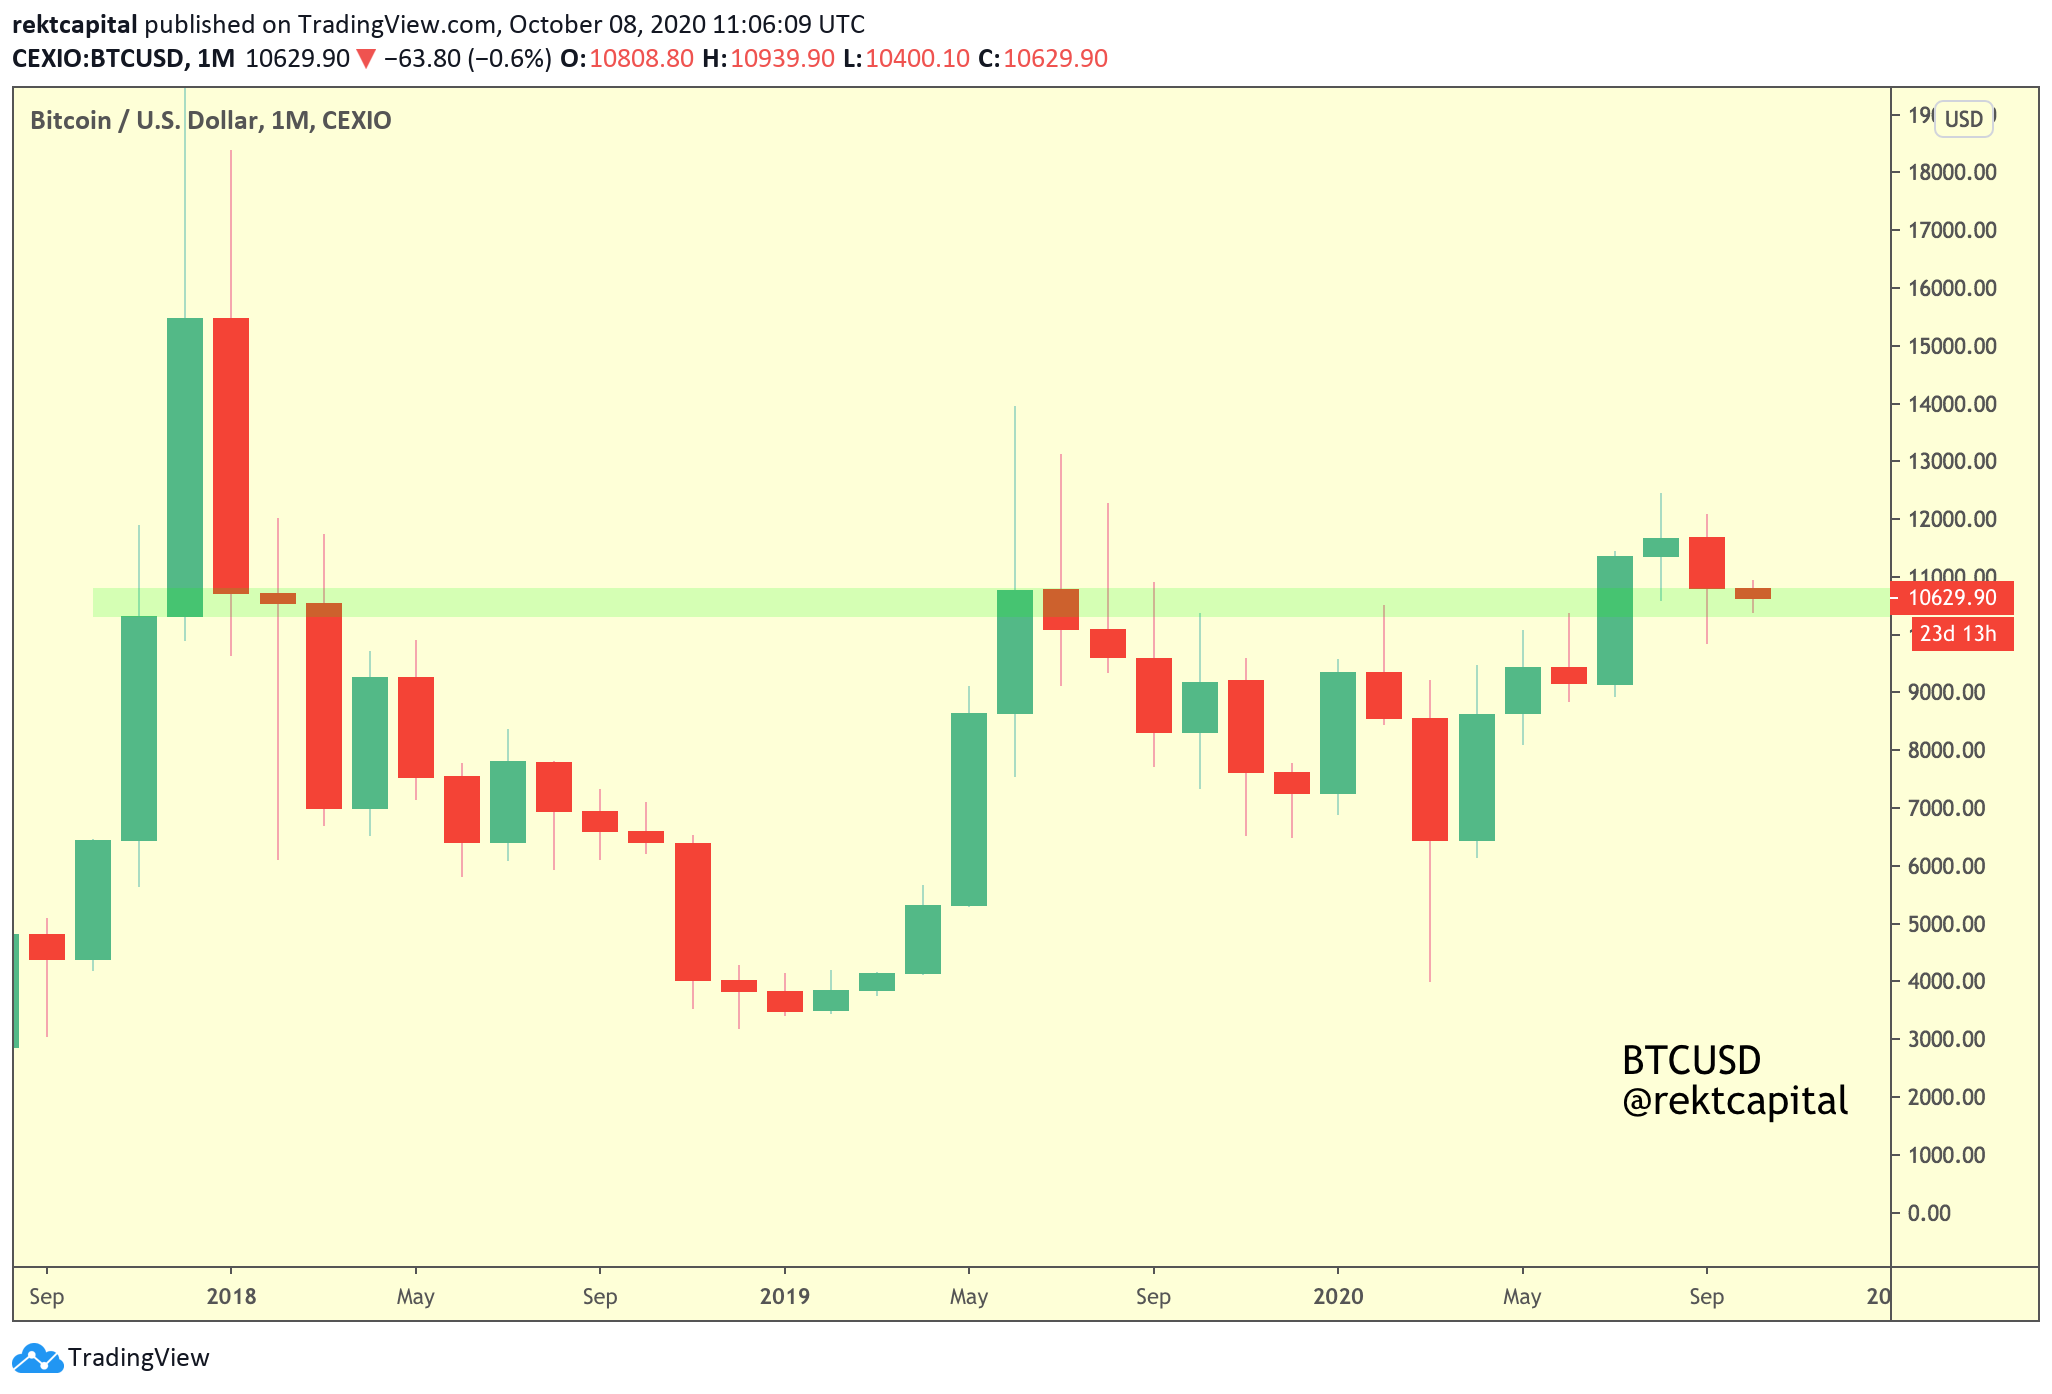
In July 2020, Bitcoin broke past the $10.300-$10.800 area (green).
In August, it claimed this area as a new support region.
In September, Bitcoin continued its stability here despite having to downward wick in an effort to absorb some buy pressure and ensure this price-strength confirmation remains intact.
Now it’s October and Bitcoin continues to showcase price stability here. And as long as it continues to do so, Bitcoin won’t retrace into the $9000s.
But on a separate note: this is the fourth consecutive month that Bitcoin has stayed above or (at the very least) within this $10.300-$10.800 support area.
The last time price was able to hold this area as support was in early 2018 and it didn’t hold it for long before breaking down to lower levels.
This is evidence that the psychological price of $10,000 has indeed strengthened over the years as an emotional inflection point for investors.
Bitcoin (BTC/USD) - Weekly View
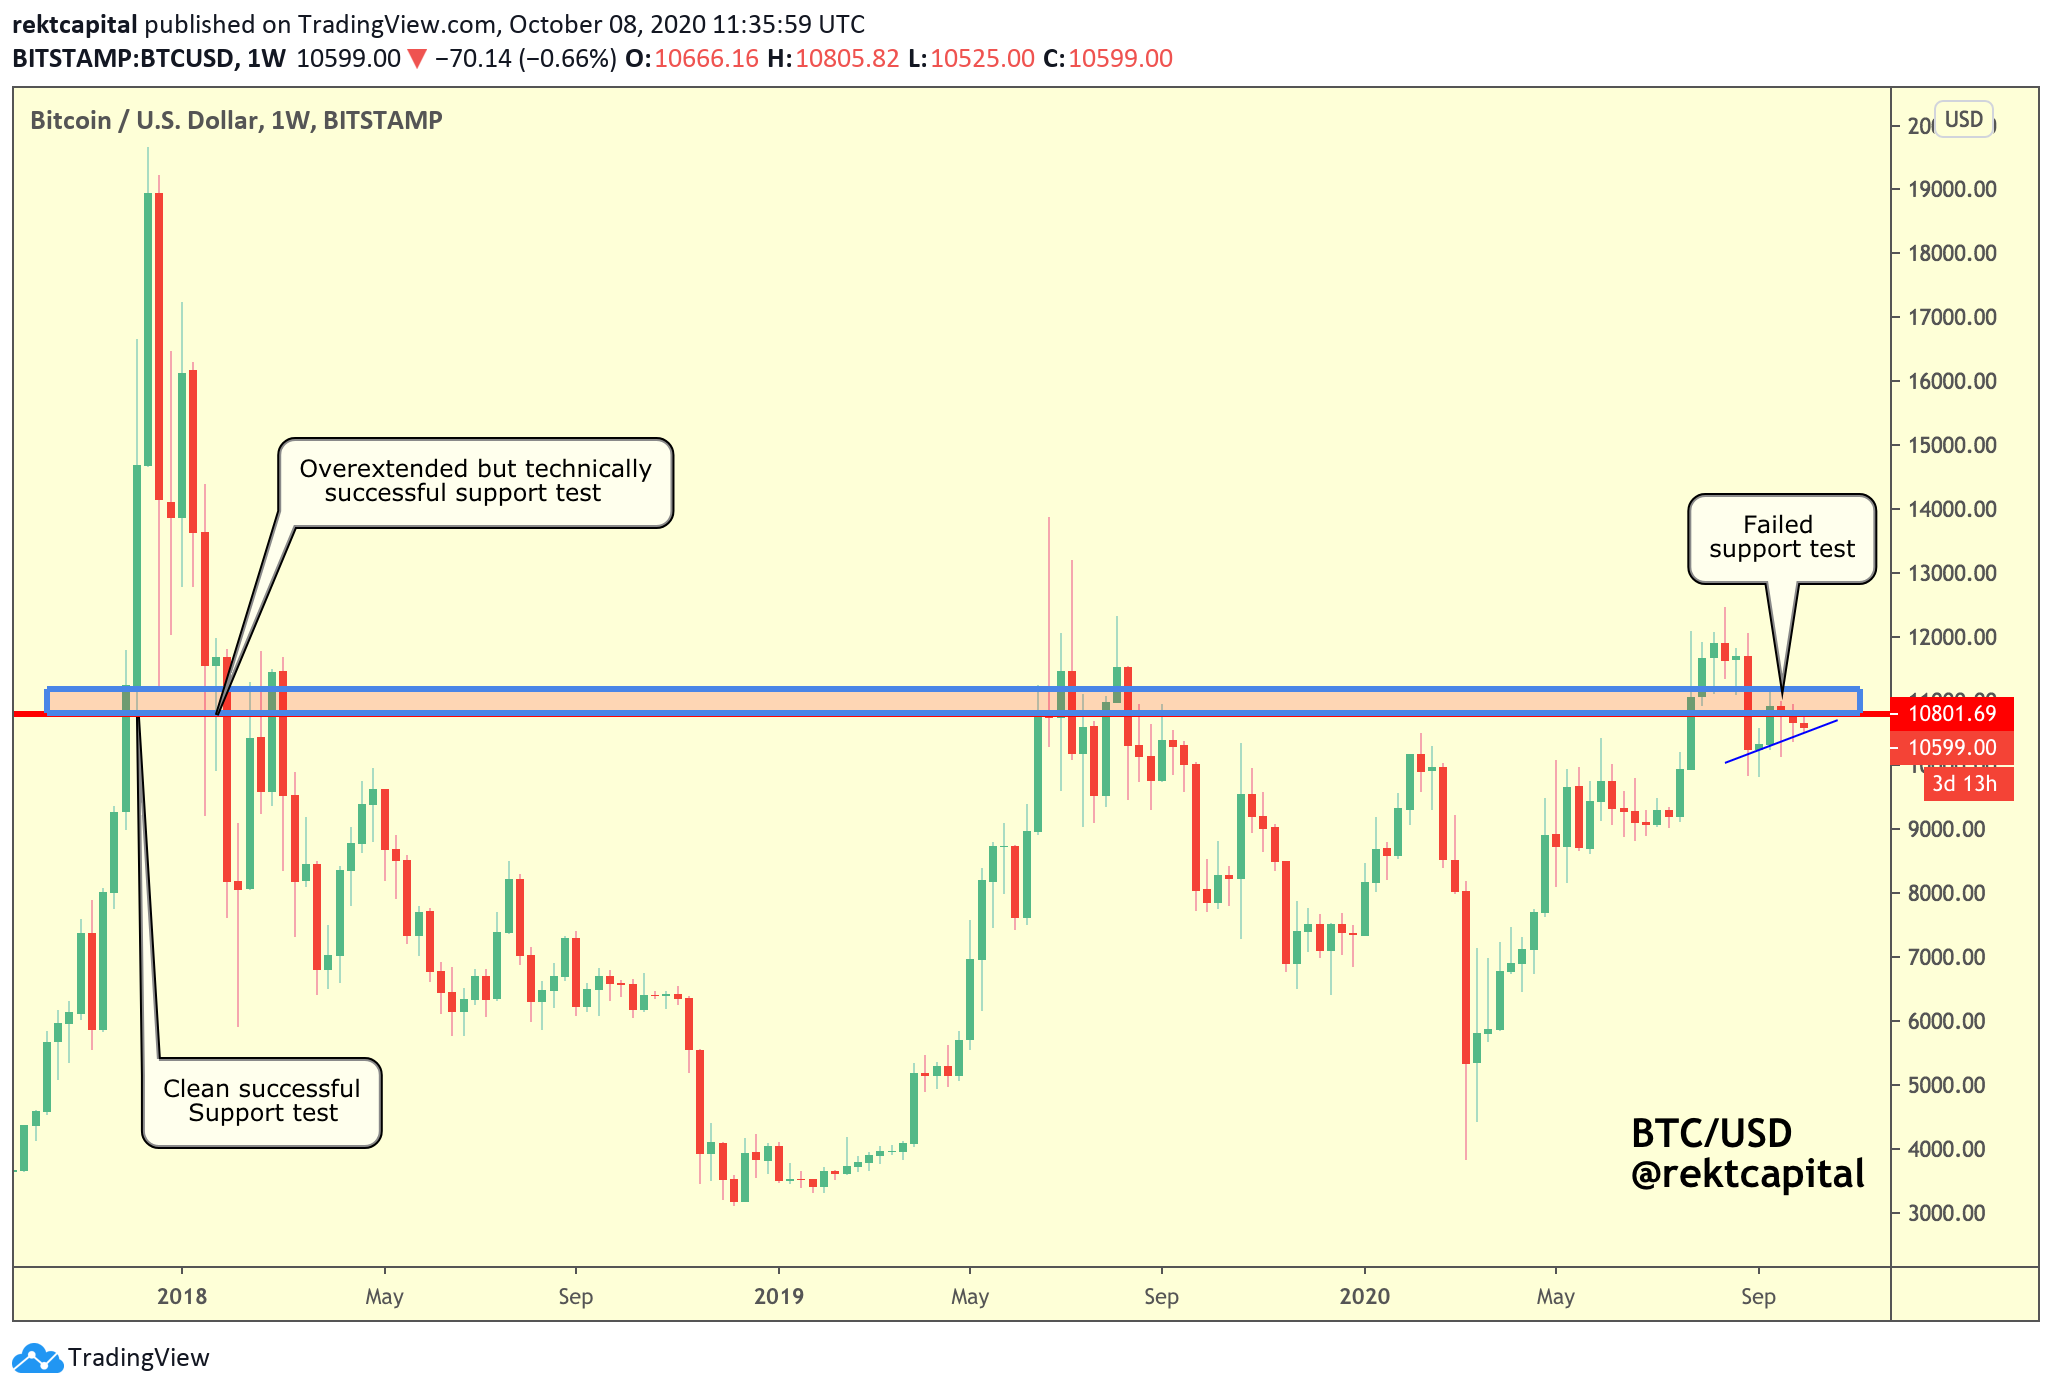
Though the $10.800-$11.200 Weekly resistance area is the one that has been weighing down on price, it is $10.800 that has historically been the gatekeeper to breakouts.
Moreover, the $10.800 level has only ever been successfully claimed as support on the Weekly twice.
The first time happened in late 2017 where price saw a picture-perfect support claim of $10.800 before rallying to new All-Time High of $20,000.
And the second (and so far last time) was when price was in the post-ATH bear market, where Bitcoin overextended past $10.800 into lower price levels, but ultimately Weekly candle closed above $10.800 - but to little avail as price broke down harshly the following week.
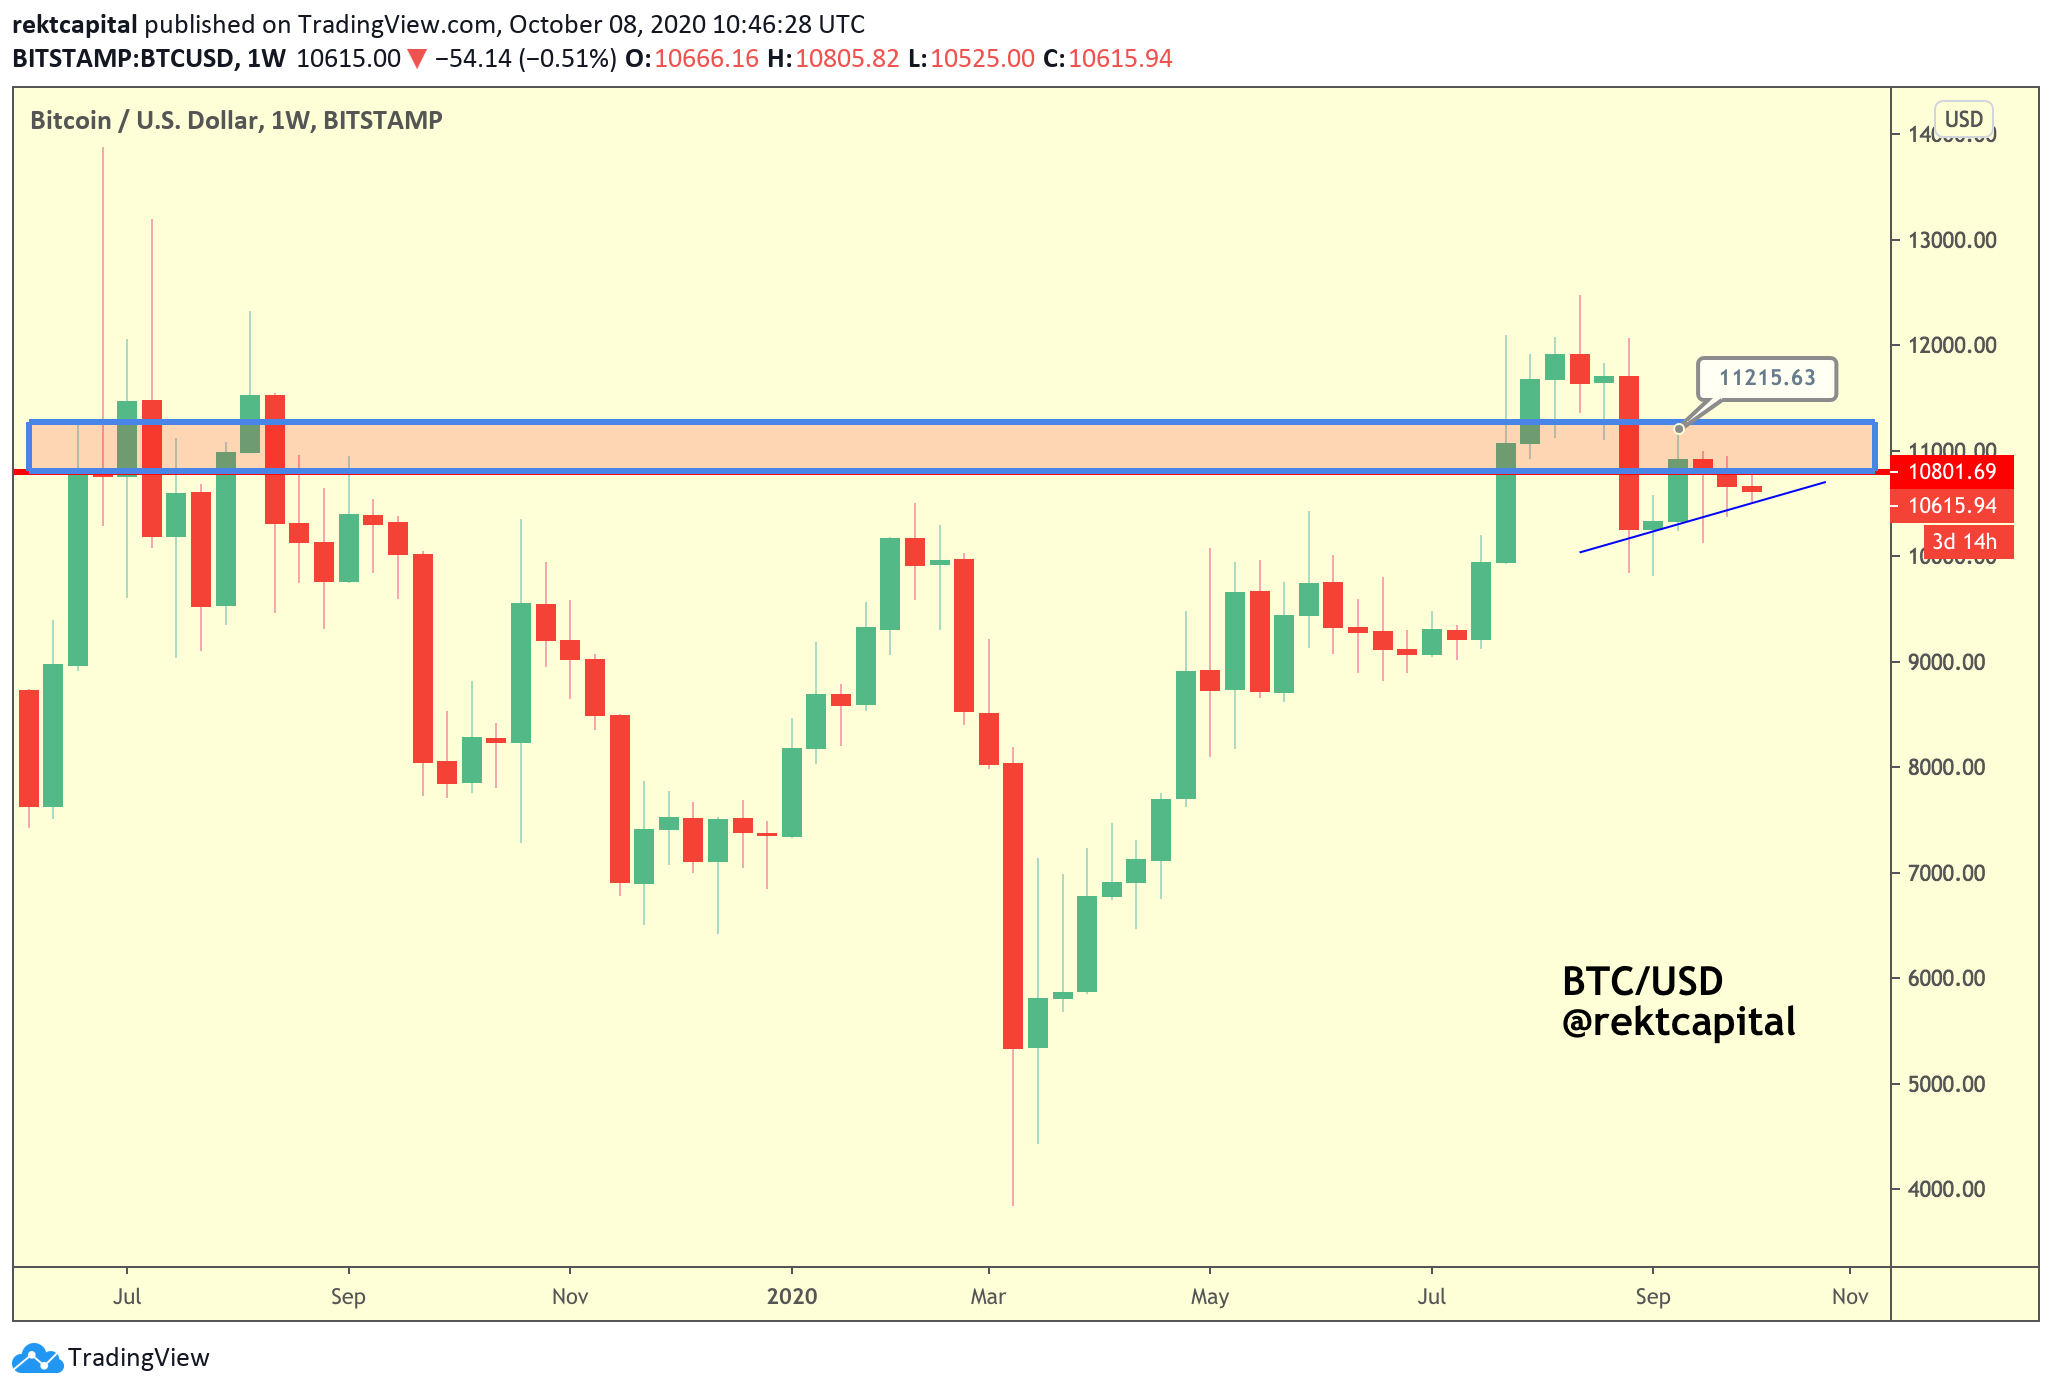
In fact, Bitcoin tried to claim $10.800 as support two weeks and even managed to Weekly candle close above this level but broke down the following week.
So the $10.800-$11.200 continues to weigh down on price. But buyers are still happy to “buy the dip” whenever prices retraces from $10.800 as evidenced by the Weekly Higher Low (blue uptrend line).
Price is being sandwiched between these two key levels and will dictate directional bias.
But price to be bullish, it would need to continue to hold the Weekly Higher Low and turn $10.800 into a support.
Let’s zoom into the Daily and talk about Bitcoin’s historically recurring price tendencies after each of the Bitcoin Halvings.
Post-Halving Price Tendencies - Analysis
One of the most important historically recurring price tendencies that Bitcoin has showcased after each and every Halving thus far is that:
Bitcoin tends to form Re-Accumulation ranges after the Halving.
After price breaks out from the Re-Accumulation range: another range above the Re-Accumulation range forms.
During this new range, price retraces towards the Range High of the Post-Halving Re-Accumulation range for a retest attempt before continuing higher.
Based on this recurring tendency in Bitcoin’s price, on September 10th I posted the following tweet:
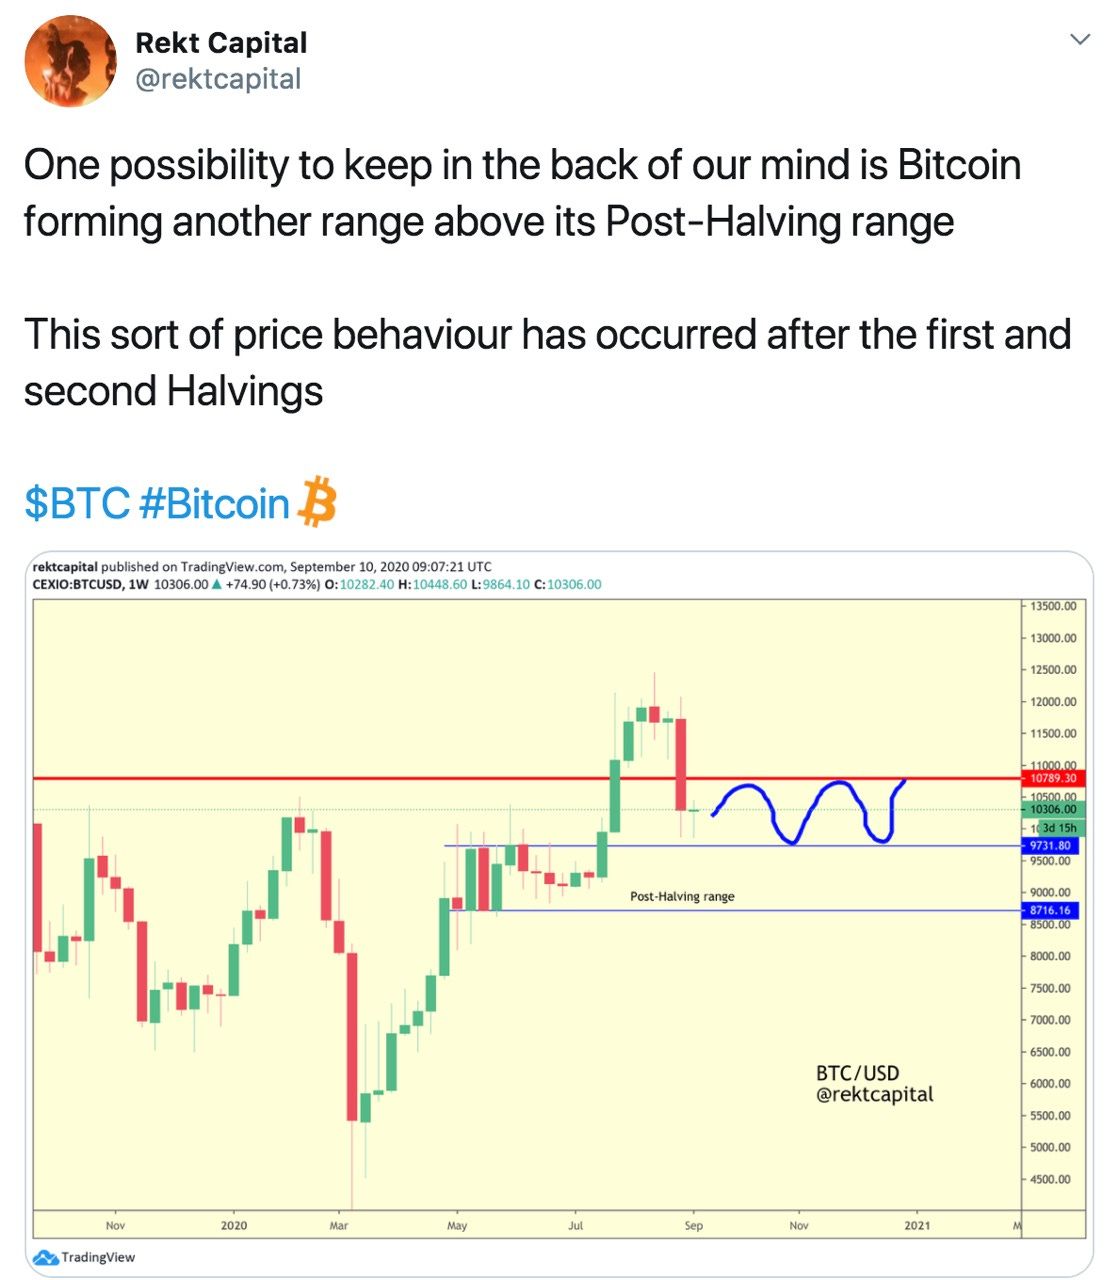
Almost a month later, here’s an update to that tweet:
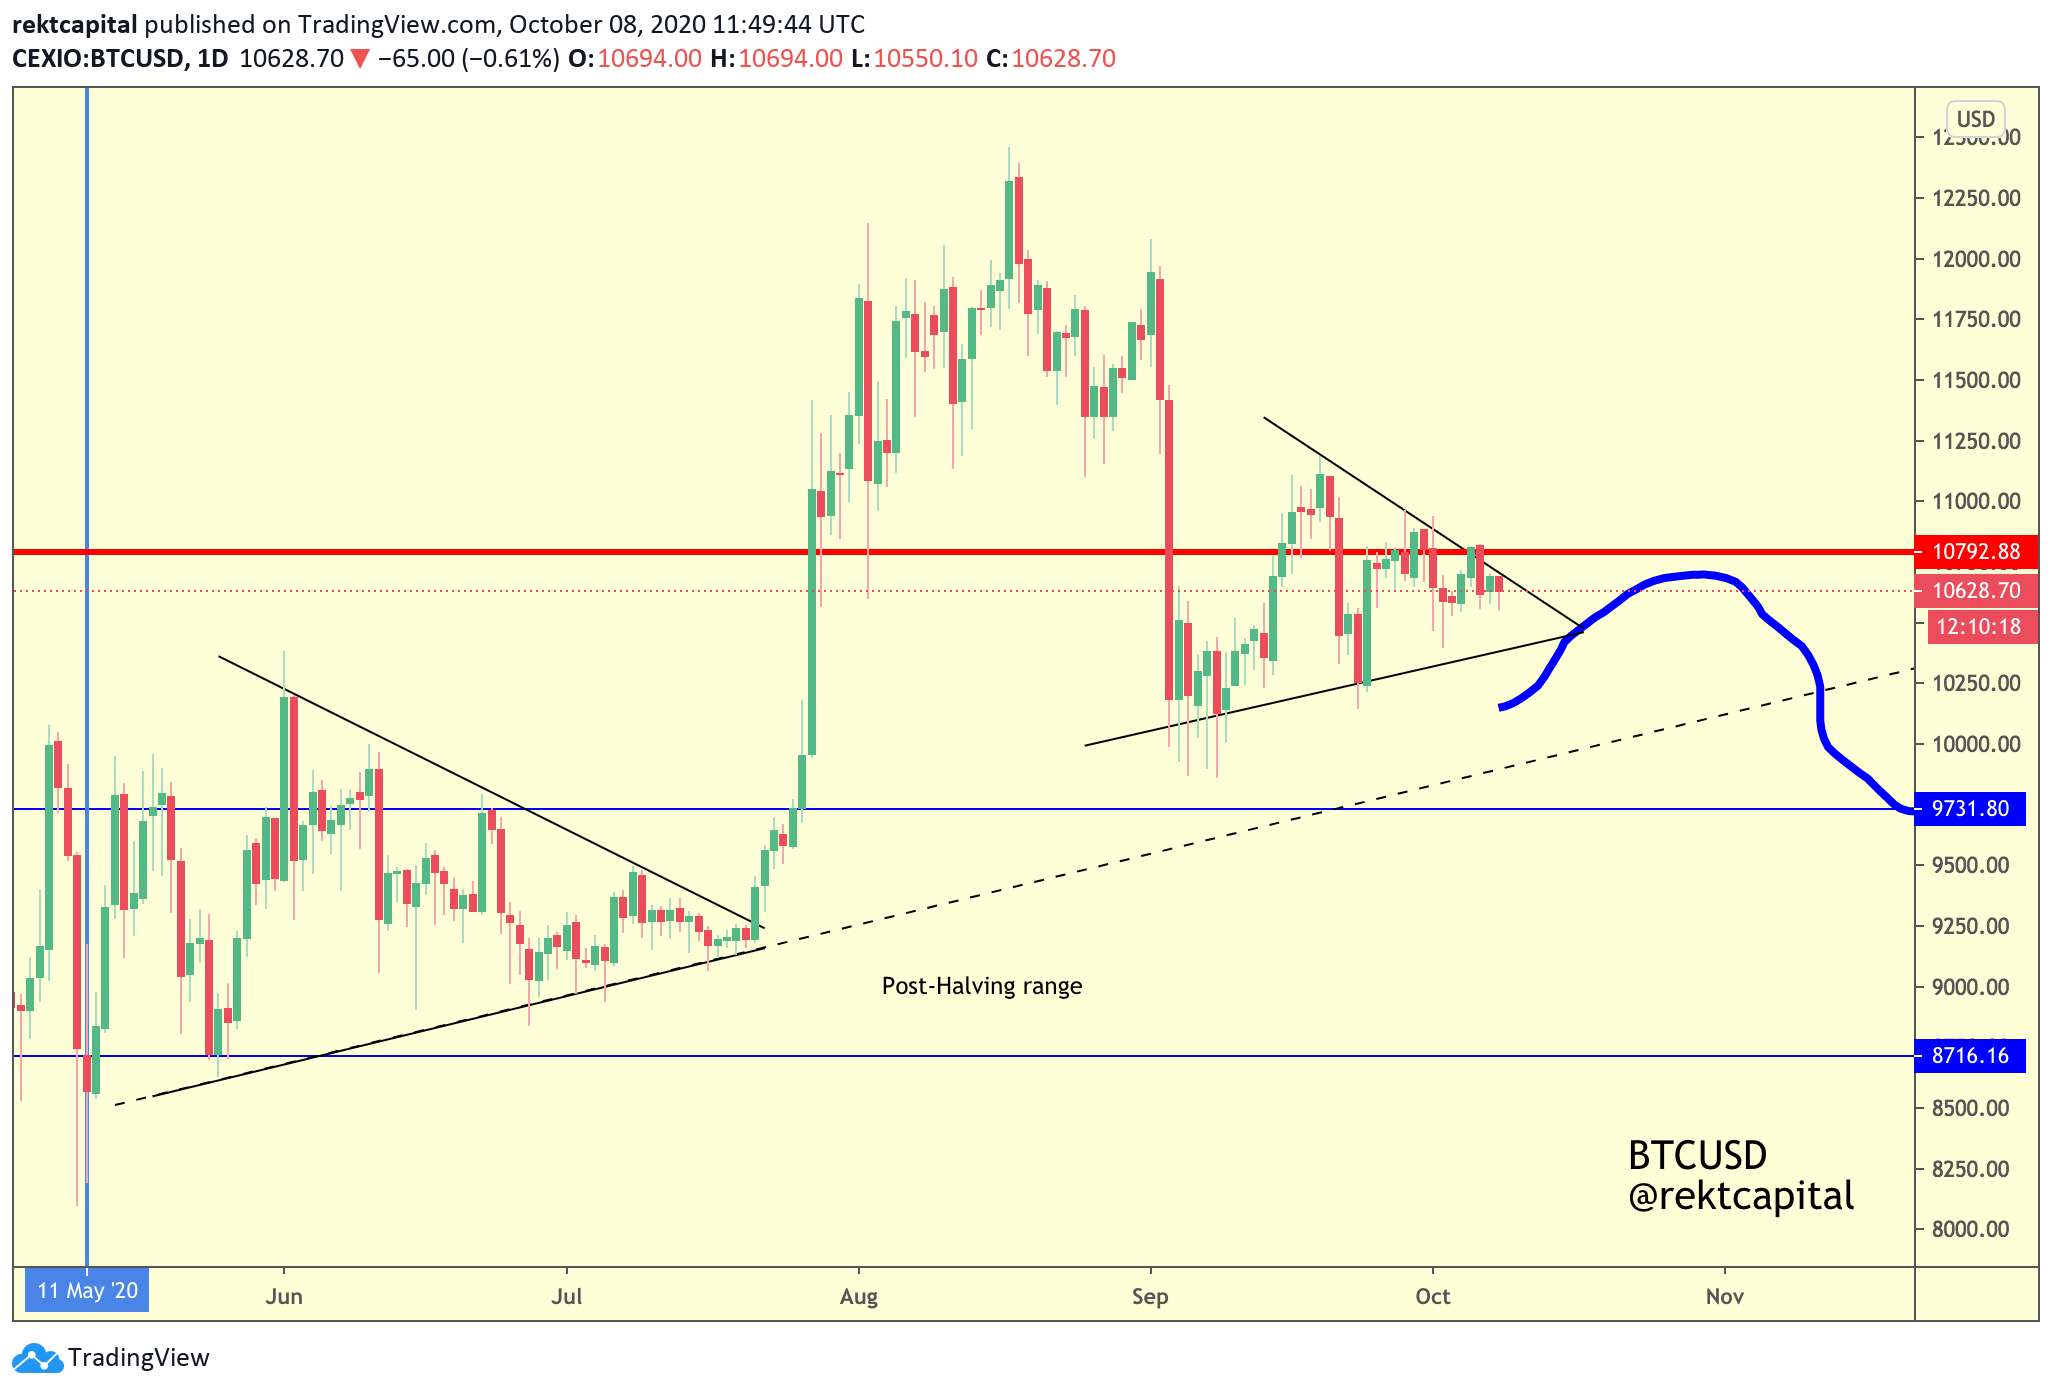
Bitcoin has indeed consolidated in a range above the Post-Halving range. One could argue that the range above the Post-Halving range is $9650-$11200 and price is merely forming a symmetrical triangle in the meantime.
So theoretically, even a break down from this symmetrical triangle wouldn’t necessarily mean that the Post-Halving price tendencies have been invalidated. Because that would mean that price is merely consolidating above the Post-Halving range, following through on the blue pathway.
My gripe lies in the following fact:
- The Range High of the Post-Halving range (i.e. ~$9650) was not tested as support
Historically, successful retests of the Post-Halving Range High have preceded uptrends
Therefore the $9650 level (which happens to coincide with the unfilled CME gap) has been untapped.
Breaking down from the symmetrical triangle wouldn’t only enable further consolidation above the Post-Halving range (i.e. $9650) but it would also open up the possibility for the Range High of the Post-Halving range to be tested as support properly.
The Daily Symmetrical Triangle: Breakout or Breakdown?
We’ve established that a potential symmetrical triangle breakdown wouldn’t necessarily be a bearish turn of events for price as it would be a gateway for price to properly follow through on its historical Post-Halving price tendencies.
But how likely is this breakdown?
What’s important to note is that Bitcoin formed a symmetrical triangle in its Post-Halving range before breaking out to $12.400 in the same way that price is now forming a symmetrical triangle within its new range above the Post-Halving range.
That being said, the Post-Halving range symmetrical triangle formed in an uptrend.
This current symmetrical triangle has formed after a harsh breakdown from ~$12,000 and is forming in a corrective period.
I’m cautious about this symmetrical triangle because we tend to see actual Bear Flags form after sharp breakdowns. This symmetrical triangle could very well be a Bear Flag.
In any case, this triangle will dictate directional bias for the next move so the diagonals will be trigger points.
And that’s about it for today — thanks so much for reading the pre-launch bonus issue of the Rekt Capital newsletter. Let me know your questions/feedback in the comments!
I’ll be publishing one last free pre-launch bonus issue on Saturday: an Altcoin TA session!
So share the Altcoins you’d like me to chart in the comments down below. I’ll chart as many as I can for you on Saturday.
P.S. If you’d like to receive the Rekt Capital straight to your inbox three times a week, feel free to subscribe for an early-bird discount of less than 0.50 cents per newsletter. Early-bird discount ends next week.