The Three Bitcoin Triangles
A Story of Recurring Price Action Across History
Welcome to the Rekt Capital newsletter, a place for people who want to better navigate the crypto markets with the help of cutting-edge crypto research and unbiased market analysis.
A Story Of Three Triangles

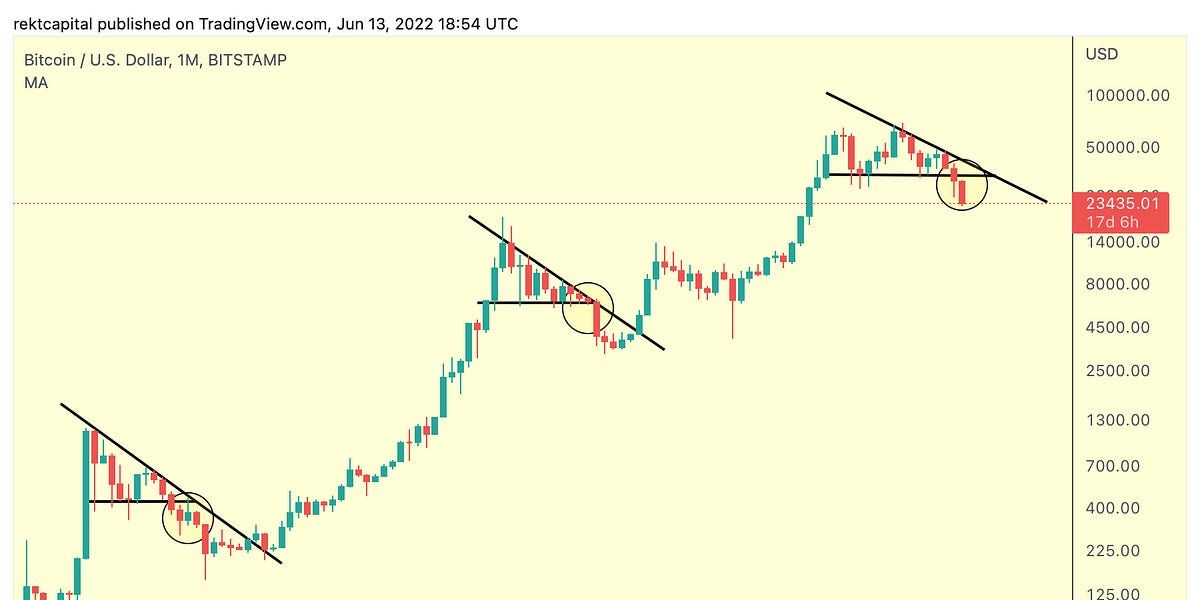
Historically, Bitcoin has formed three macro Descending Triangles.
Once the bases of those Descending Triangles have formed, price has accelerated in the downtrend in search of a generational bottom.
Once that bottom has been reached, price would then consolidate for as long as it took for price to recover back above the Macro Downtrend line.
Currently, it appears that BTC is in the acceleration phase of its downtrend, following the Descending Triangle breakdown.
BTC is searching for an absolute bottom.
How much lower could price go?
Historically, BTC has retraced -50% to -65% below the Descending Triangle bottom:
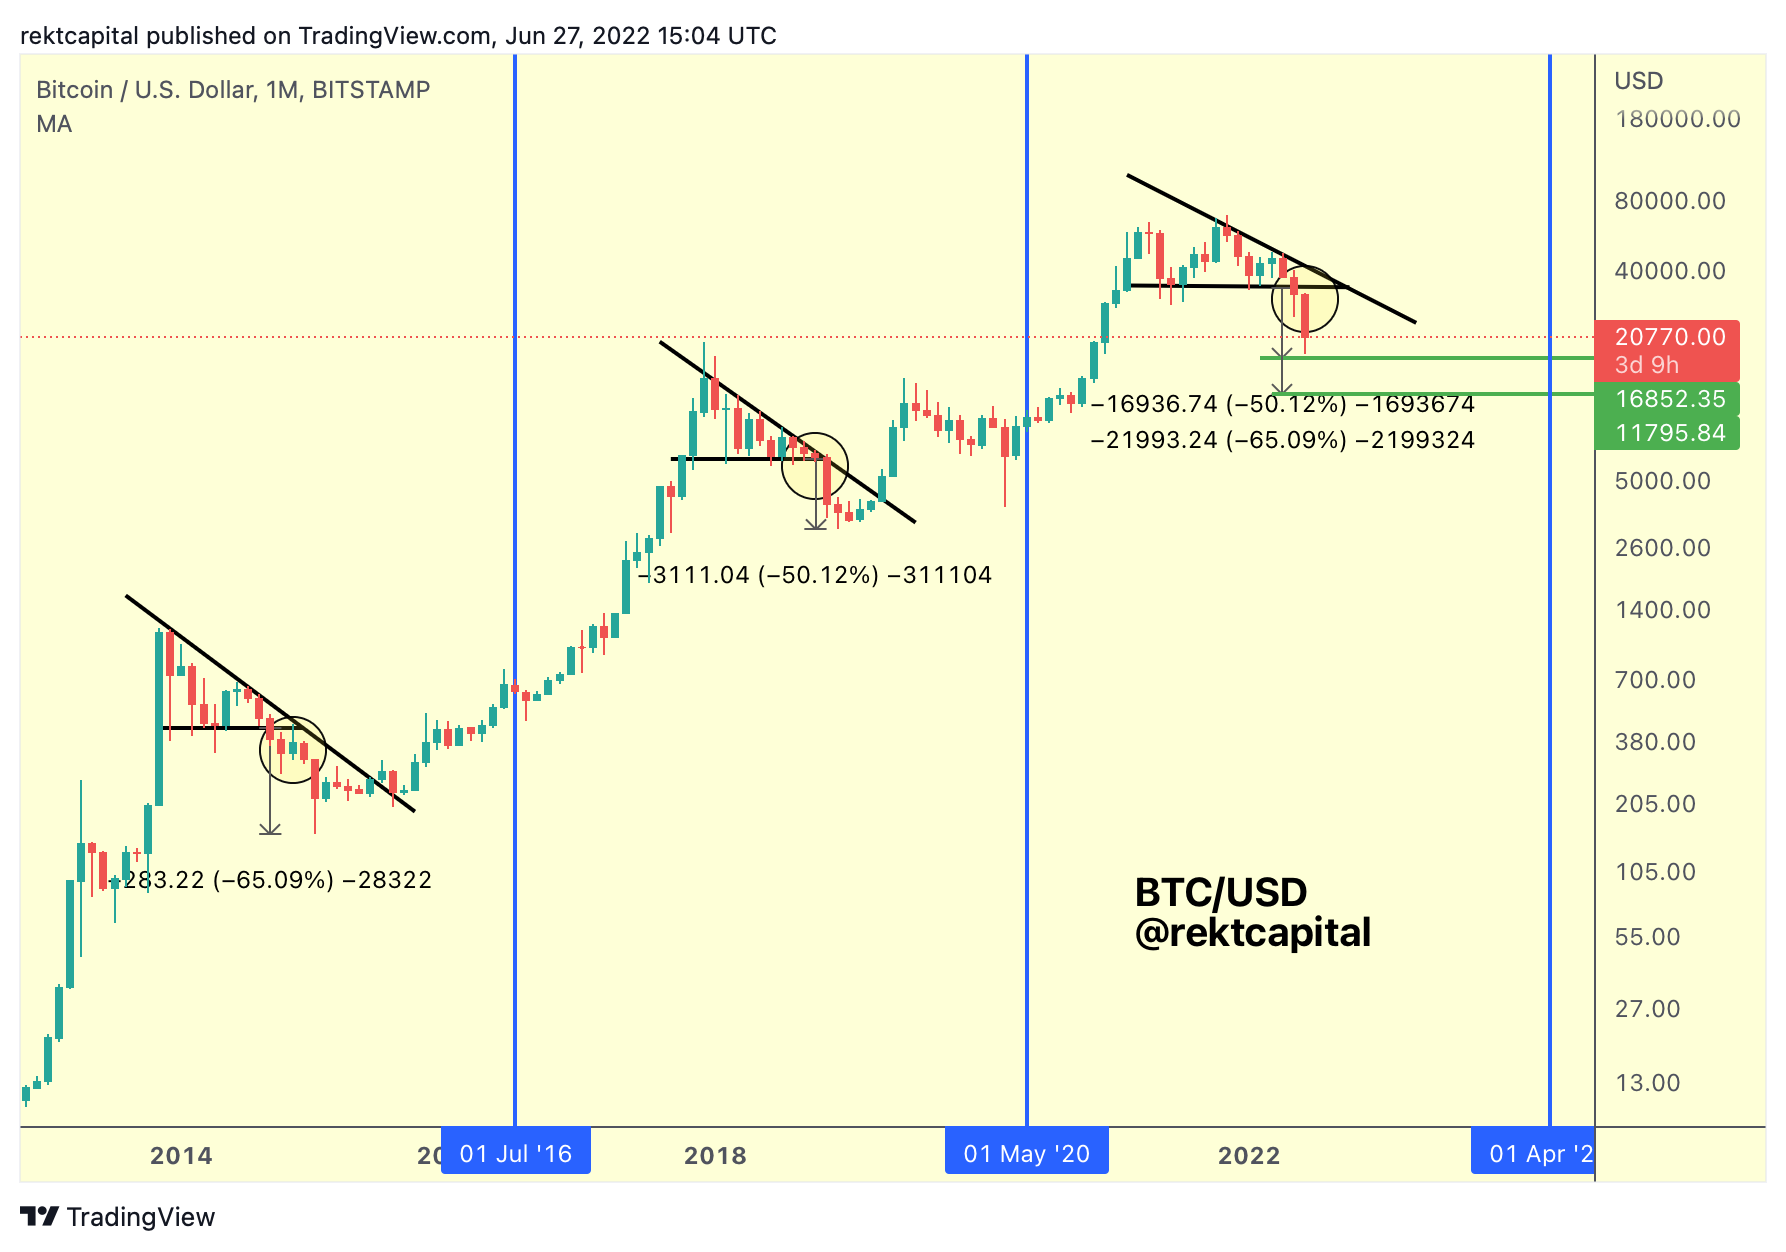
Thus far, BTC has retraced -49%, which means that BTC has already tagged a historical level at ~$17000.
This perspective however suggest price could drop as much as an extra -15% to meet the -65% historical retracement mark which would tag the ~$11800 level which would in total round up to a -84.5% Bear Market correction ( i.e. an average historical Bitcoin Bear Market correction).
The other thing about these Three Triangles is that after the acceleration phase where the downtrend picks up momentum in an effort to find a generational bottom, price then spends time in a consolidation phase which tends to be lengthy.

After a generational bottom has been established, BTC has spent anything between 121 to 181 days consolidating until BTC breaks out beyond the Macro Downtrend.
BTC hasn’t yet found its bottom and with only a few days left in the month, it’s unlikely BTC will find it in June - but let’s assume it does for the sake of discourse:
If it takes 121-181 days for price to finish up its bottoming phase and consolidation phase, BTC could attempt to breakout beyond the Macro Downtrend in October 2022 (121 days scenario) or December 2022 (181 days scenario).
Generally however, the Macro Downtrend breakout will be the confirmation signal for a new Macro Uptrend.
Until then, price still needs to give us a a) bottom to end the downtrend acceleration phase and b) a period of lengthy consolidation which is needed to bring us closer to the Macro Downtrend.
Another way to look at this is through the lens of the Halvings:
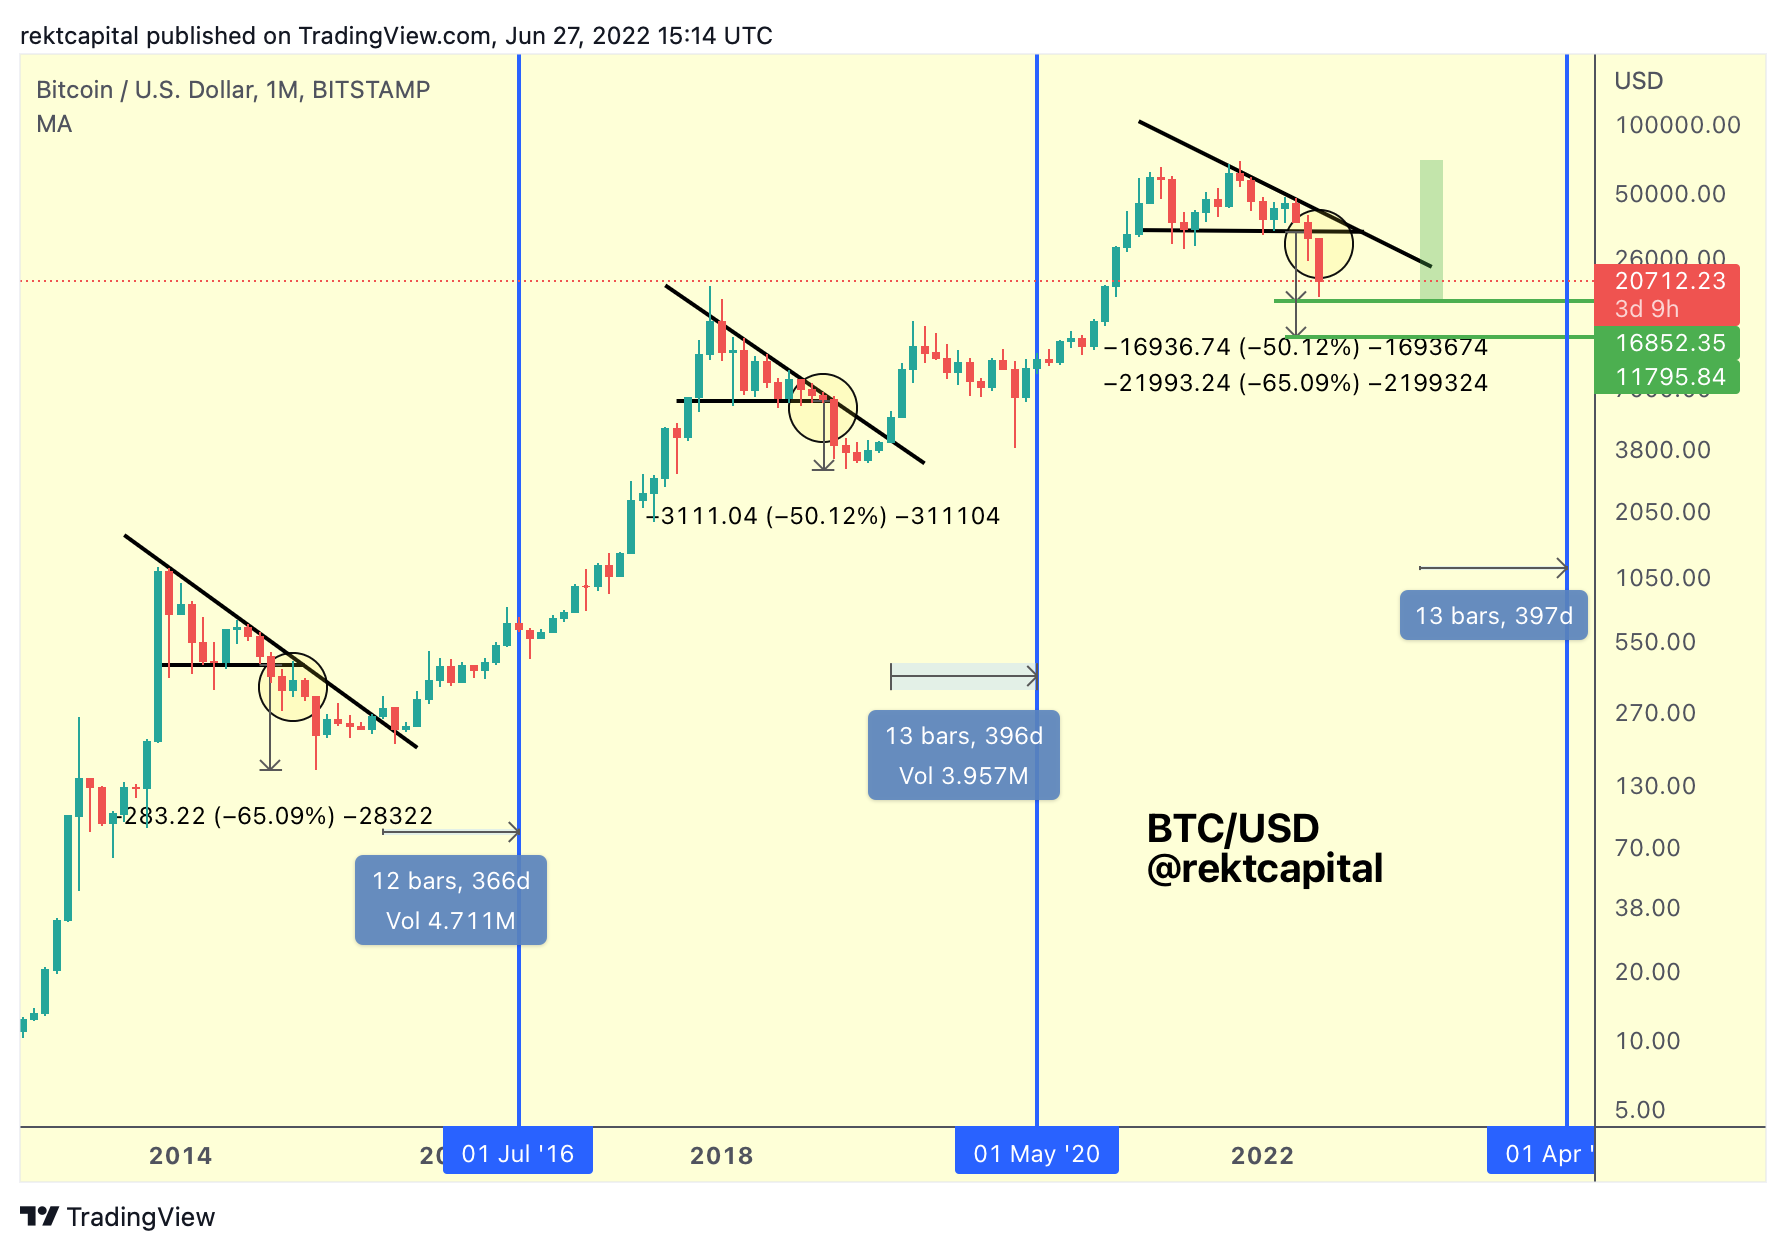
BTC tends to breakout beyond the Macro Downtrend 366-396 days before the next upcoming Halving.
In which case BTC could breakout in March 2023 or April 2023.
Which means that there is plenty of time still for BTC to enjoy lengthy consolidation until that new Macro Uptrend begins via a breakout beyond the Macro Downtrend.
Until then however - Bitcoin is still in search of a generational bottom.