The Puell Multiple - Historical Trends
Using data science to time the Bitcoin bottom

Welcome to the Rekt Capital newsletter, a resource for people who want to better navigate the crypto markets with the help of cutting-edge crypto research and unbiased market analysis.
I write research articles just like this one every Monday and Wednesday for subscribers of the Rekt Capital newsletter. Friday’s feature TA on a wide-variety of Altcoins.
Today’s edition is an analysis of Bitcoin’s price action in the context of the Puell Multiple data science indicator and is free to everybody to read. The previous free edition of the RC Newsletter was published two months ago on April 26th.
If you’d like to receive cutting-edge research like this straight to your inbox - feel free to subscribe for $10 a month:

The Puell Multiple
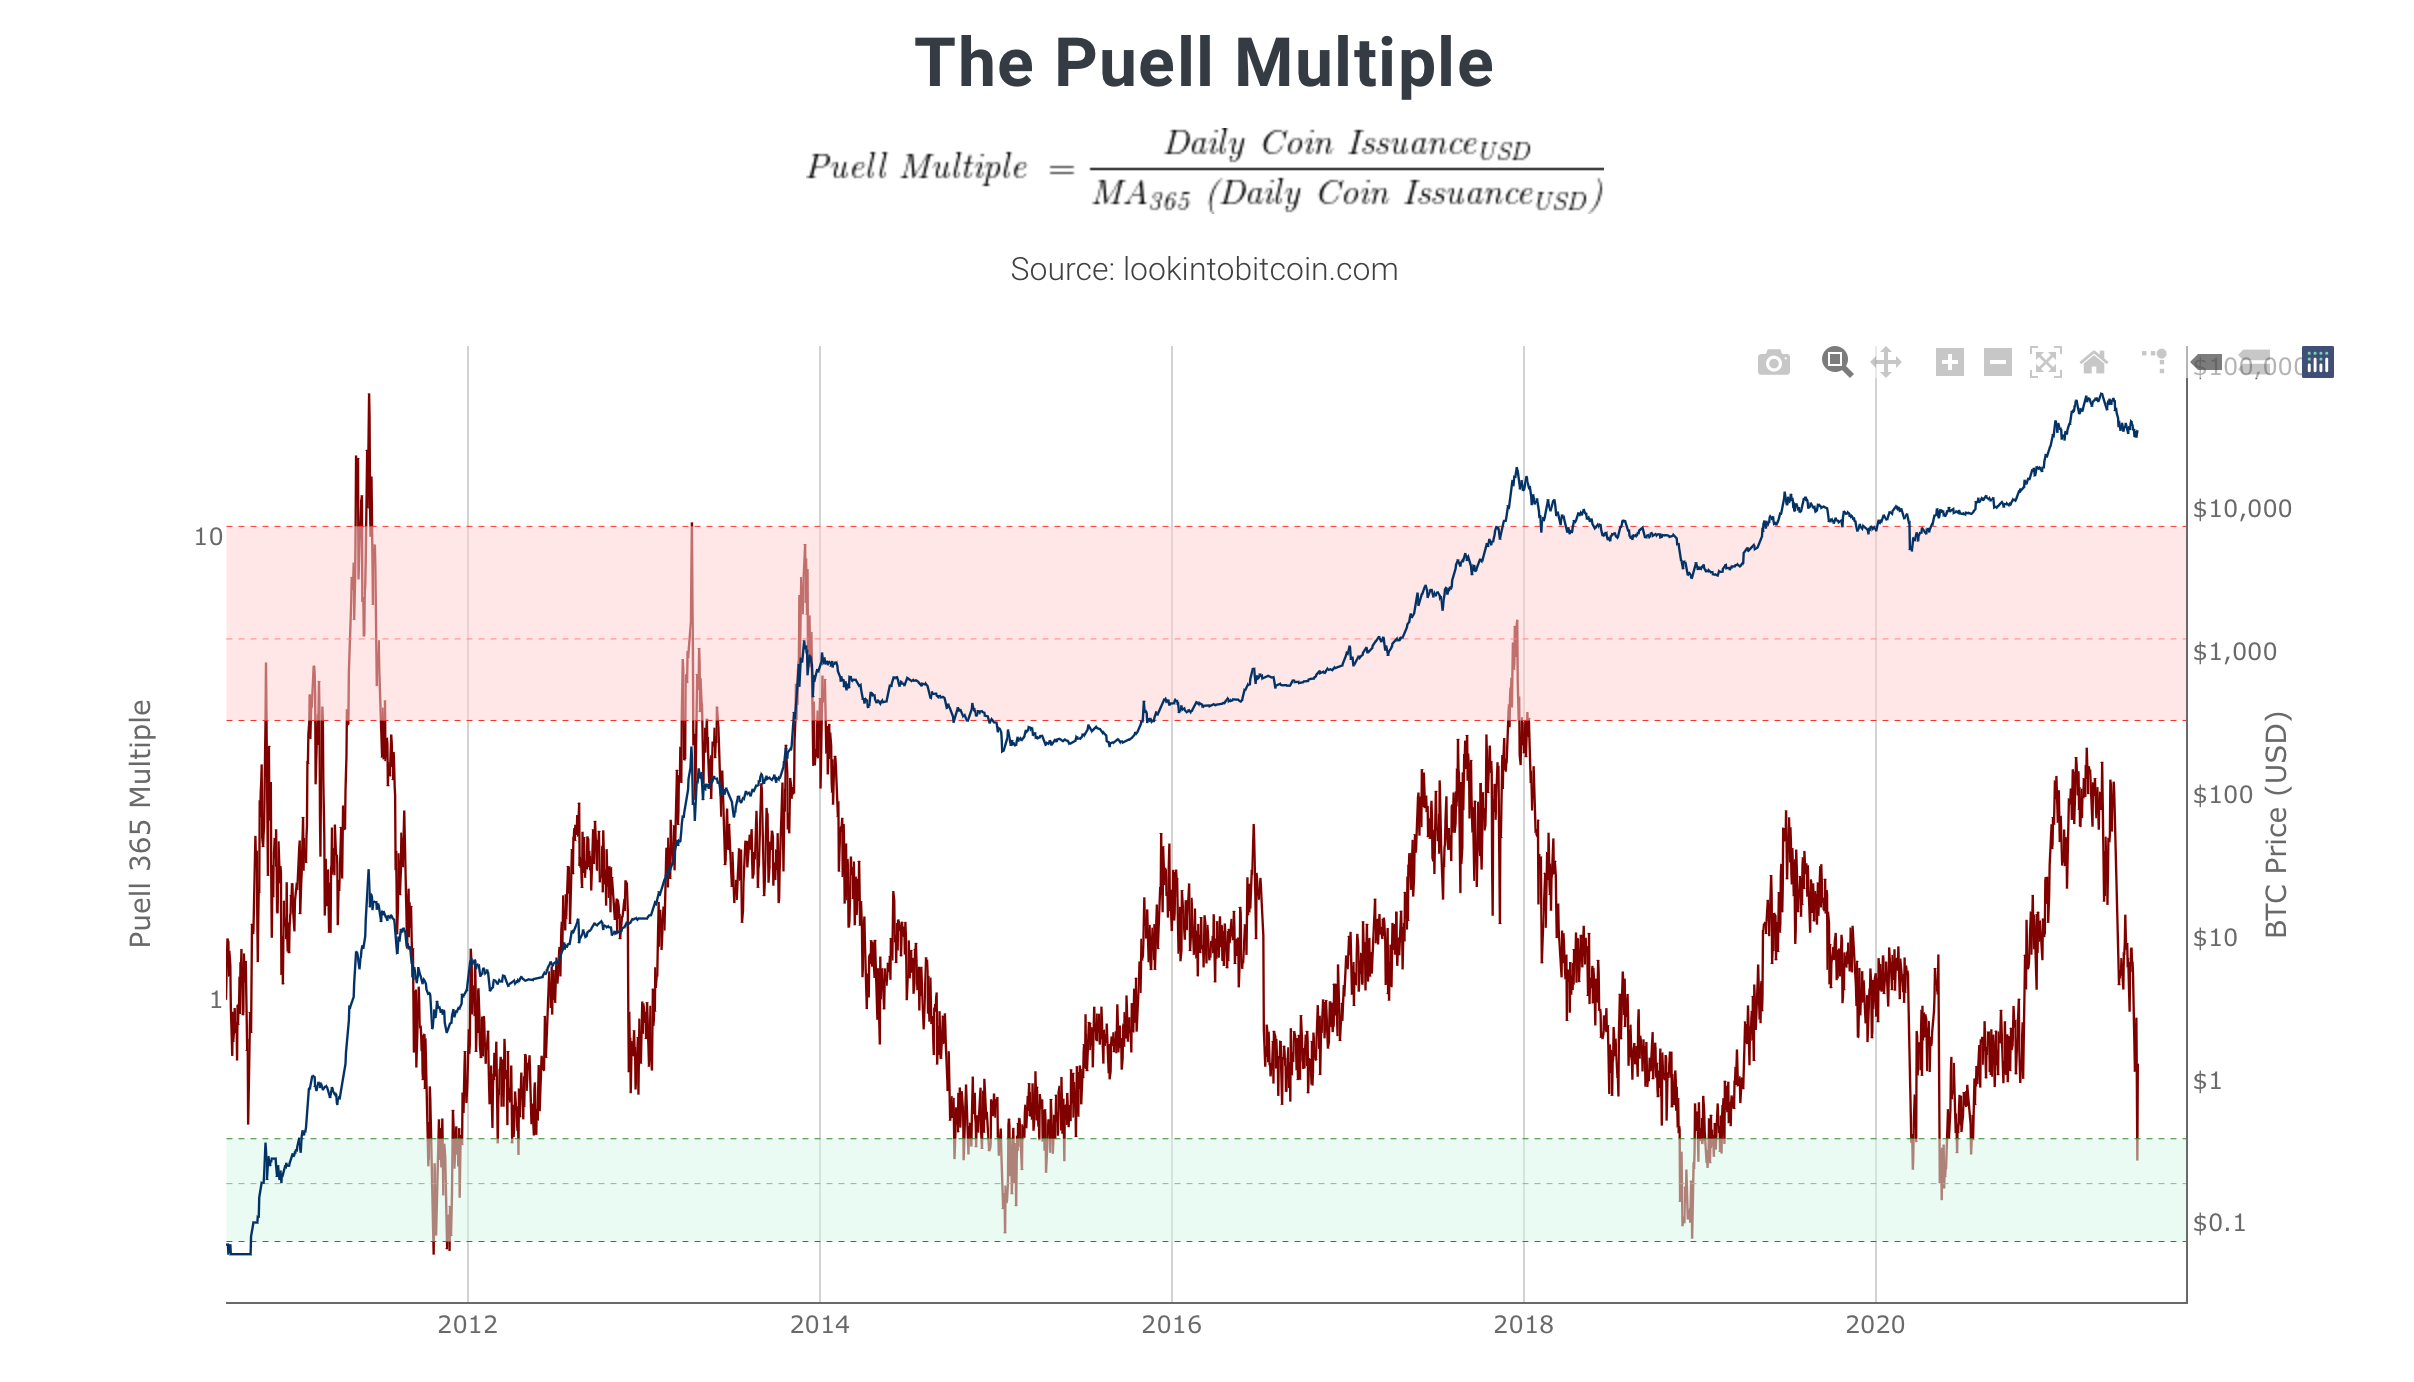
The P-Multiple is a historically reliable data science indicator that highlights significant changes in Miner Psychology.
Specially, the green area corresponds to moments in time where miners become increasingly fearful of becoming unprofitable:

This shift in psychology is akin to Miner Capitulation, though a little more nuanced because no actual capitulation is taking place.
Instead, the price of BTC is sufficiently low to instil fear into the minds of miners, whereby they offload portions of their BTC holdings to finance their businesses and offset their fixed costs (most notably, their machinery to mine BTC).
In other words - the value of Bitcoin’s issued on a daily basis is very low.
Historical Trends In The Puell Multiple
Historically, the P-Multiple has only ever reached the green on five separate occasions, including now.
However, it must be emphasised that merely reaching this area doesn’t mean Bitcoin has necessarily bottomed. It just means that BTC is undervalued:

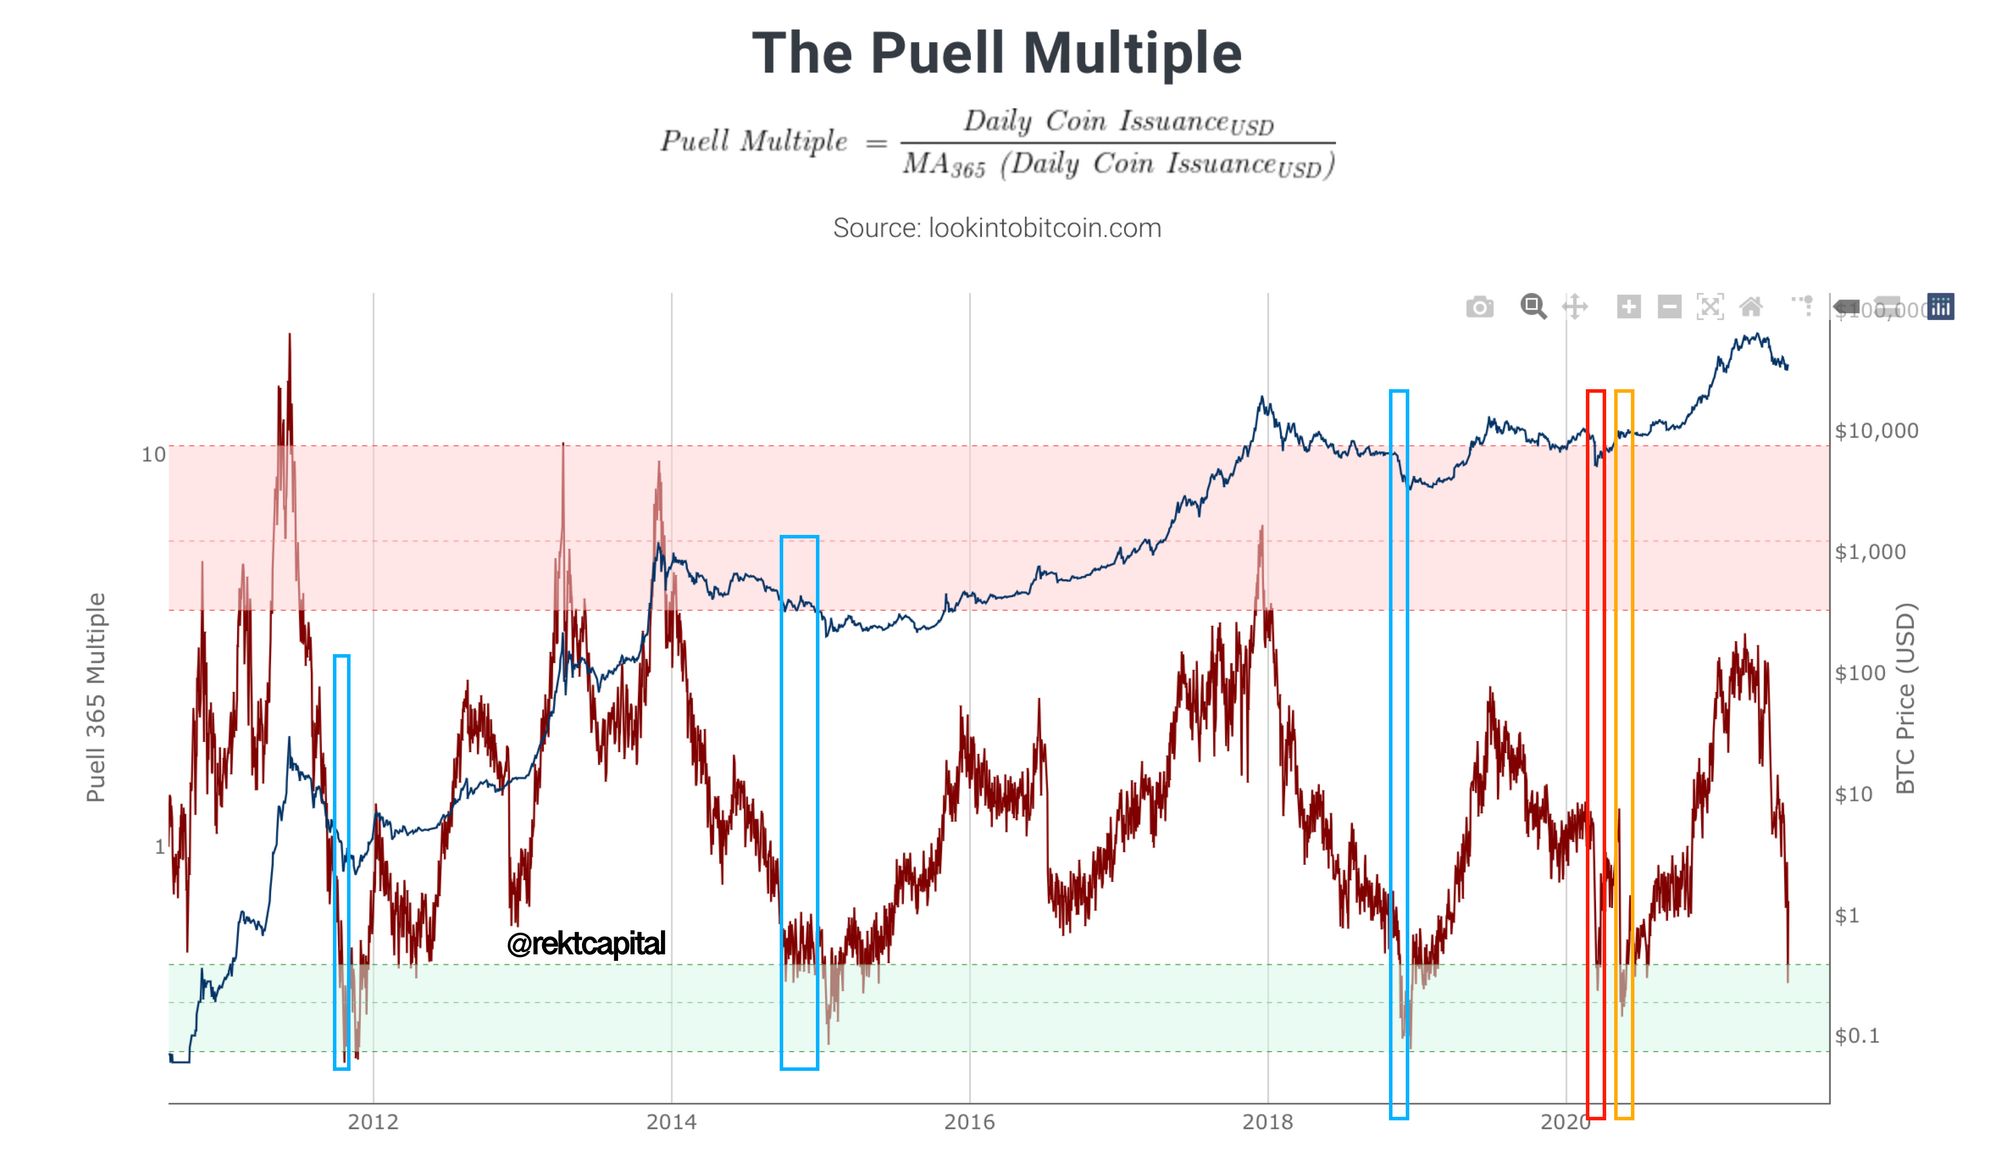
The blue boxes showcase the initial arrival of the P-Multiple into the green area as well as the price of Bitcoin at that time.
The blue boxes show that the first bottoms in the green area on the P-Multiple don’t correspond to bottoms in Bitcoin’s price.
In fact, it is actually the second bottom in the P-Multiple that corresponds to a bottom in Bitcoin’s price.
The bottoms in BTC’s price represent entire Market Cycle bottoms (i.e. Bear Market Bottoms) and precede the beginnings of new Accumulation ranges.
Interestingly, the red box represents the March 2020 crash where BTC bottomed in the high $3000s.
Arguably, this is the only time in P-Multiple history where BTC bottomed on the first revisit in the green area.
However, the yellow box showcases how the second revisit of the green area preceded a new consolidation range (this time a re-accumulation range).
In sum, here are a few P-Multiple principles:
- Generally, the first revisit into the green area fails to precede a bottom in BTC’s price (with one exception: March 2020).
- Generally, the second bottom of the P-Multiple in the green area marks out a bottom in Bitcoin’s price (with one exception: post-March 2020).
- The second P-Multiple bottom in the green area precedes a consolidation range. Generally, this consolidation range has been at Market Cycle lows. However, after March 2020 this range has formed Re-Accumulation ranges above Market Cycle lows. This current revisit of the green area will probably continue this trends as well.
***Rekt Capital Technical Analysis Course***
The TA course features 17 hours-worth of tutorials and complementary webinars that take a deep-dive into topics like the RSI, price action analysis, market psychology, and so much more.
It is these TA techniques and principles that bring me the confidence and level-headedness that makes Rekt Capital content what it is today.
Feel free to checkout the Rekt Capital Technical Analysis course below:
Historical Line of Best Fit
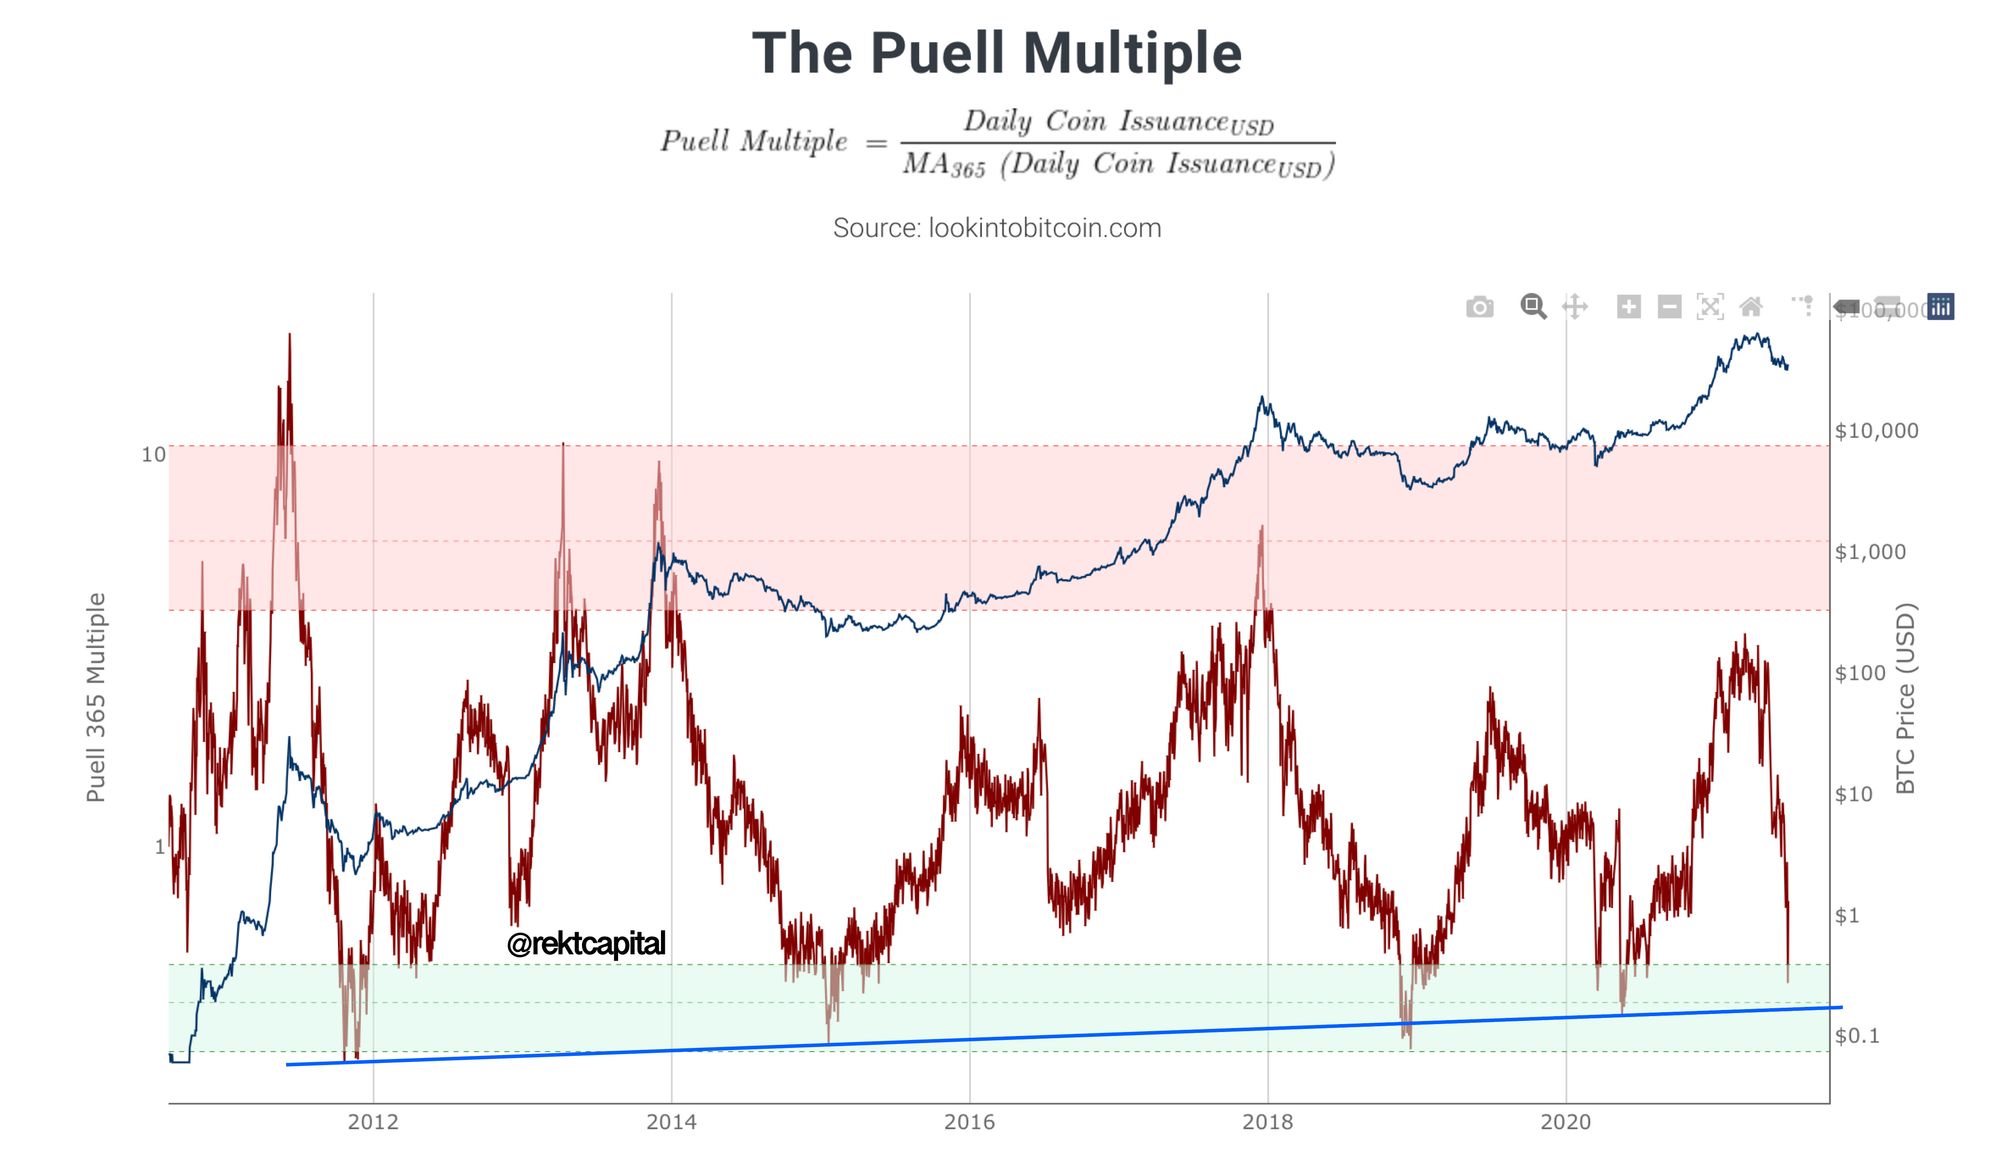
Here’s perhaps a more accurate way to denote the point of maximum financial opportunity for Bitcoin through the lens of the Puell Multiple is with the aid of a historical Higher Low trend line of best fit:

The blue Higher Low here denotes the historical line of best fit, denoting bottoms in the P-Multiple which have highlighted periods where Bitcoin’s price was near its generational bottom.
Touches of this historical trend line have generally preceded bottoms in Bitcoin’s price, especially downside deviations below the trend line like in late 2018.
Clearly, Bitcoin’s price isn’t yet close to touching this vital trendline.
This ties in with the principles mentioned earlier in the newsletter; that the first revisit into the green area for the P-Multiple doesn’t necessarily mark out a bottom in BTC’s price.
What I’ll be Watching For
- Will Bitcoin still maintain its $29000-$39000 range when the P-Multiple touches the historical Higher Low trend line?
- And if BTC is successful in holding its current range, will a potential second touch of the historical trend line take place? (A second touch is rare but when it happens, it’s figured as a confirmation of stability at current BTC prices).
- And if BTC is still holding the current range after a second touch of the trend line, then further consolidation could still take place, but the range will likely hold and the BTC price bottom will have been confirmed to be in, based on the aforementioned historical P-Multiple principles.
Thank you for reading this free edition of the Rekt Capital newsletter.
Hopefully this special edition gave you a powerful idea as to the level of quality, detail, and dedication that you can expect as a valued subscriber of the Rekt Capital newsletter.
I write research articles like this every Monday and Wednesday for subscribers of the newsletter.
So if you’d like to receive cutting-edge research like this straight to your inbox, feel free to subscribe for $10 a month:
P.S.
To valued existing members of the newsletter:
This Friday, I’ll chart your Altcoin picks in a private TA session and will cover approximately 10 Altcoins.
So if you’d like to have an Altcoin charted, feel free to share max. two TA requests each in the comments below.
I’ll chart the Altcoins that get mentioned and ‘Liked’ the most.