The Road To $100k+ Continues
Is $93.5k About To Break?
Welcome to the Rekt Capital Newsletter, a resource for investors who want to better navigate the crypto markets with the help of cutting-edge crypto research and unbiased market analysis.
Weekly Close Beyond the Downtrend
Bitcoin hasn’t moved much in price but structurally - something has changed.
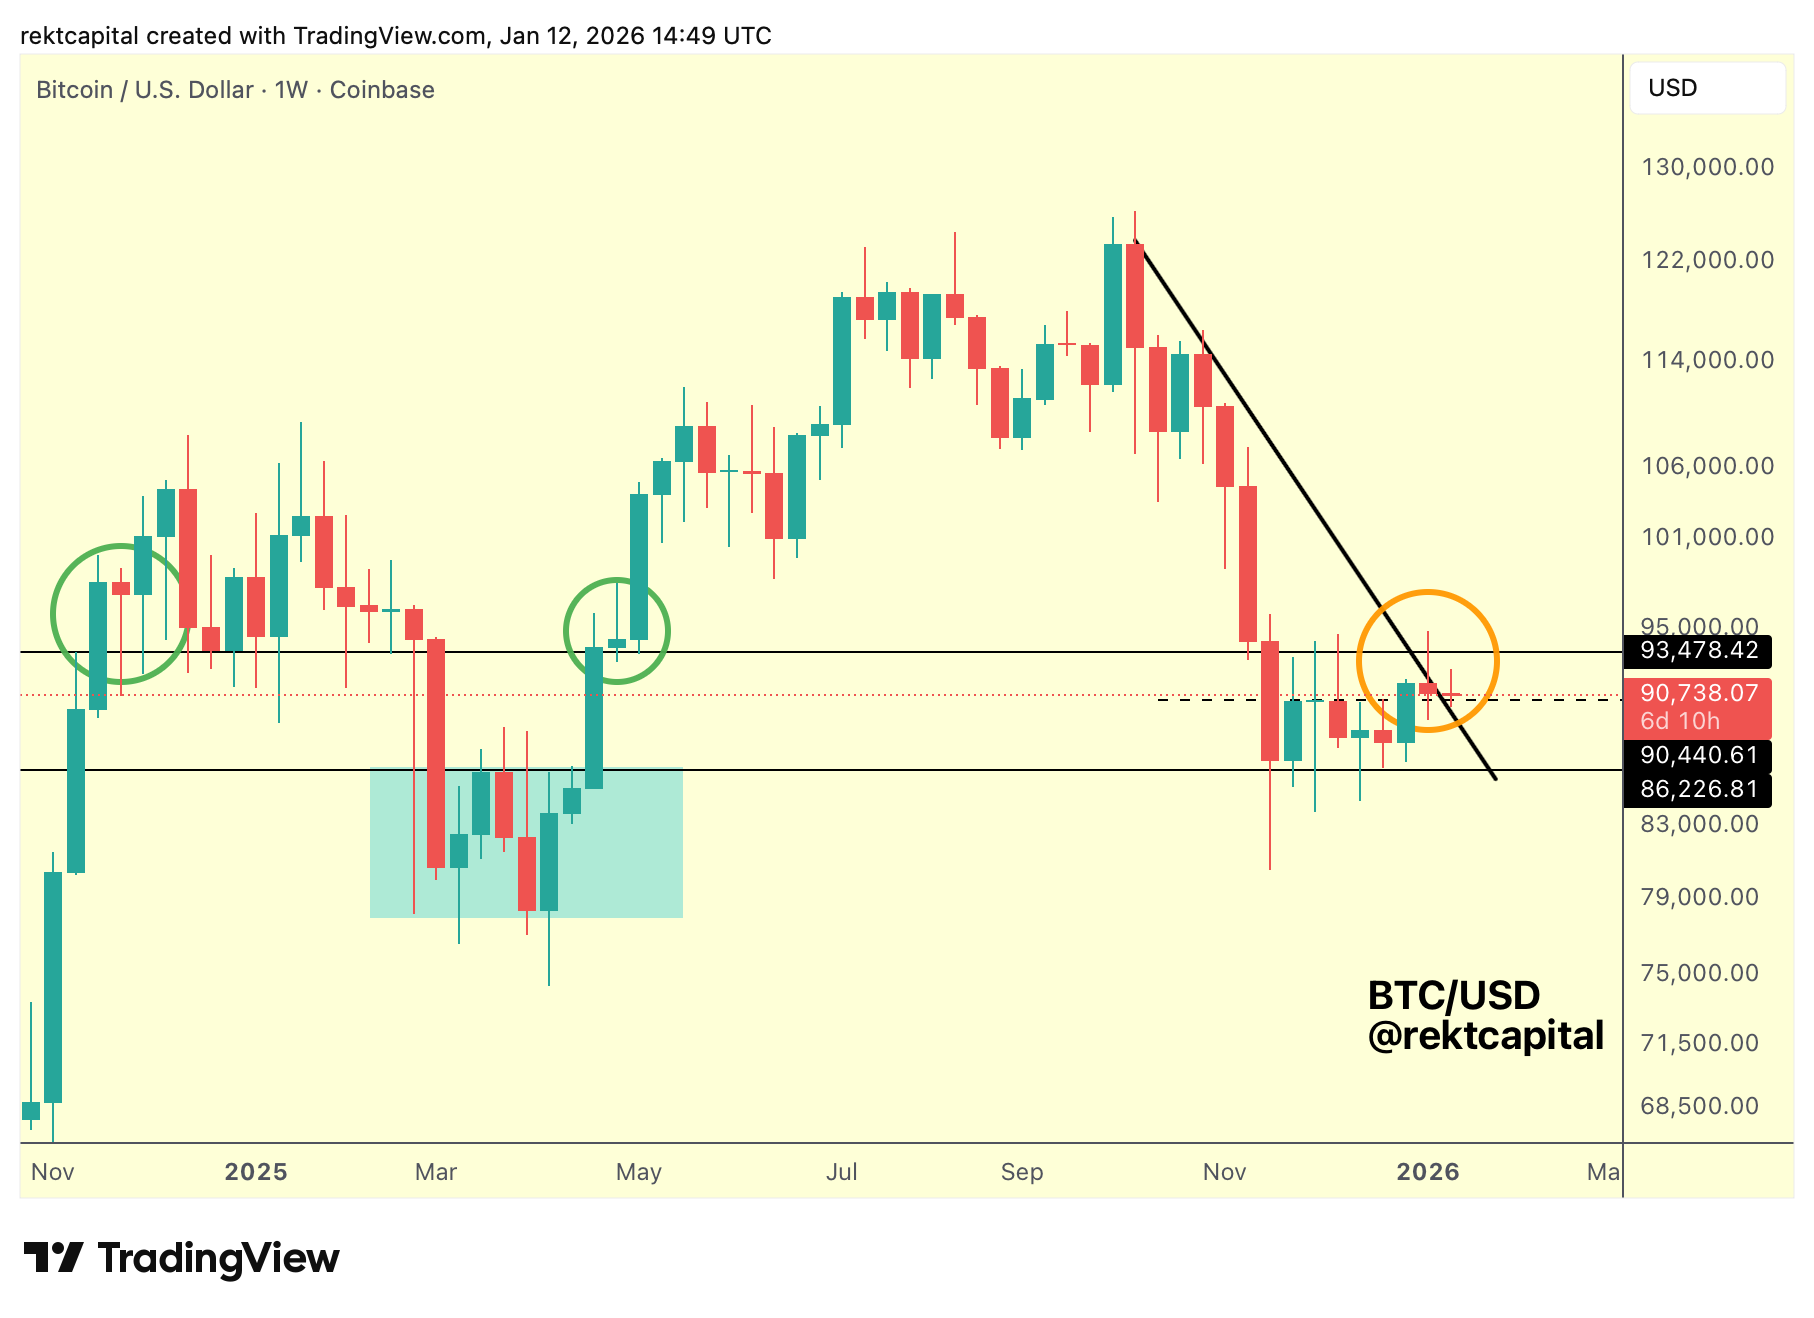
The latest Weekly Candle has closed beyond the multi-week Downtrend that capped price throughout late November and early December, marking a small but notable technical milestone.
Price is still operating within the same Weekly Range between $86k and $93.5k.
However, Bitcoin is now holding above the late-November and early-December highs, treating that former resistance area as support.
More importantly, the Weekly Mid-Range at $90.5k (dashed black) is now almost perfectly confluent with the former Downtrend, meaning the Downtrend that last week rejected price is beginning to act as layered support instead.
As long as Bitcoin continues to hold this Mid-Range and the Downtrend as support, price retains room to move higher across the upper portion of the range and once again challenge the $93.5k Range High.
While Bitcoin has rejected from $93.5k multiple times over recent weeks, the most recent rejection was noticeably shallower, suggesting that supply at this level may be weakening rather than strengthening.
If this Mid-Range and Downtrend confluence continues to hold, it could increasingly function as a springboard, enabling another attempt to Weekly Close above $93.5k and potentially turn it into support to enable the path toward $100k.
Bitcoin Nears a Historic EMA Test
Just above current price, another technically decisive region is beginning to form.
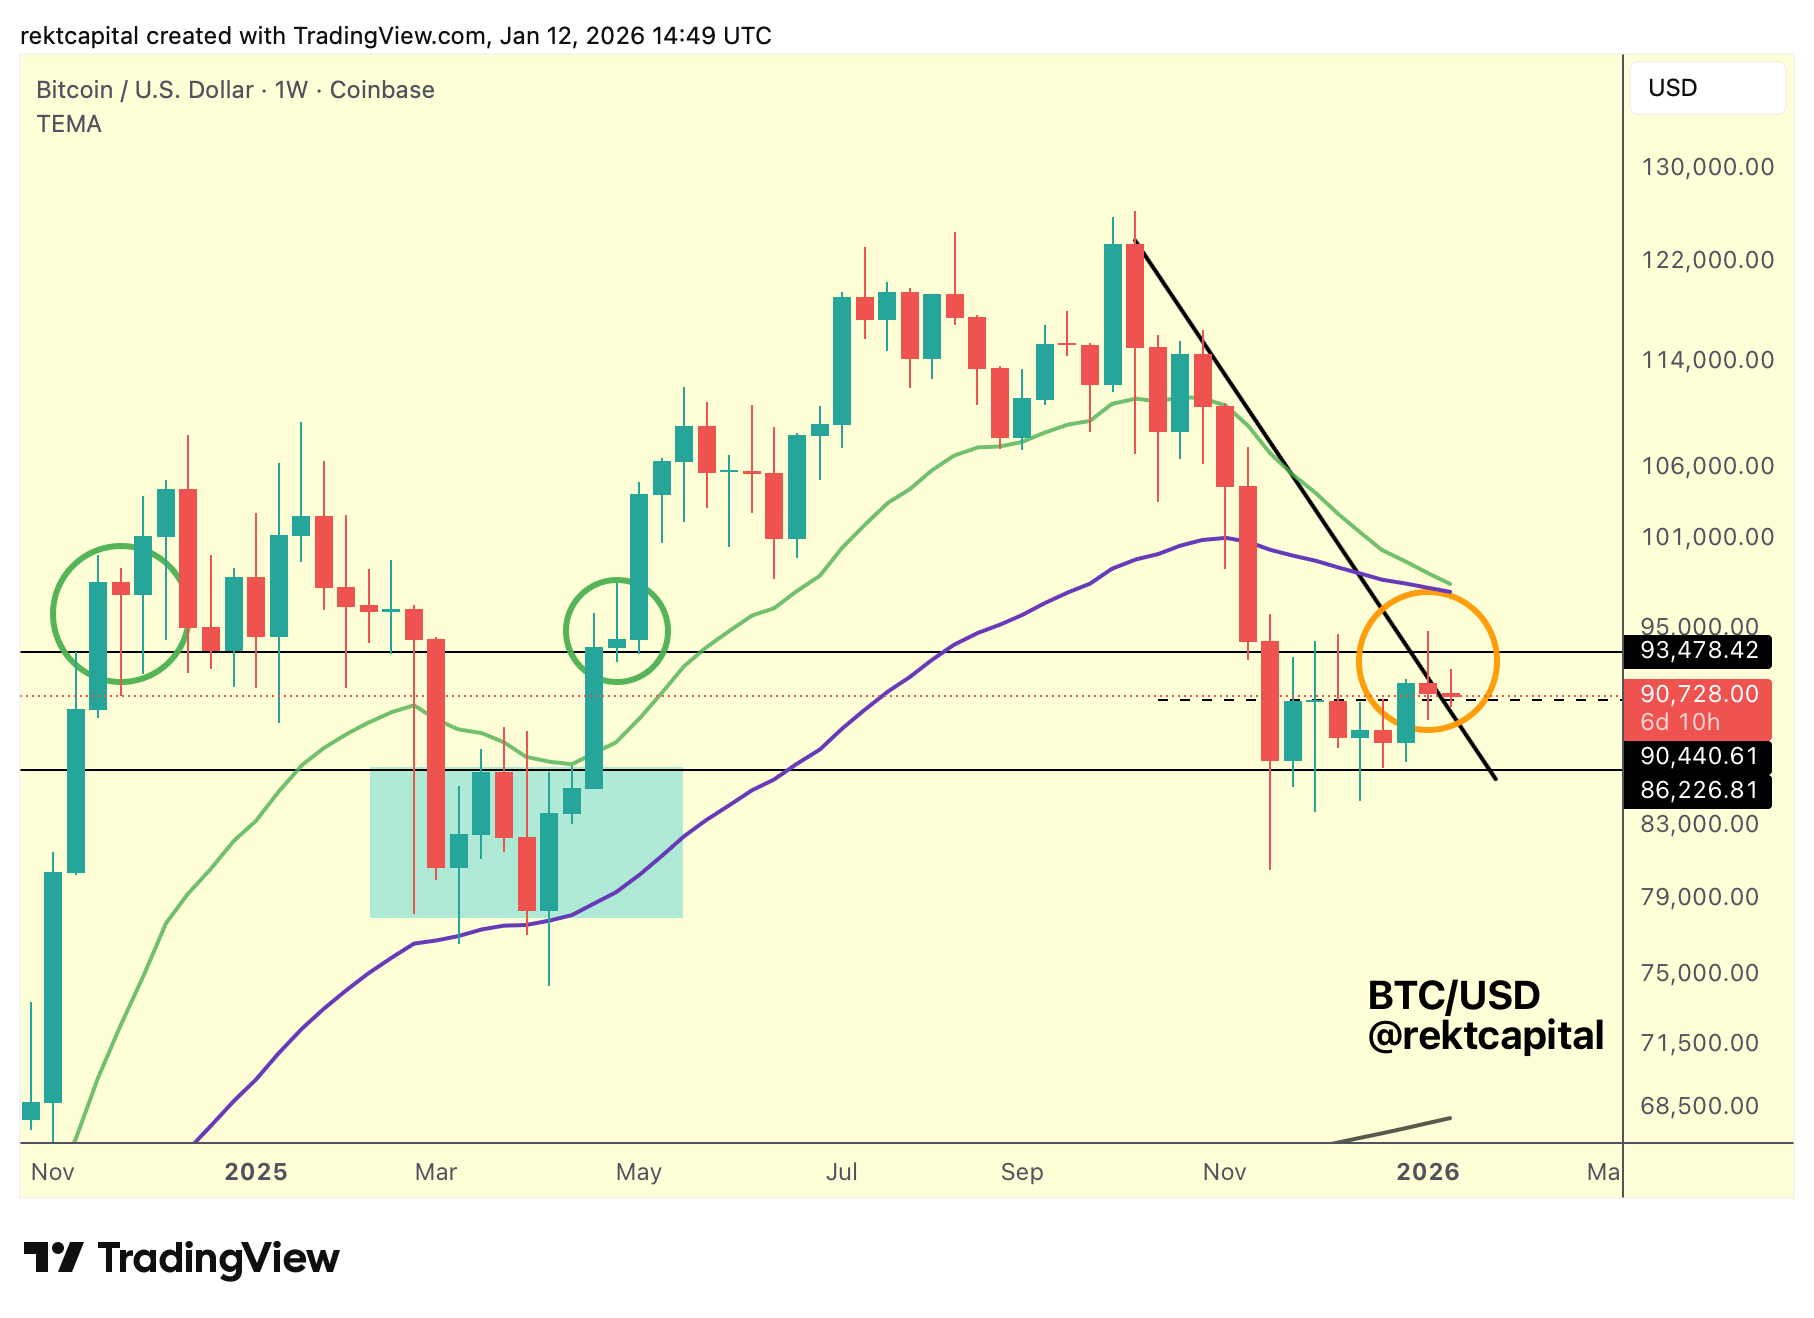
Around $96k–$97.5k, Bitcoin is approaching the Bull Market EMA cluster, where the purple 50-week EMA and green 21-week EMA are drawing increasingly close to one another.
These EMAs are dynamic, they will continue to adjust as price moves.
Historically, Bitcoin has tended to overextend beyond this EMA cluster before any meaningful crossover takes place, only to then fail to successfully retest that region as support.
When that happens, the crossover itself often follows the bearish price event, rather than causing it, with the EMA cluster flipping into resistance from the underside and leading to downside continuation.
At present, Bitcoin has not yet overextended beyond the EMAs, but price is positioning itself in a way that could allow for a springboard higher, potentially enabling a test of this cluster in the weeks ahead.
The key question is timing.
Past cycles show that these EMAs can move very close together, and even overlap for extended periods, before a decisive crossover actually occurs, meaning proximity alone does not confirm direction.
But history does suggest that overextension beyond the EMAs is on the cards; history also suggests that crossover could occur in response to a failed retest of the EMAs, rather than before the retest itself.