Bitcoin - Recession Fears?
Is the Bull Market over?
Welcome to the Rekt Capital newsletter, a resource for investors who want to better navigate the crypto markets with the help of cutting-edge crypto research and unbiased market analysis.
The Bearish Indicators That Flashed Last Week
Last week, we spoke about how Bitcoin was showcasing signs of weakness at highs, demonstrating three distinct theories for why this was the case:
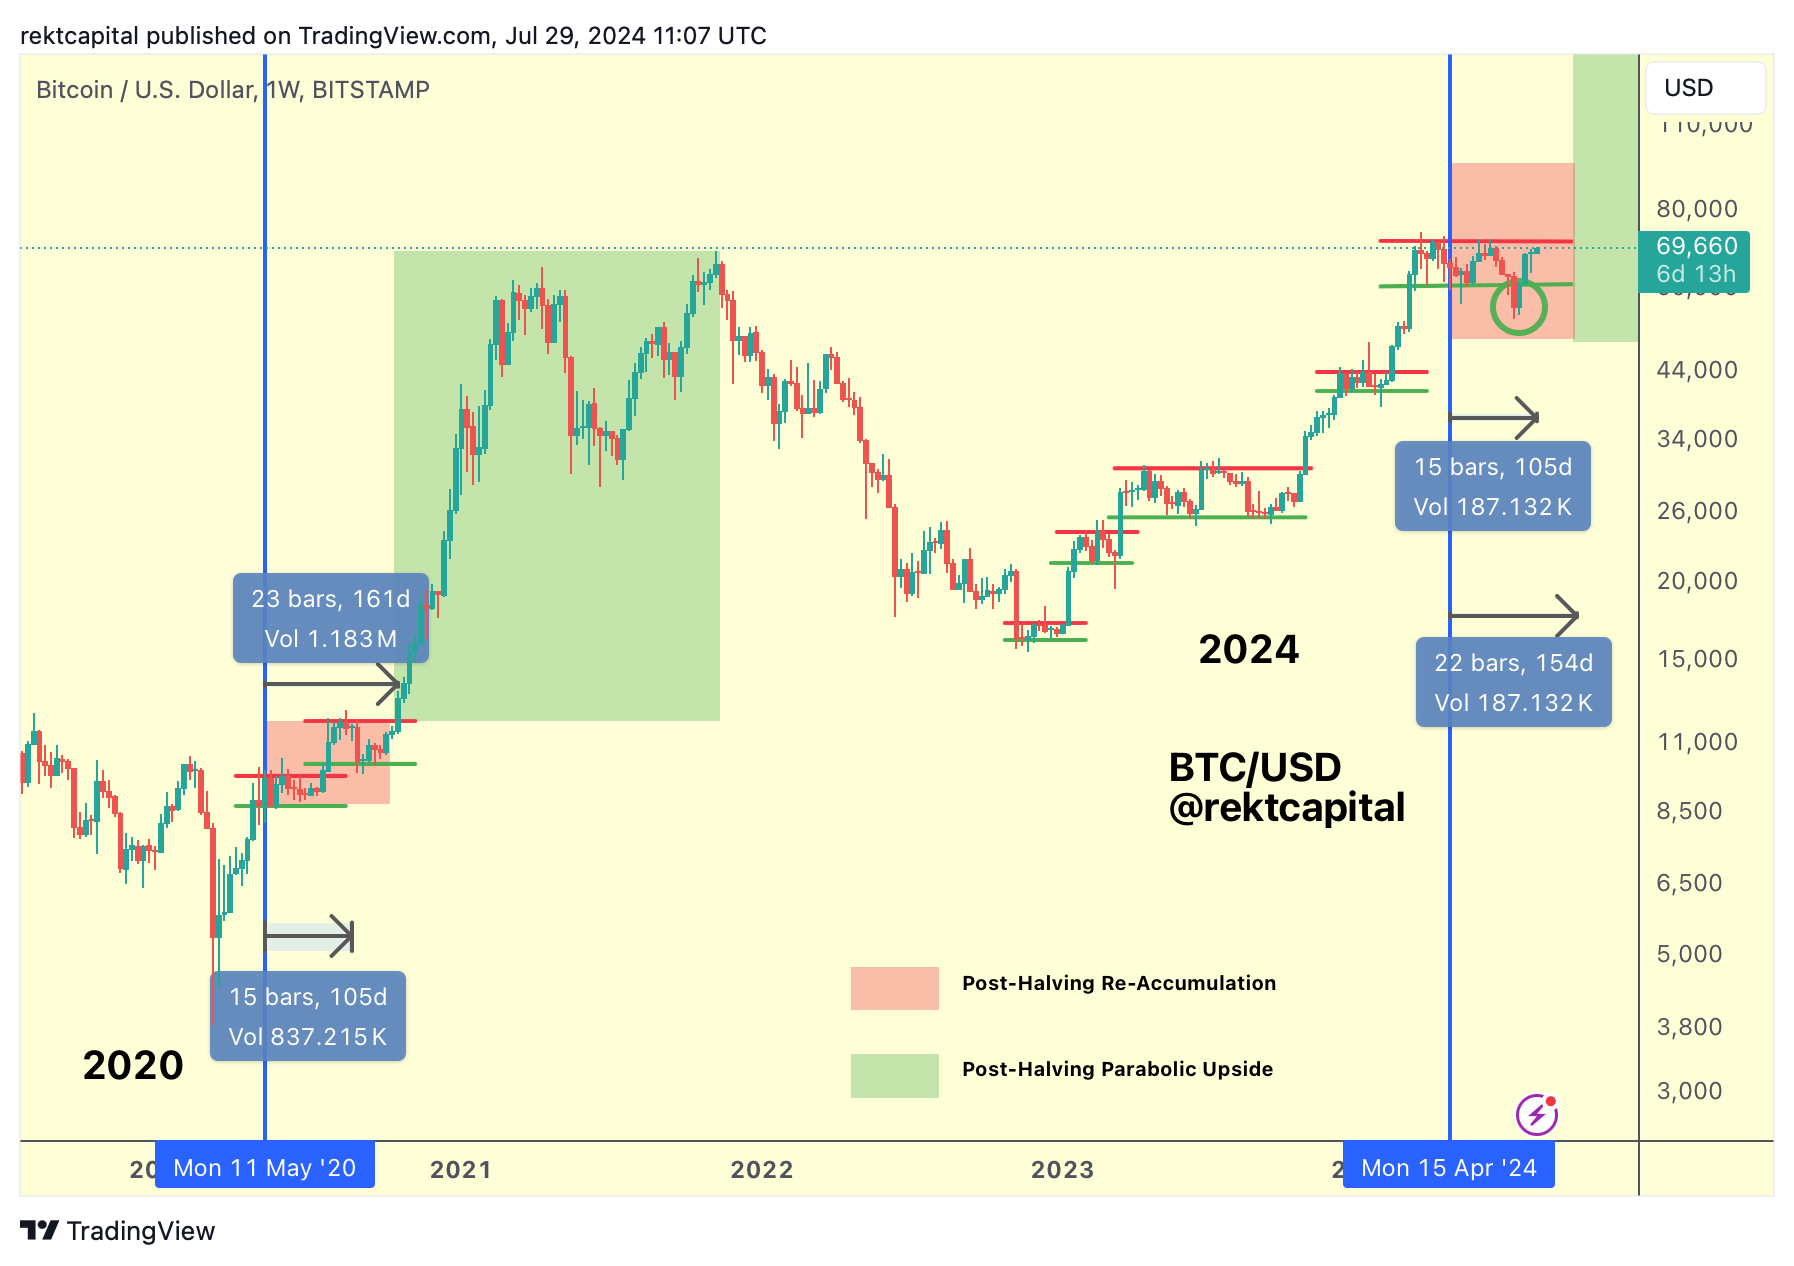
Firstly, we discussed the The Range High of the ReAccumulation Range:
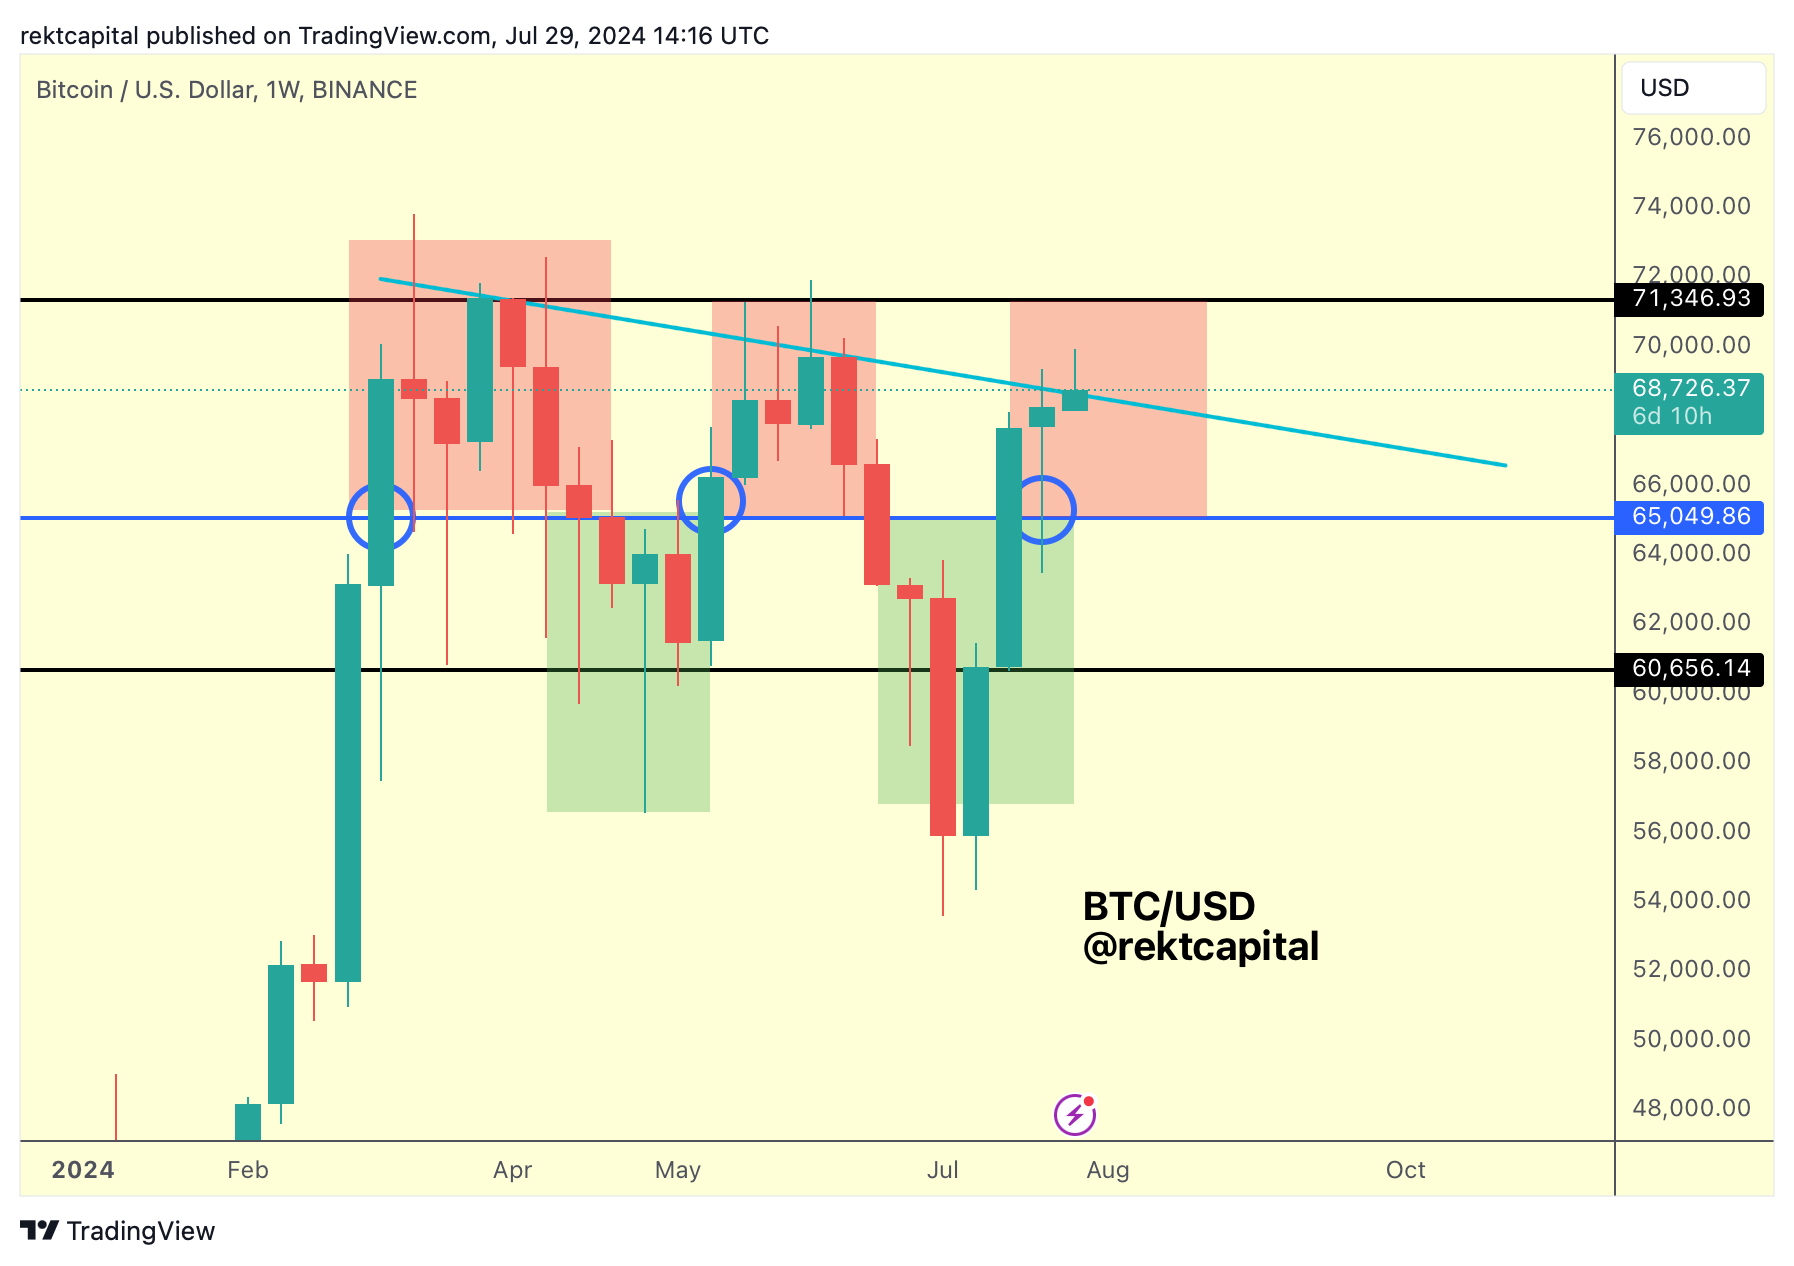
Then, we discussed The Weekly Lower High
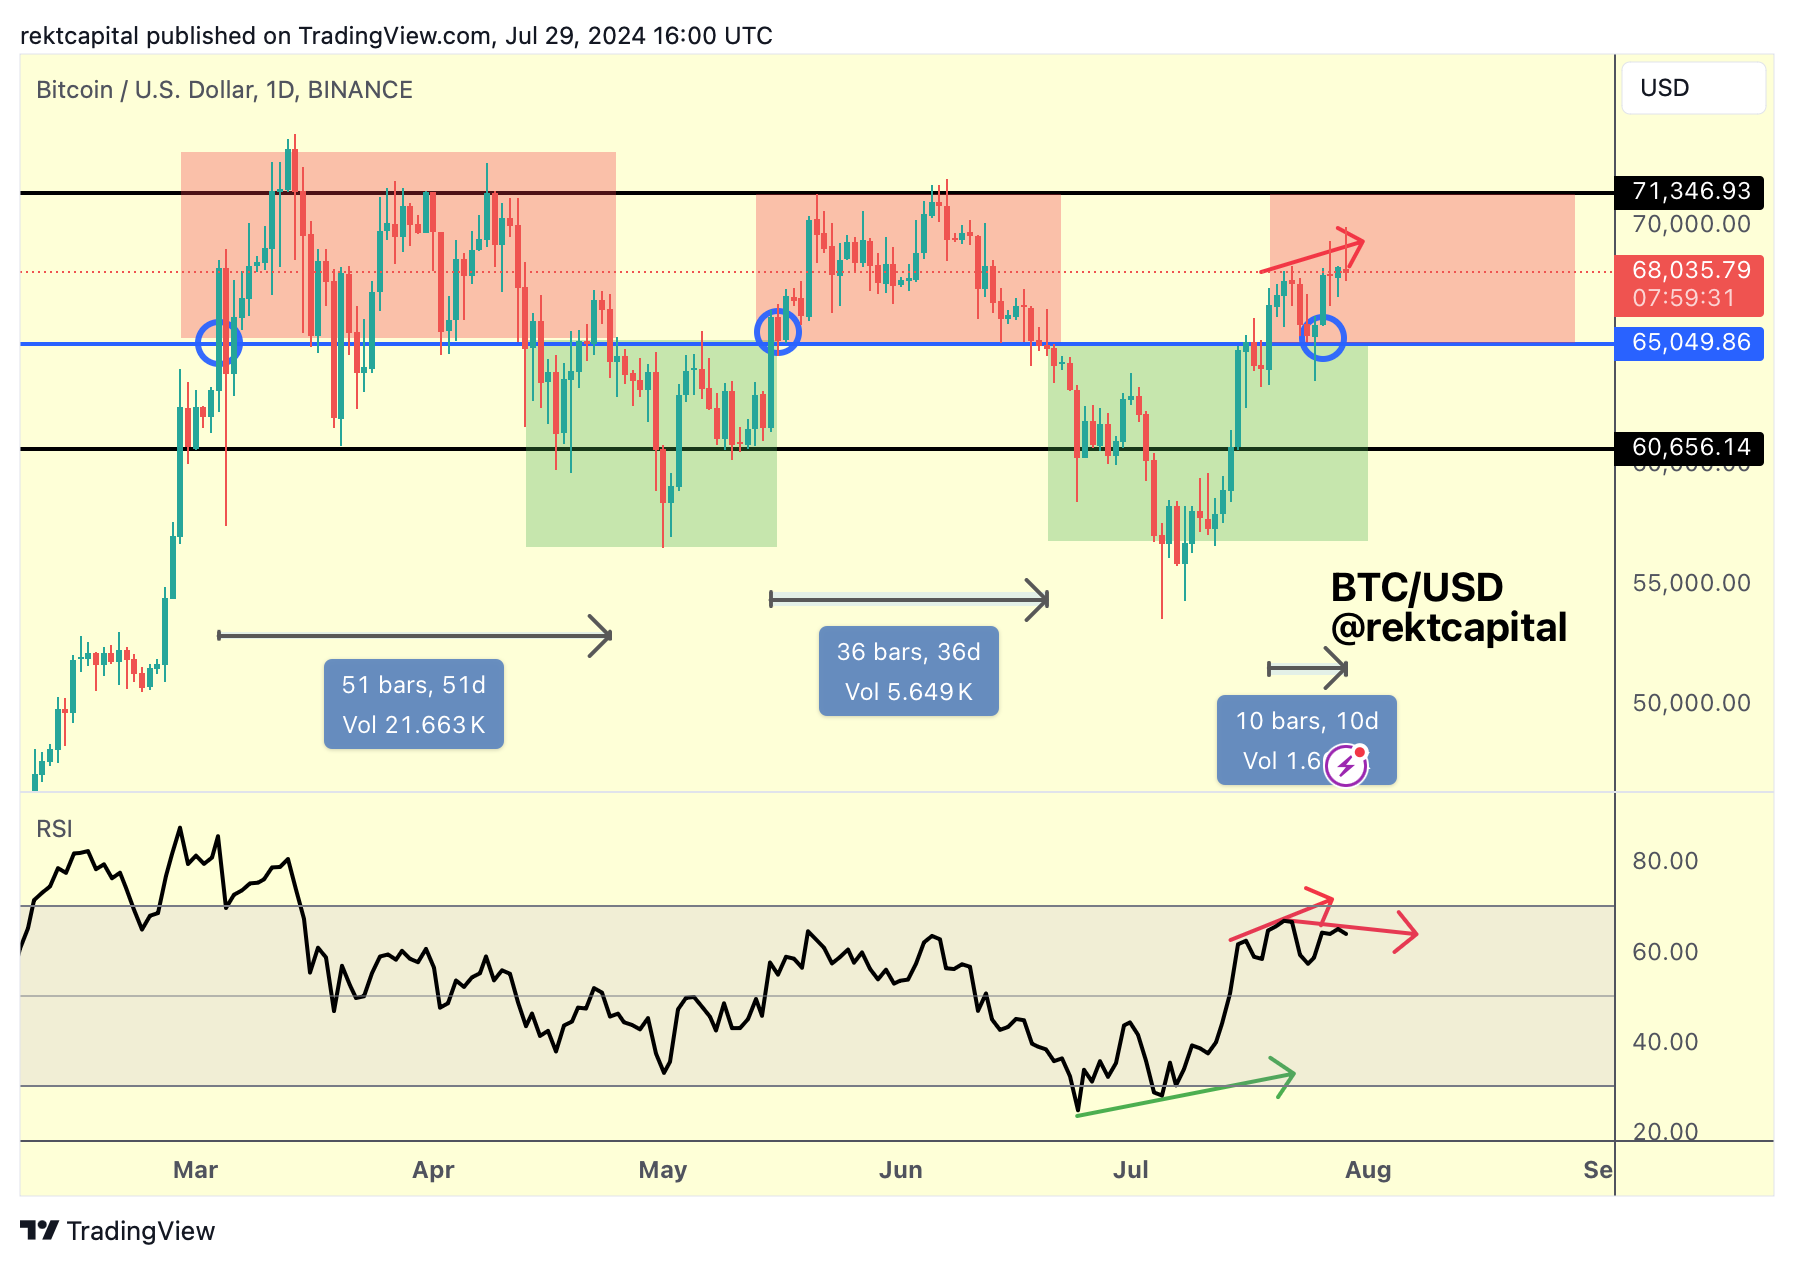
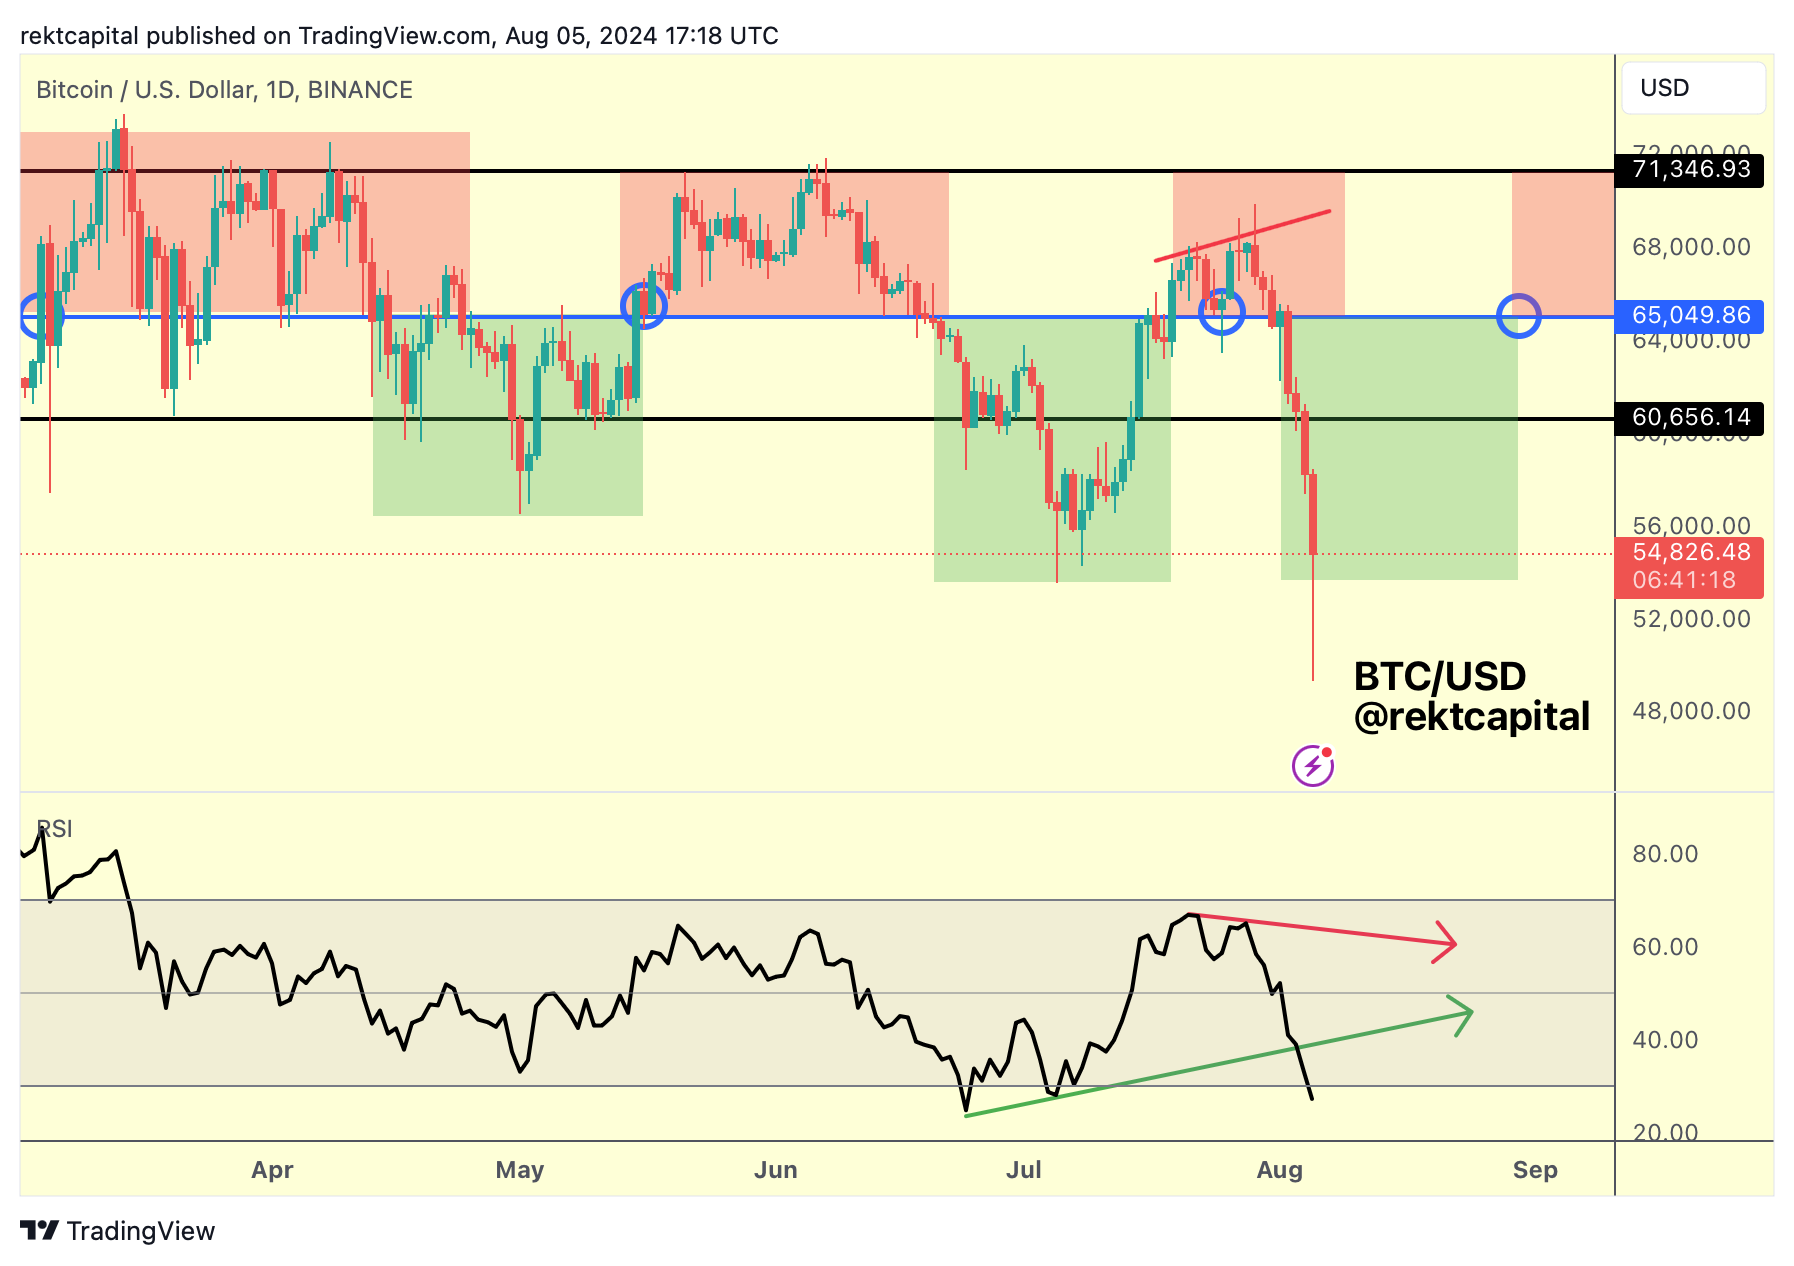
And lastly, we discussed the Bearish Divergence on the Daily timeframe:
The Weekly Lower High rejected price:
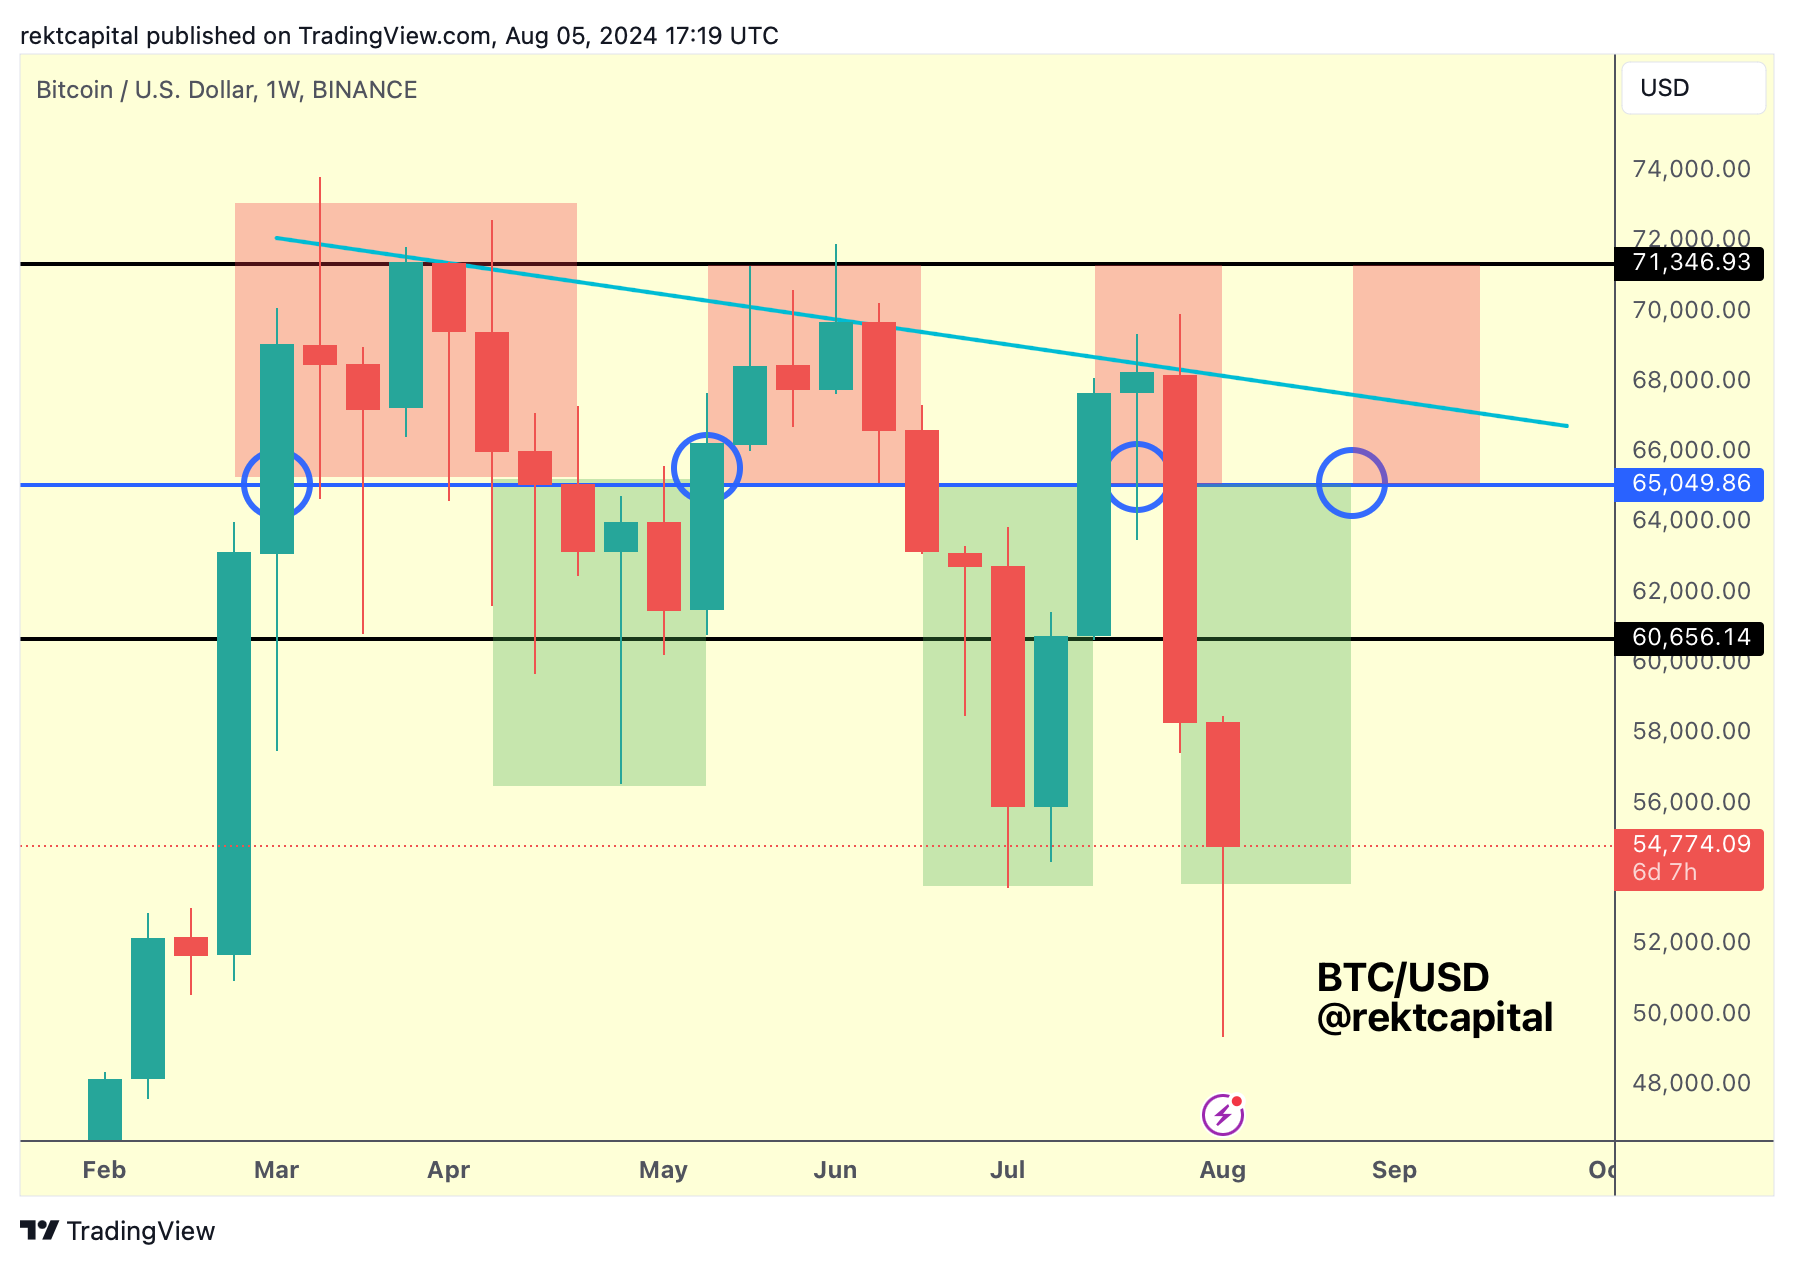
And the Bearish Divergence on the Daily played out:
The Re-Accumulation Range
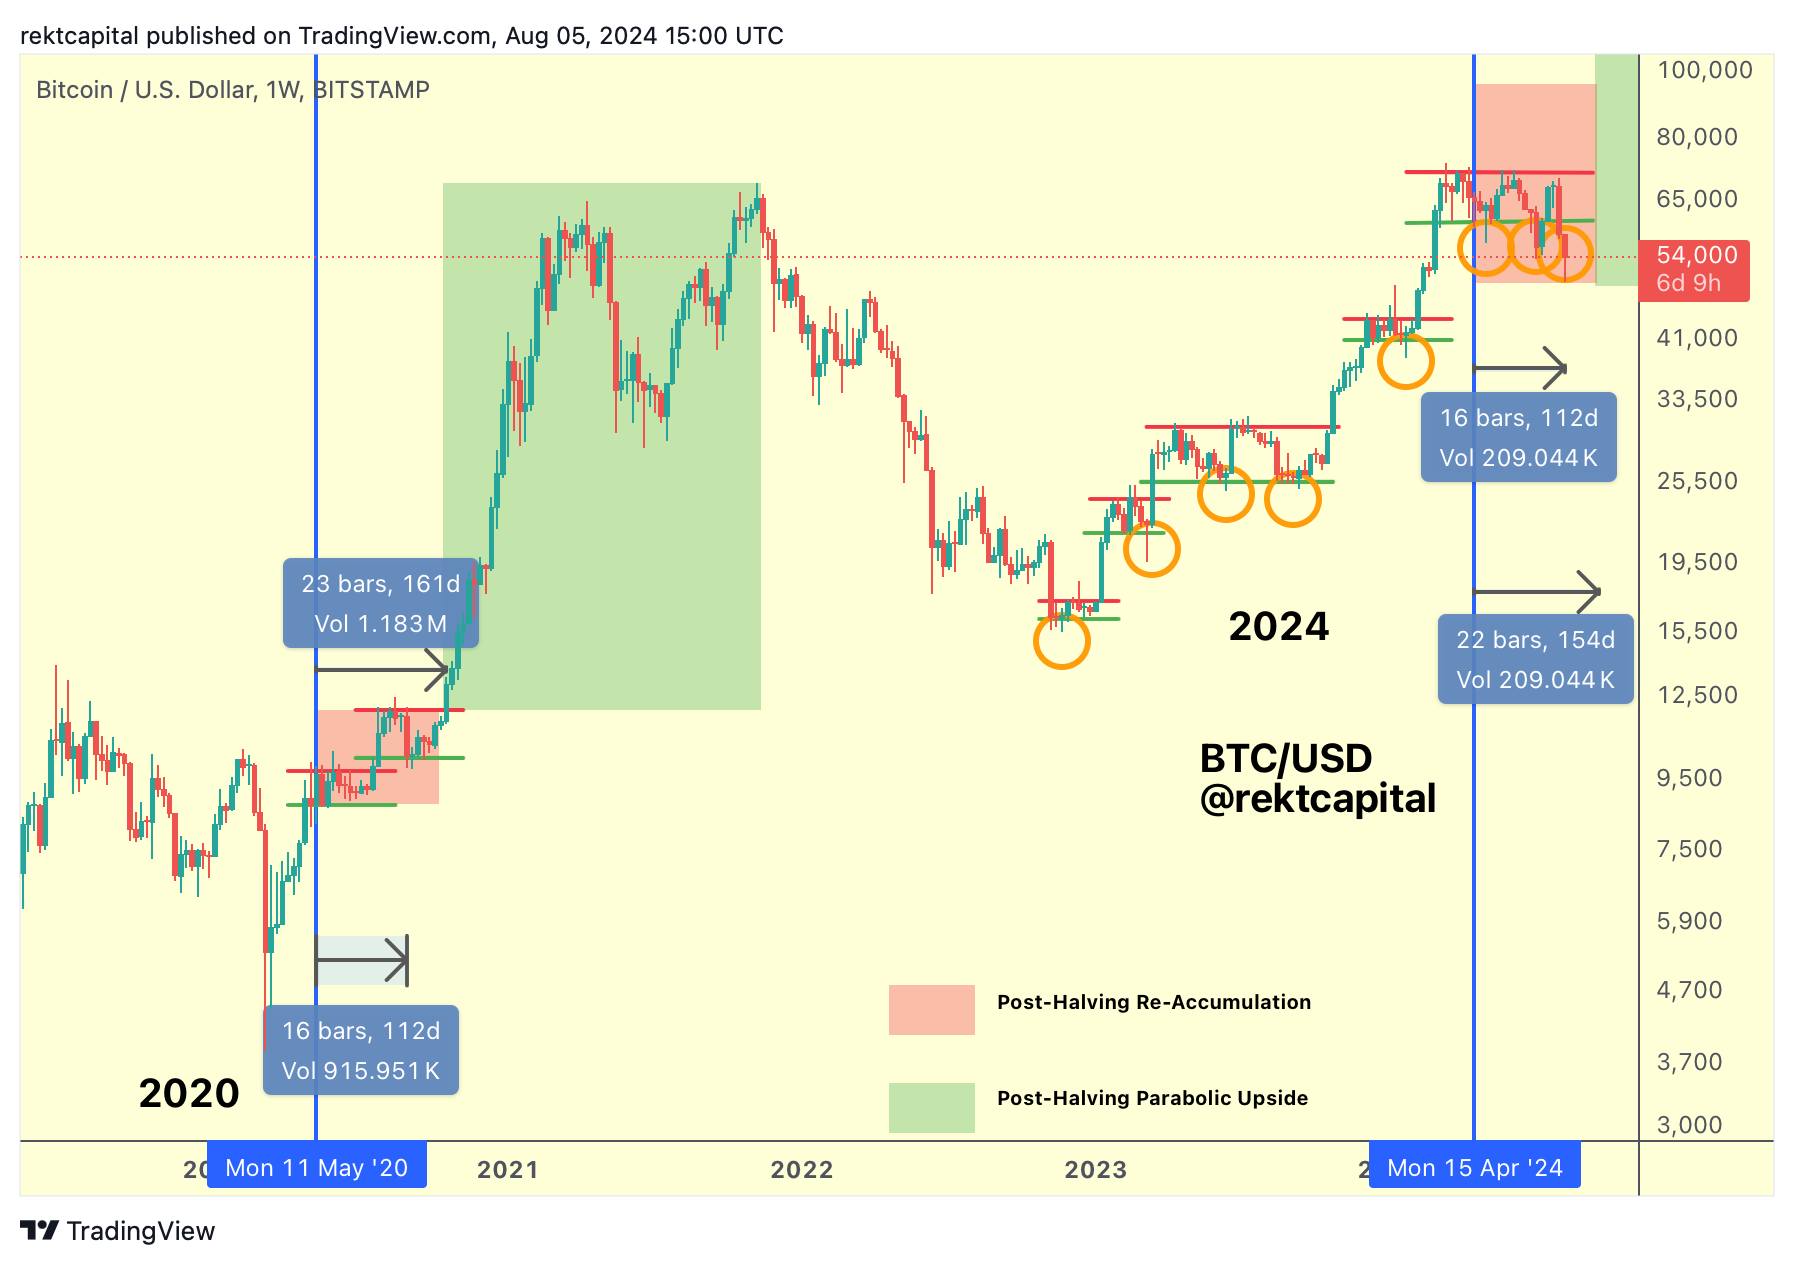
Bitcoin has once again Weekly Closed below the Range Low of the ReAccumulation Range ($60600), beginning yet another possible downside deviation below the Range Low.
This time, price has formed a new Lower Low but for the next two weeks or so will have the task of trying to reclaim the ReAccumulation Range, much like it did only a few weeks ago.
Historically, Bitcoin has produced downside wicks below the Range Low whereas now it is becoming more of a tradition to perform entire candle-bodied downside deviations below the Range Low.
Over the course of the cycle, such downside deviations have served as bargain-buying opportunities and so Bitcoin will need to rally towards $60600 over the coming two weeks or so to complete its downside deviation and also reaffirm that this simply isn't a breakdown.
Downside is one thing but it will be the recovery from here that will be crucial.
Thus far, despite the capitulatory downside, the bargain-box (orange) below the black Channel is still holding:
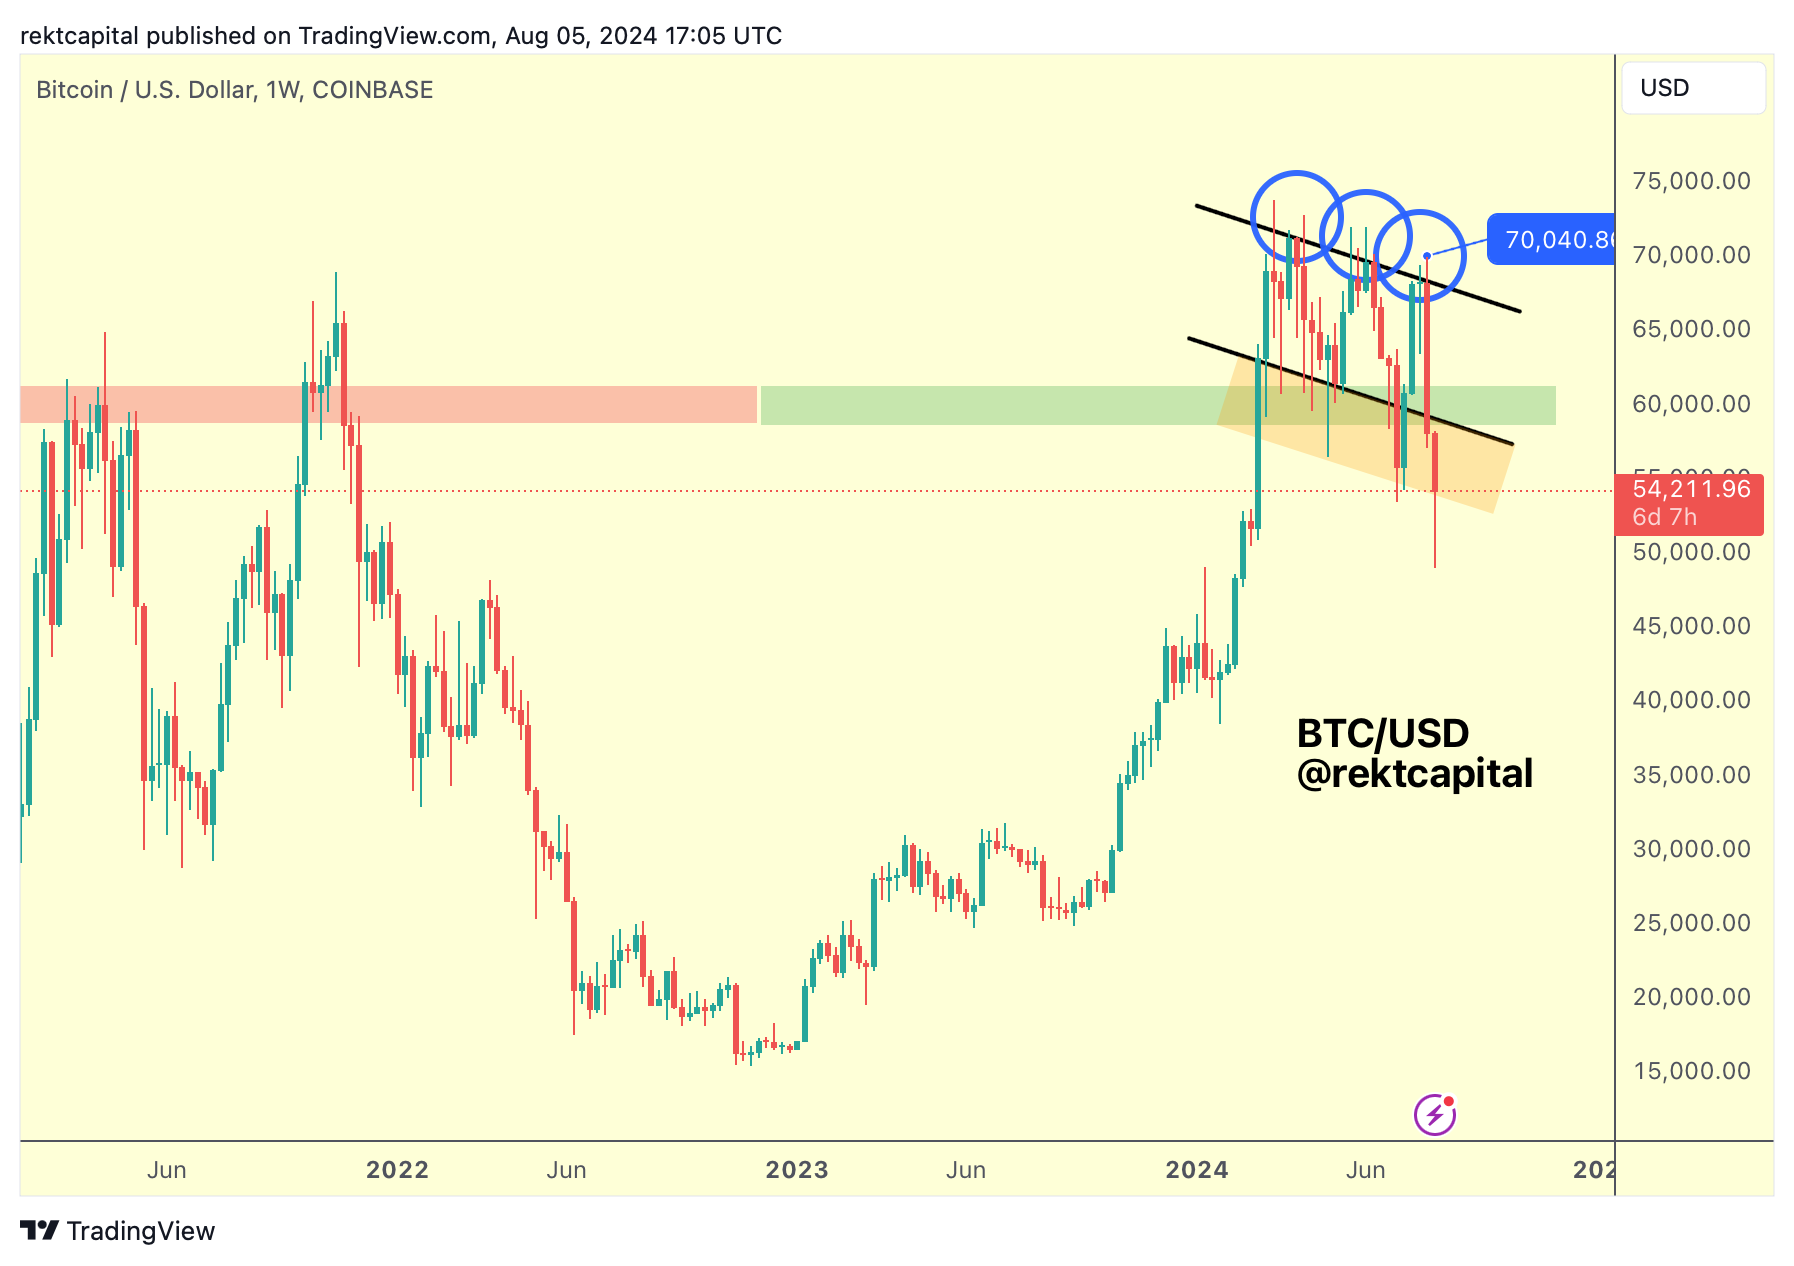
The orange box generally assumes that price could be printing Lower Lows on subsequent downside deviations, meaning that price could continue lower and lower on retraces the longer this structure continues to remain intact.
The bottom of the orange box is still holding, despite the downside wick below it, and so continued support here would be important into enabling price's revisit attempt of the bottom of the black channel and the $60600 Range Low area.
After all - this is exactly where the brand new CME Gap has formed:
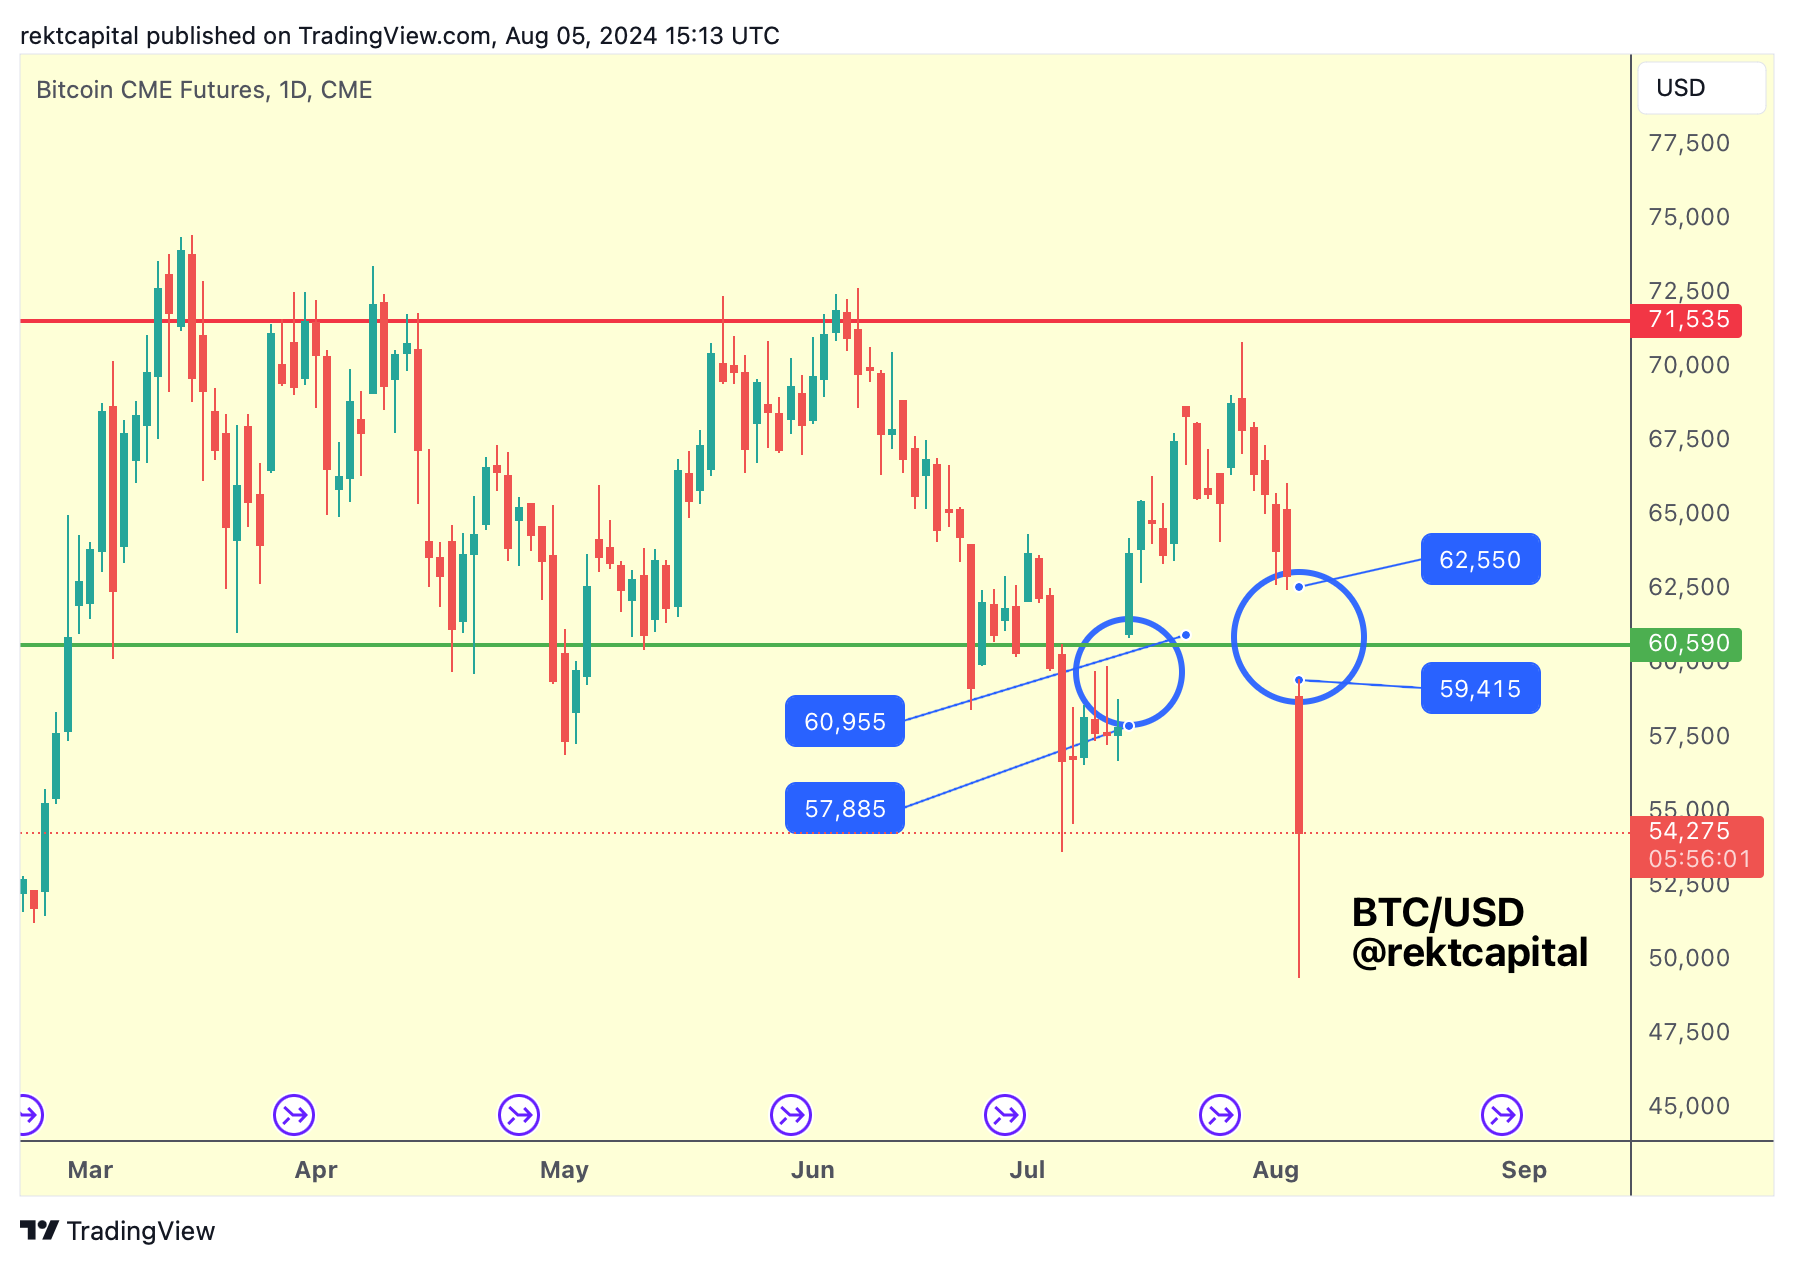
The bottom of the black channel as well as the bottom of the ReAccumulation share confluence with the CME Gap, which developed shortly after filling the previous CME Gap at $57885-$60995.
The brand new CME Gap is now located at the $59415-$62550 region.
Given how all CME Gaps have been successfully filled over the previous months, it appears there is a highly likelihood that this new CME Gap will also get filled, over time.