Is Bitcoin On The Cusp Of Bearish Acceleration?
Why historical Macro Descending Triangles continue to favour downside resolution
Welcome to the Rekt Capital Newsletter, a resource for investors who want to better navigate the crypto markets with the help of cutting-edge crypto research and unbiased market analysis.
Logarithmic Growth Curve Trendlines: Strengthening Resistance, Deeper Rejections
When viewed through the Logarithmic Growth Curve Channel, Bitcoin continues to consolidate below a broader macro range, where the lower boundary historically marks dynamic range lows and the upper boundary defines a long-term macro sell zone.
In fact, Bitcoin has lately rejected from the base of this Log channel, signalling it no longer figures as a support but instead as a point of rejection.
More, the top of that same channel is now behaving as a hardened ceiling, one that is strengthening and rejecting price into progressively deeper retraces.
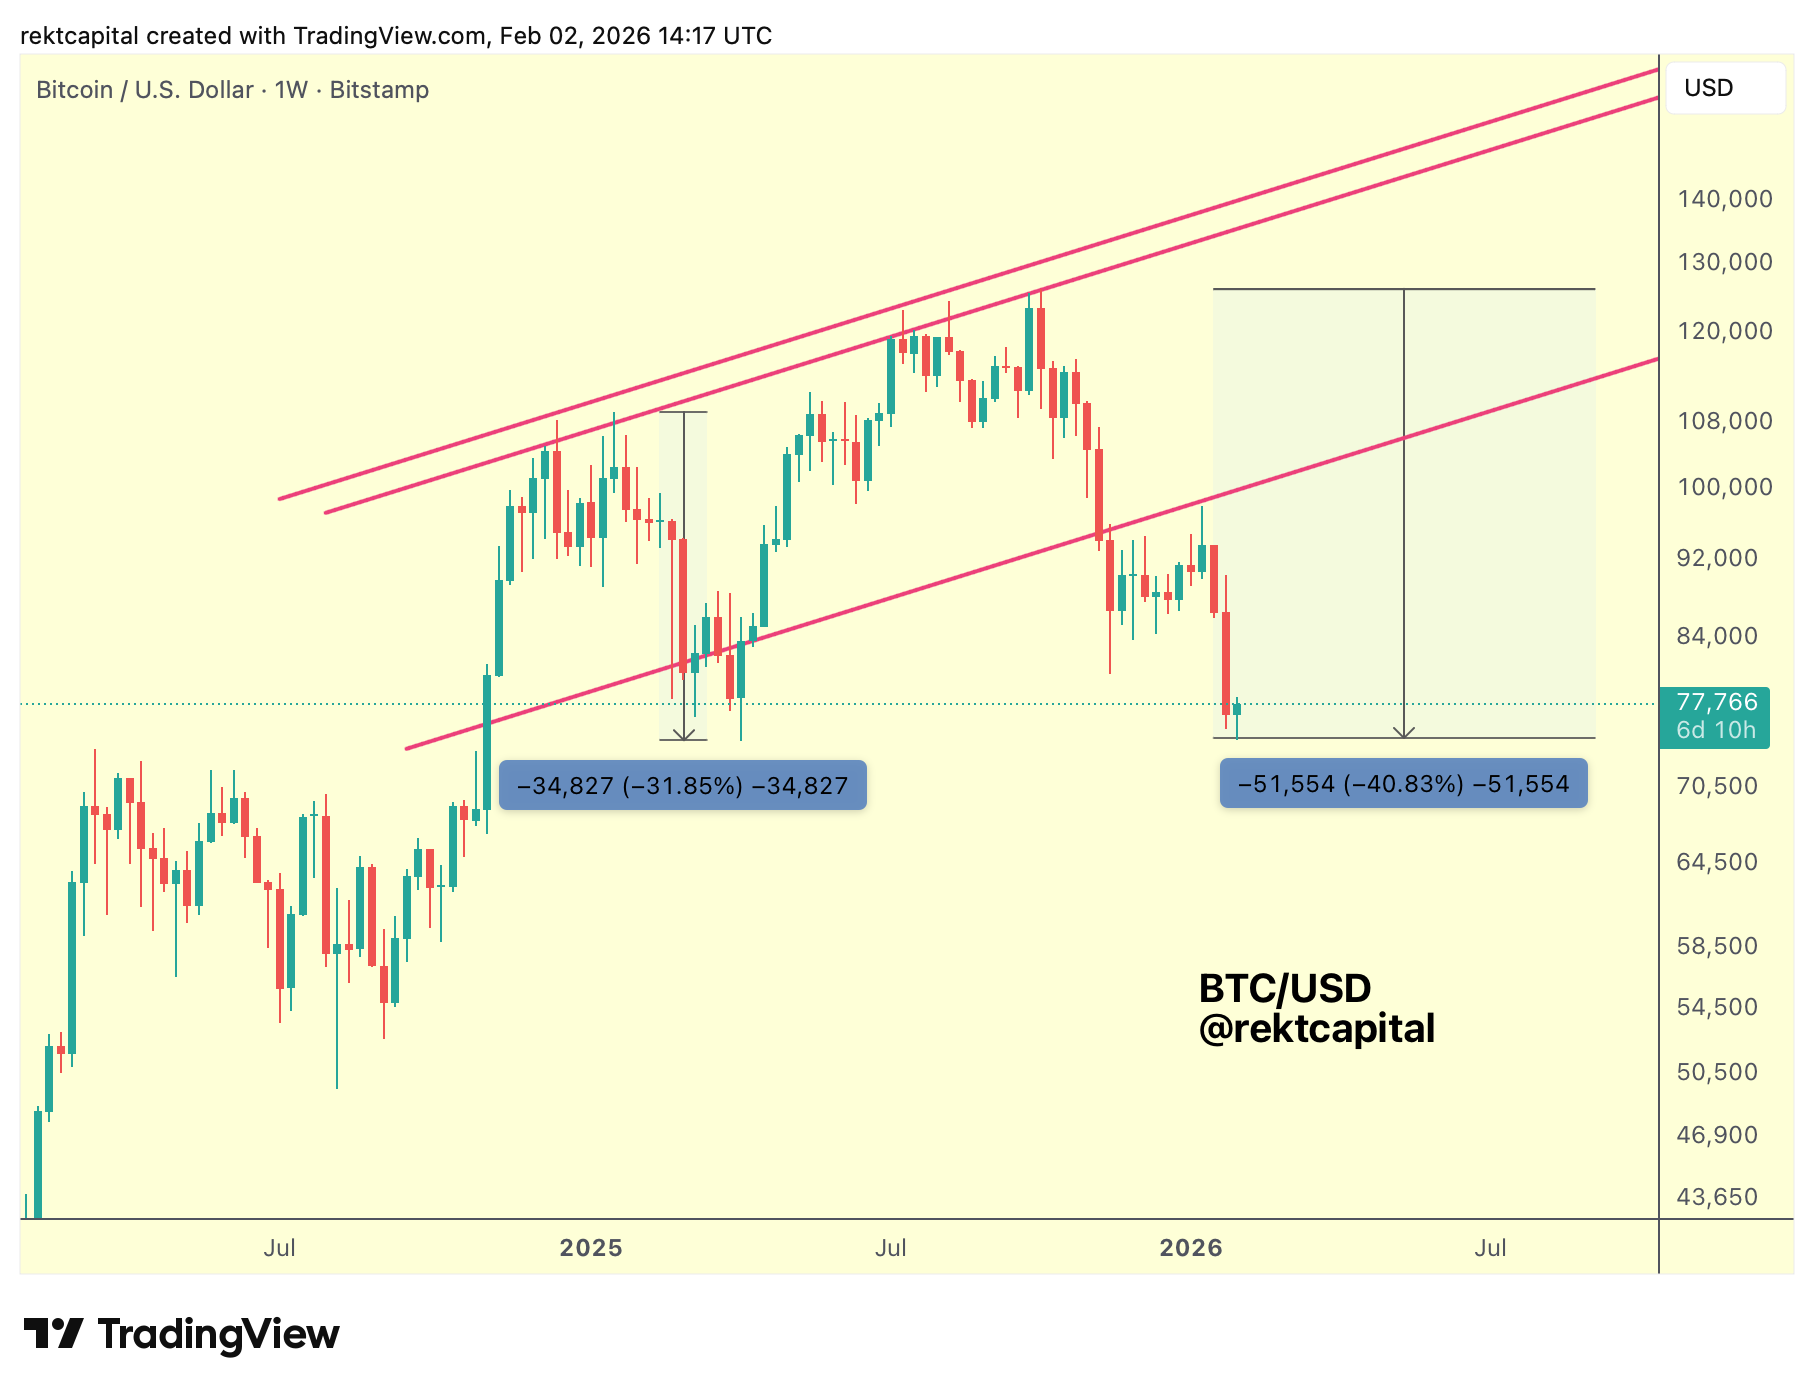
One the flip side, Bitcoin's major support at $80k is showing signs of weakness:
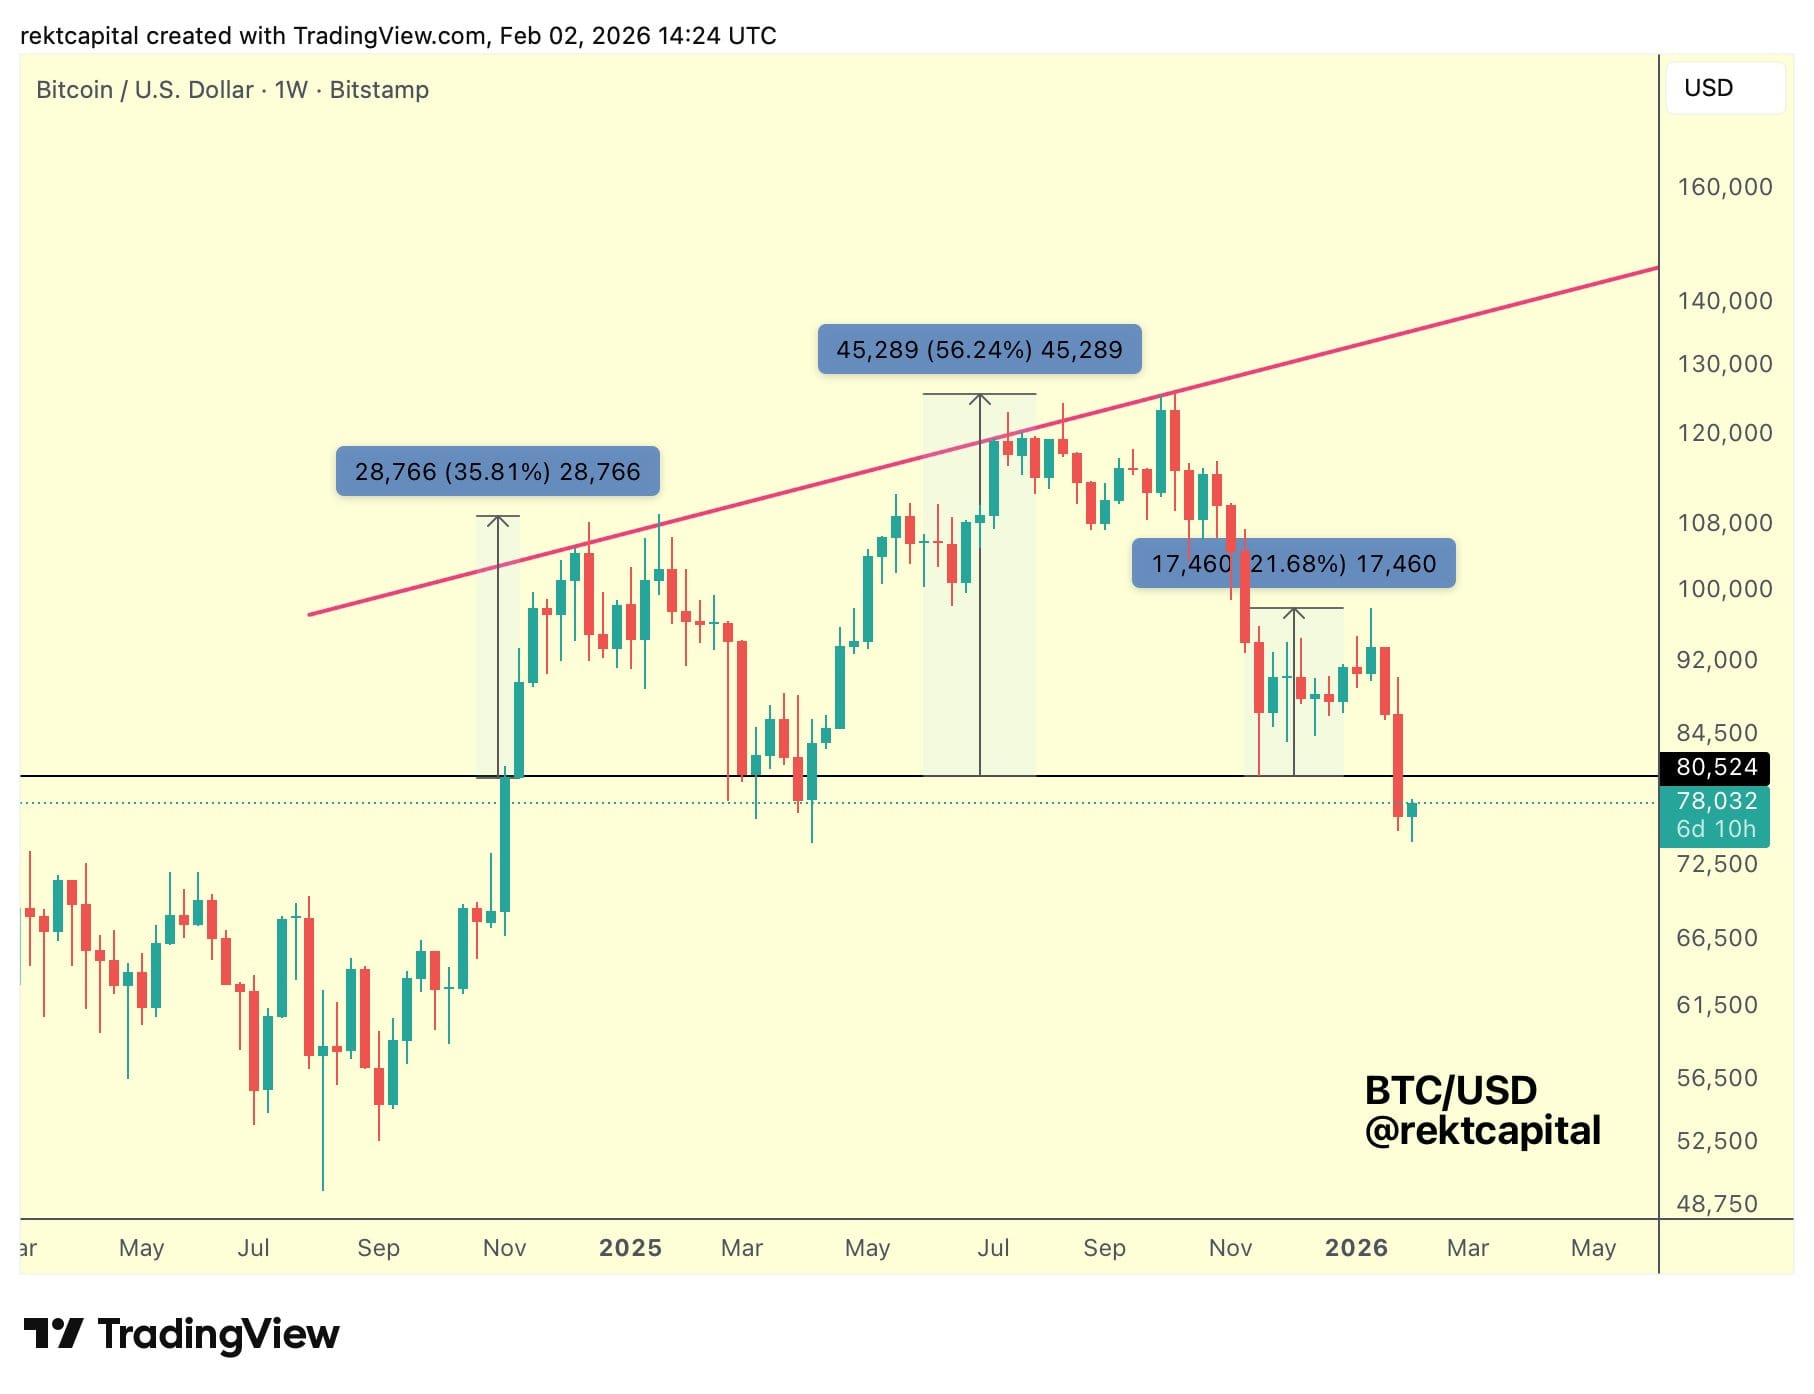
The rebounds are lesser and lesser over time.
So when weakening supports are considered alongside strengthening resistances, the structural picture becomes clearer.
As historical rebound zones lose effectiveness over time and transition into resistance, downside moves tend to accelerate.
On the flip side, strengthening resistances, such as those defined by the Logarithmic Growth Curve, produce progressively deeper rejections, a dynamic currently reflected by a roughly -31.85% then another -40.83% retrace from resistance.
Taken together, this interaction between weakening supports and strengthening resistances reinforces the broader bearish structure.
Macro Descending Triangles: The Bear Market Framework
This analysis focuses specifically on Macro Descending Triangles.
Not merely as recurring chart patterns, but as transitional structures that historically mark the shift into the next phase of an early-stage Bear Market, where confirmation signals begin to mount.
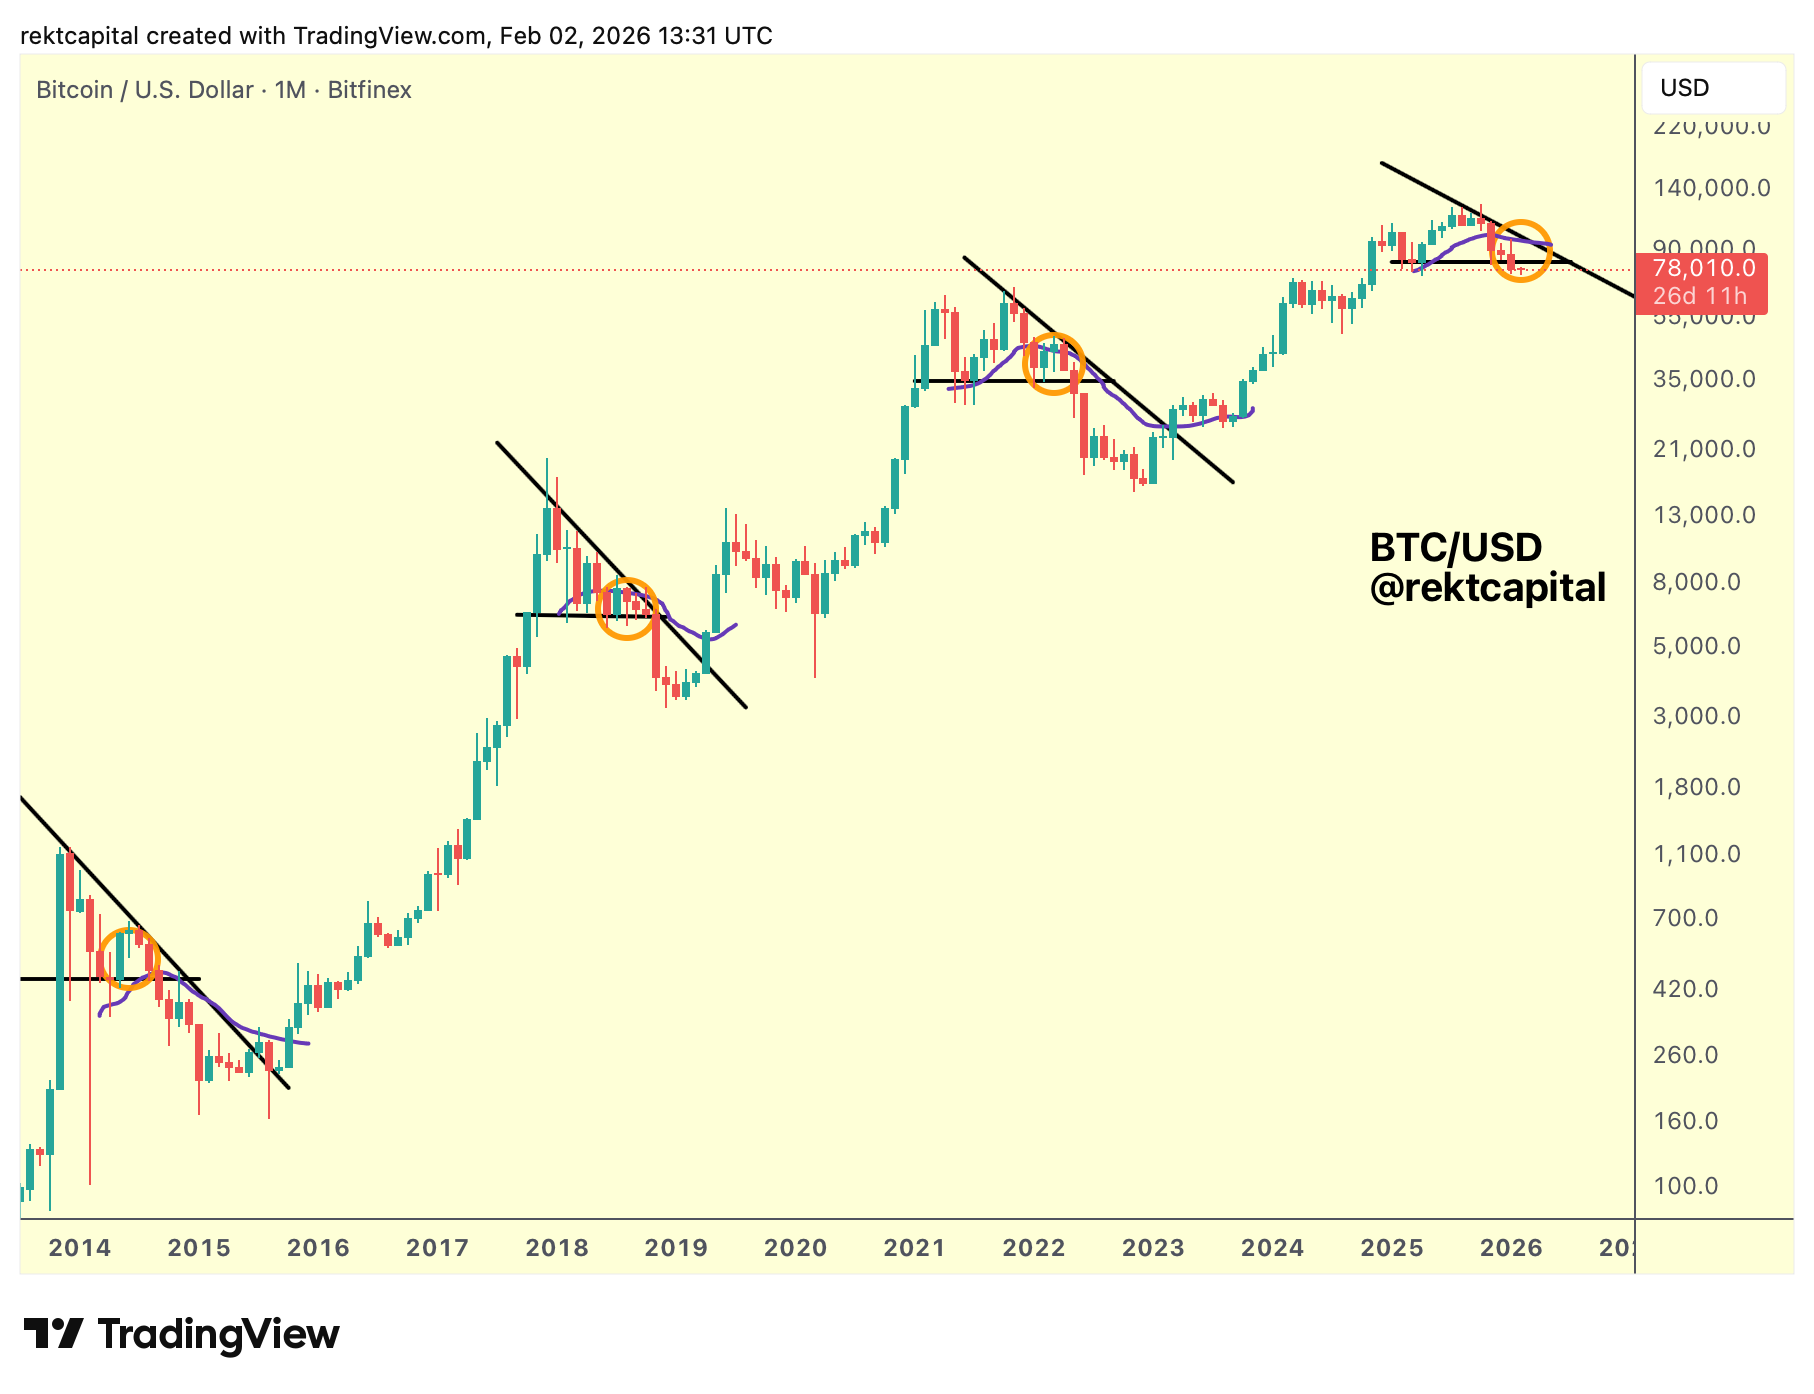
Across cycles, Bitcoin has repeatedly formed Macro Descending Triangles during Bear Market phases, with price consistently bouncing from the base of the structure, producing what appear to be constructive rebounds at first glance.
These macro relief rallies, highlighted historically by the orange regions on the chart, demonstrate a recurring tendency for price to react upward from support, but they do not represent full trend reversals to new highs.
Instead, these relief rallies serve a structural purpose.
To continue developing a Macro Downtrend, each rebound from support must become progressively weaker, producing a Macro Lower High and signalling that buy-side liquidity is diminishing while sellers remain willing to transact at lower and lower prices.
This erosion of demand is what defines weakening support.
Repeated rebounds that fail to generate stronger upside follow-through indicate that buyers are increasingly unable to defend the base of the structure, even as price continues to react from it.
Historically, this process culminates in a breakdown sequence and transition into the Bearish Acceleration phase of the Bear Market.
We'll dissect each cycle one by one, next.