Is Bitcoin In A New Bear Market?
My Perspective
Welcome to the Rekt Capital newsletter, a resource for people who want to better navigate the crypto markets with the help of cutting-edge crypto research and unbiased market analysis.
I write research articles just like this one every Monday and Wednesday for subscribers of the Rekt Capital newsletter. Friday’s feature TA on a wide-variety of Altcoins.
Today’s edition is free for everybody to read.
If you’d like to receive cutting-edge research like this straight to your inbox - feel free to subscribe for $14 a month:
Macro Retest
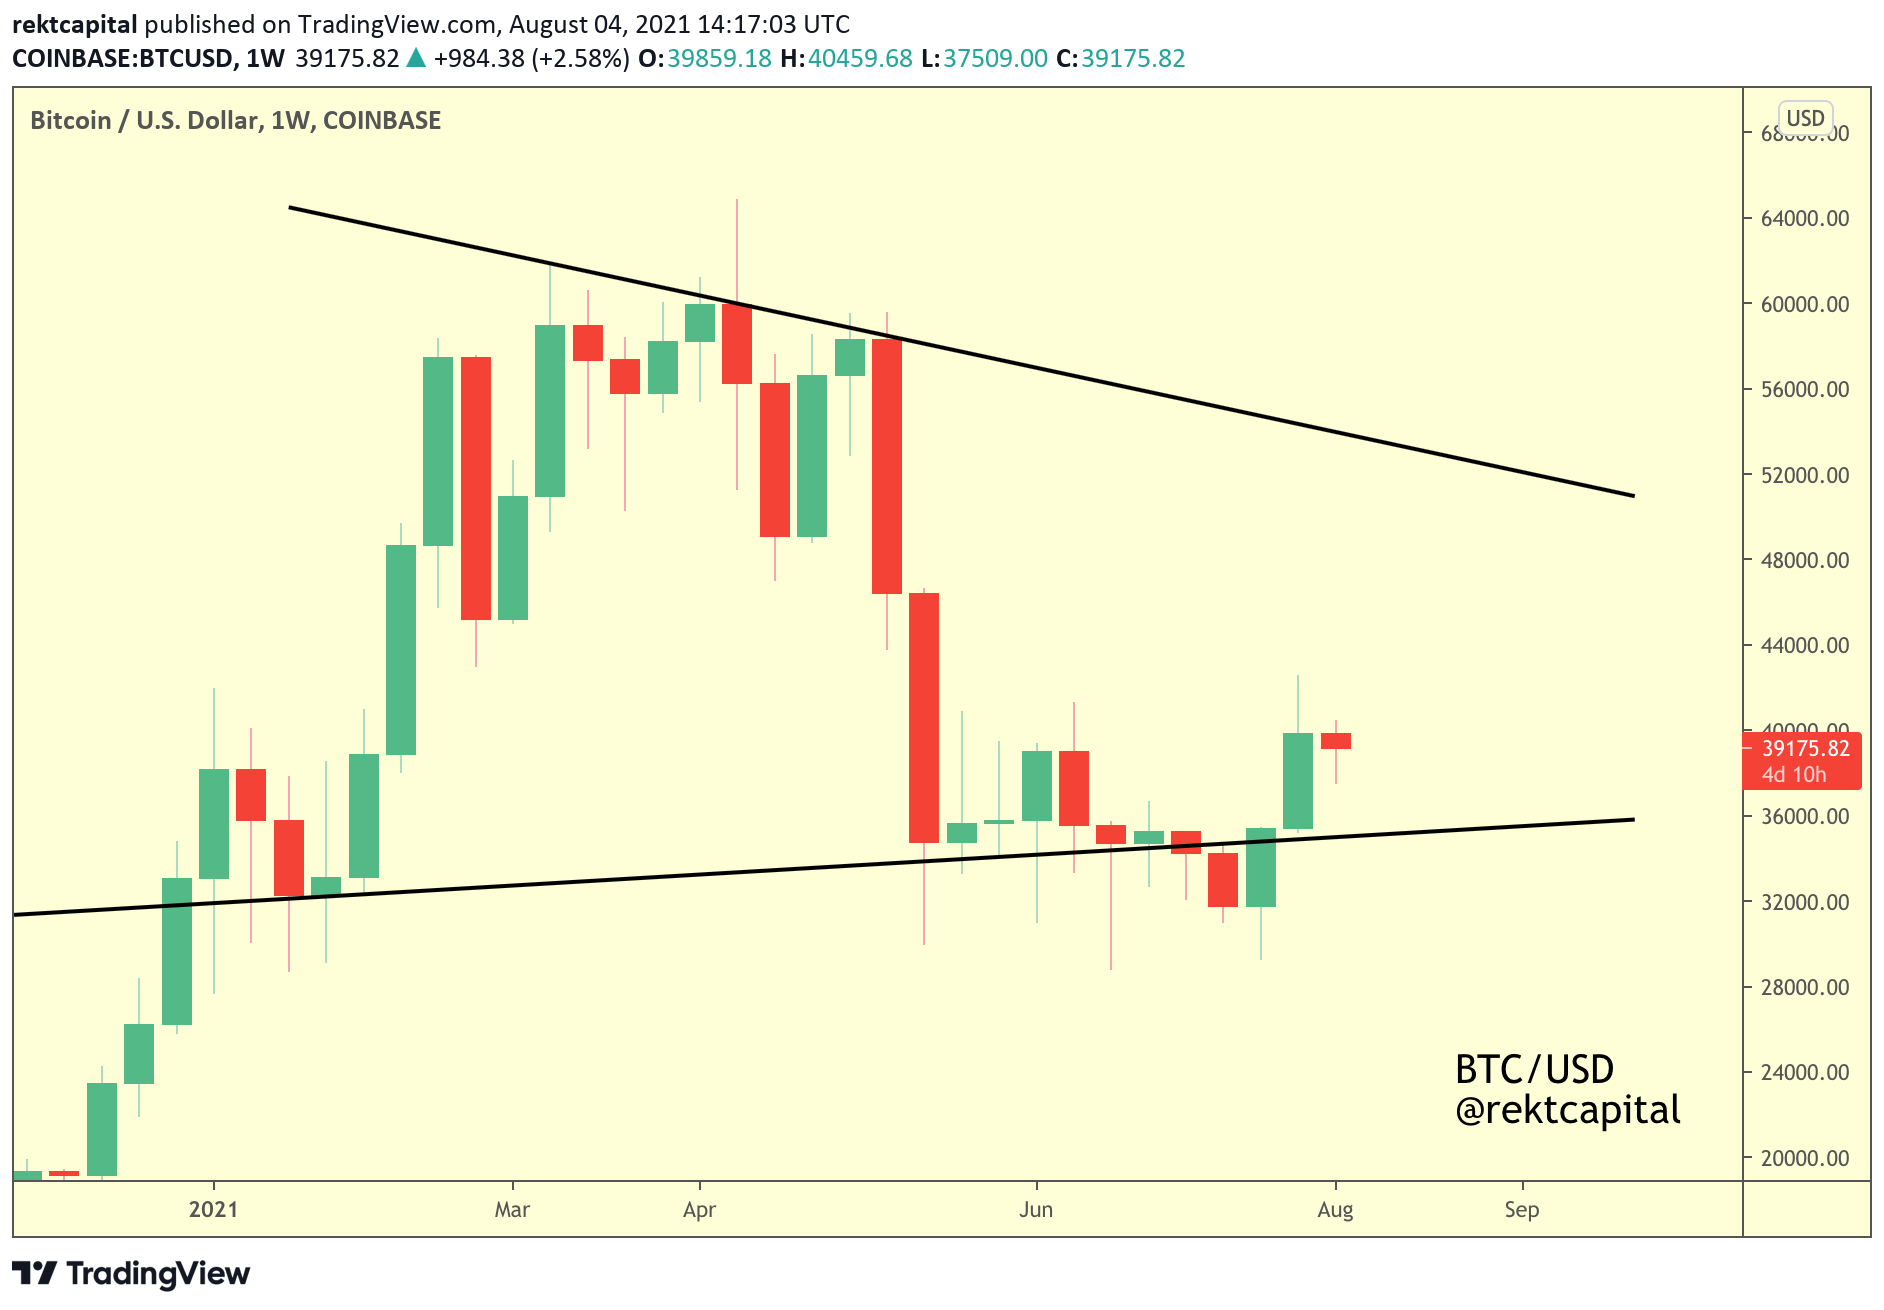
Here is Bitcoin’s market structure from early August 2021:
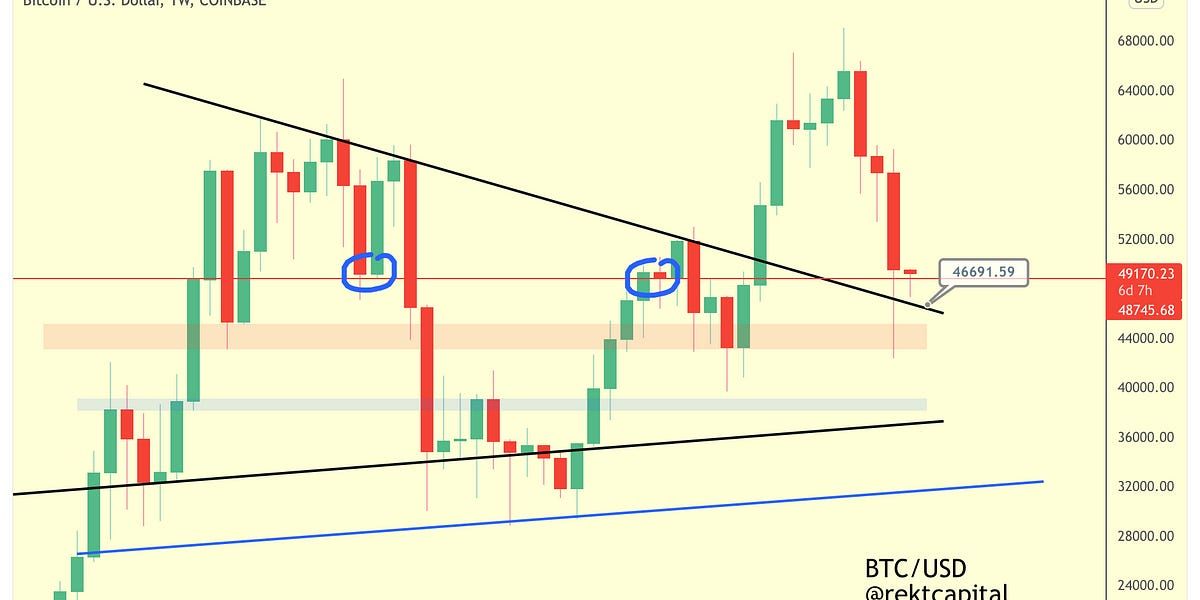
And here is Bitcoin’s market structure today:
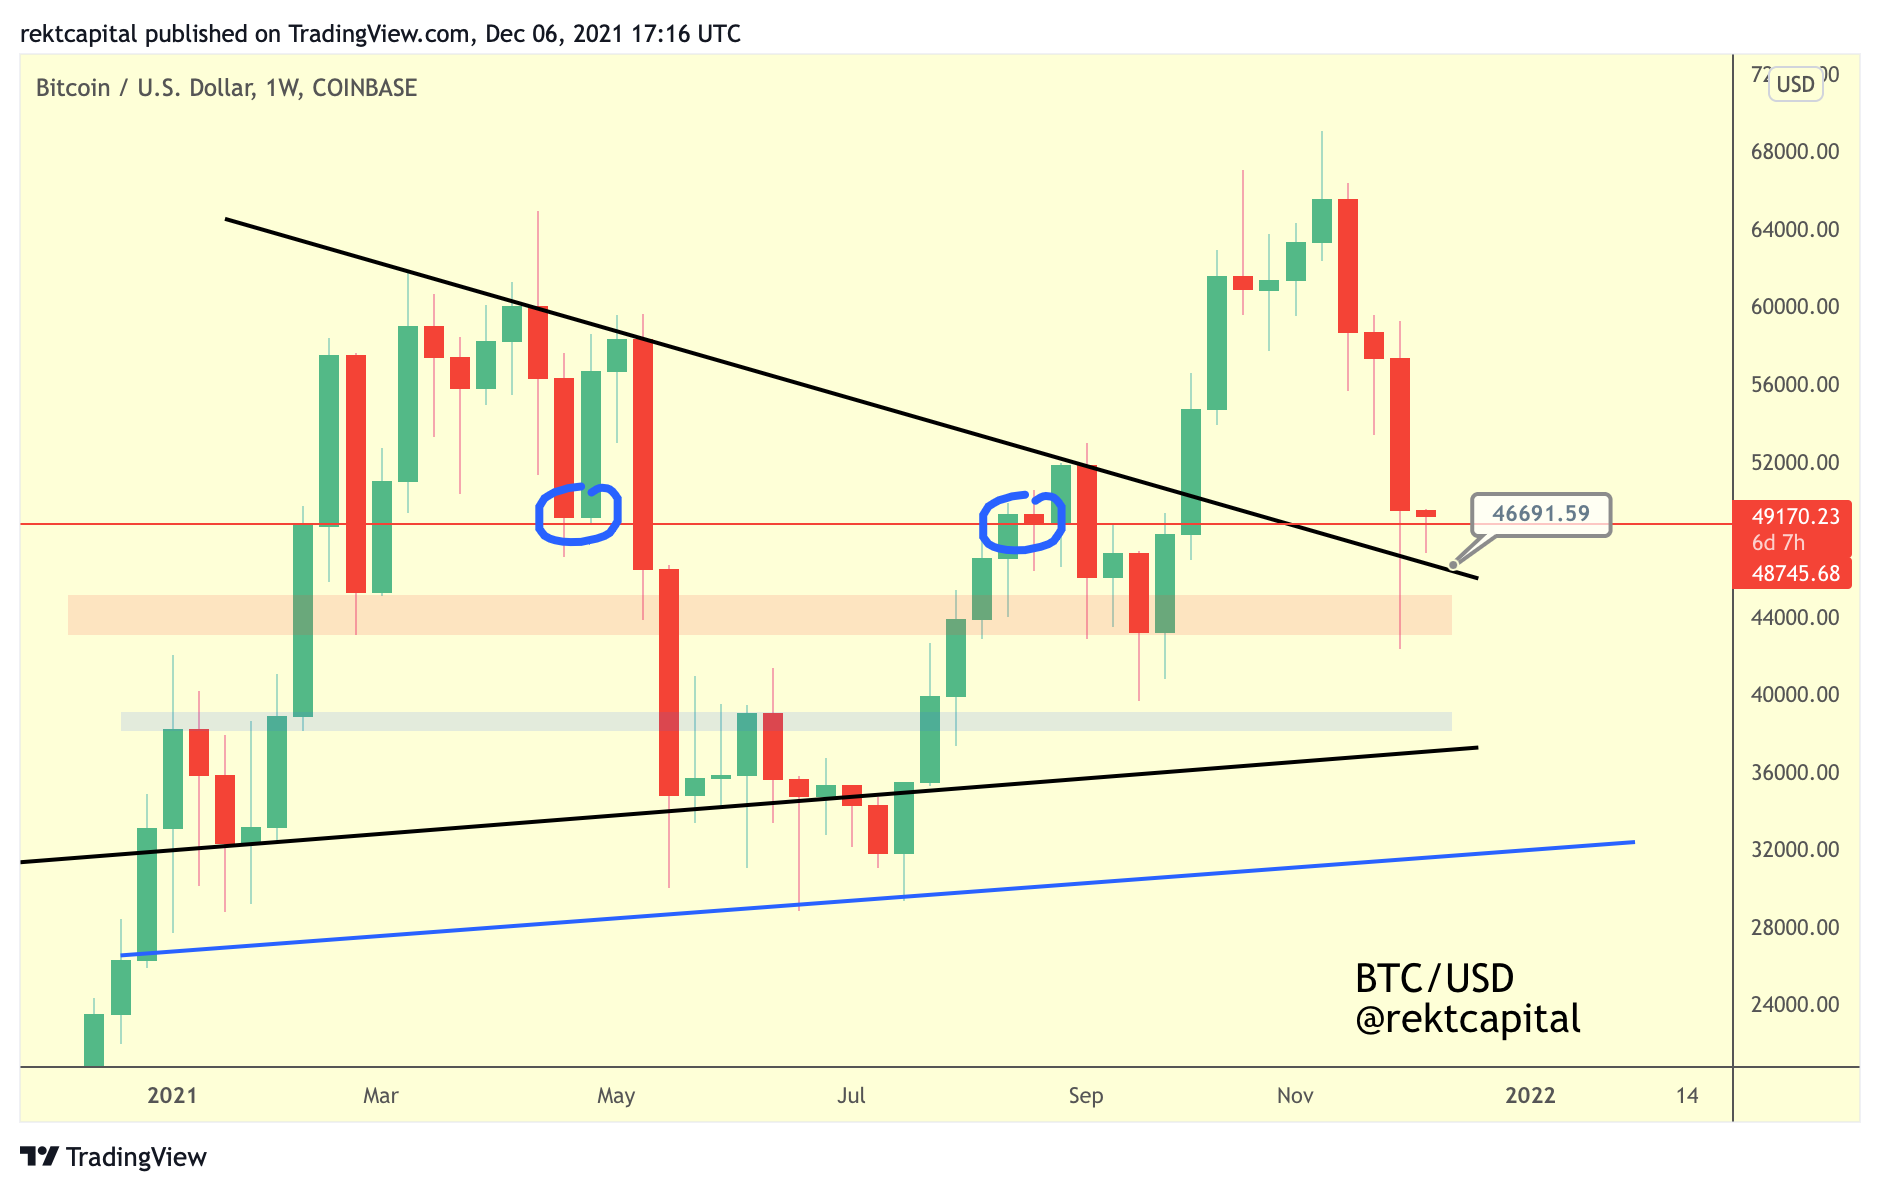
After months of consolidation inside this macro Flagging Structure, Bitcoin broke out from it in early October 2021.
The breakout saw BTC rally to new All Time Highs before retracing towards the very same black diagonal trend line that actually enabled that uptrend.
This return to the trend line is likely a macro retest attempt of the macro Flagging Structure.
Bitcoin needs to flip this previous diagonal resistance into support for the retest to be successful.
Thus far - it has been successful.
In fact, BTC has successfully Weekly Closed above the red horizontal - a support level from which BTC has successfully rebounded from in the past (blue circles).
Though BTC has produced a small downside wick below this red horizontal in an effort to retest the black diagonal, the candle body of this Weekly candle still remains above the red horizontal.
BTC may be forming some early price strength stability here.
In any case, this macro retest is underway and this Weekly red horizontal is supporting this retest.
So far, the retest is successful here.
Speaking of successful retests and price-strength stability at key levels…
Price Stability At Key Fib Curve
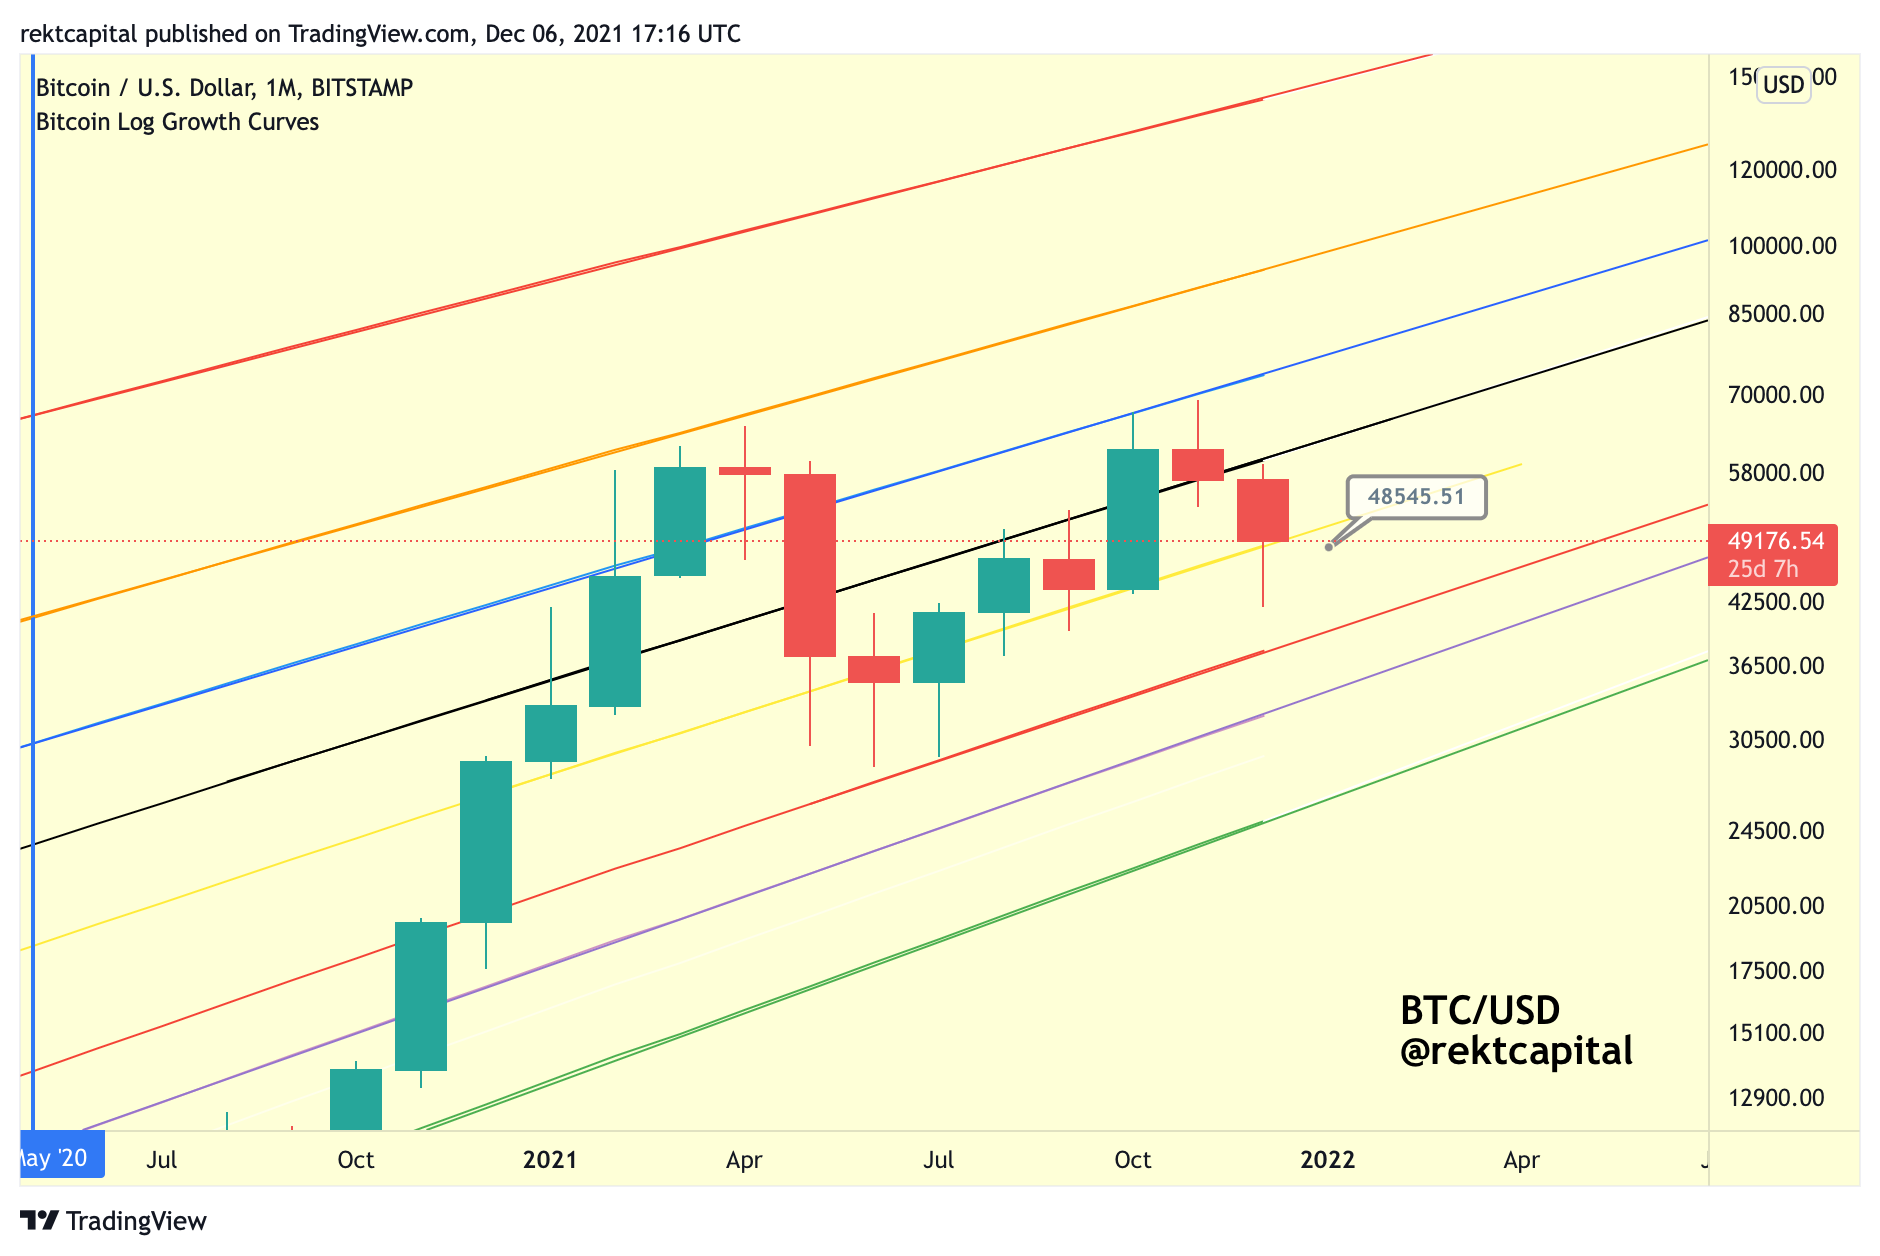
Bitcoin is successfully finding support at the yellow 0.382 Fib Curve of the macro Bitcoin Logarithmic Growth Curve Channel.
This Fib Curve is important as it has historically enabled moves above the black 0.5 Fib Curve resistance.
The black 0.5 Fib Curve resistance is the one that needs to flip into support to propel BTC into the second, more parabolic part of the cycle.
In fact, BTC has been able to retest this black 0.5 Fib Curve as support last month.
However, we’re seeing downside from BTC right now - but if BTC is able to Monthly Candle Close above ~$600000 which is where the black 0.5 Fib Curve is positioned right now, then this downside will have been a very volatile retest attempt of this black 0.5 Fib Curve.
Ideally, BTC needs to Monthly Close above ~$60,000 (i.e. the black 0.5 Fib Curve) but a Monthly Close above the yellow 0.382 Fib Curve wouldn’t necessarily be terrible as this is the Fib Curve that is denoting a macro Higher Low for BTC, which showcases premium-buying behaviour from bargain buyers whenever retraces occurs.
Investors are buying BTC at higher prices whenever BTC dips.
Bitcoin needs to at least Monthly Close above ~$48500 for this buying psychology to remain intact and by the same token - to keep historically recurring tendencies across cycles intact as well.
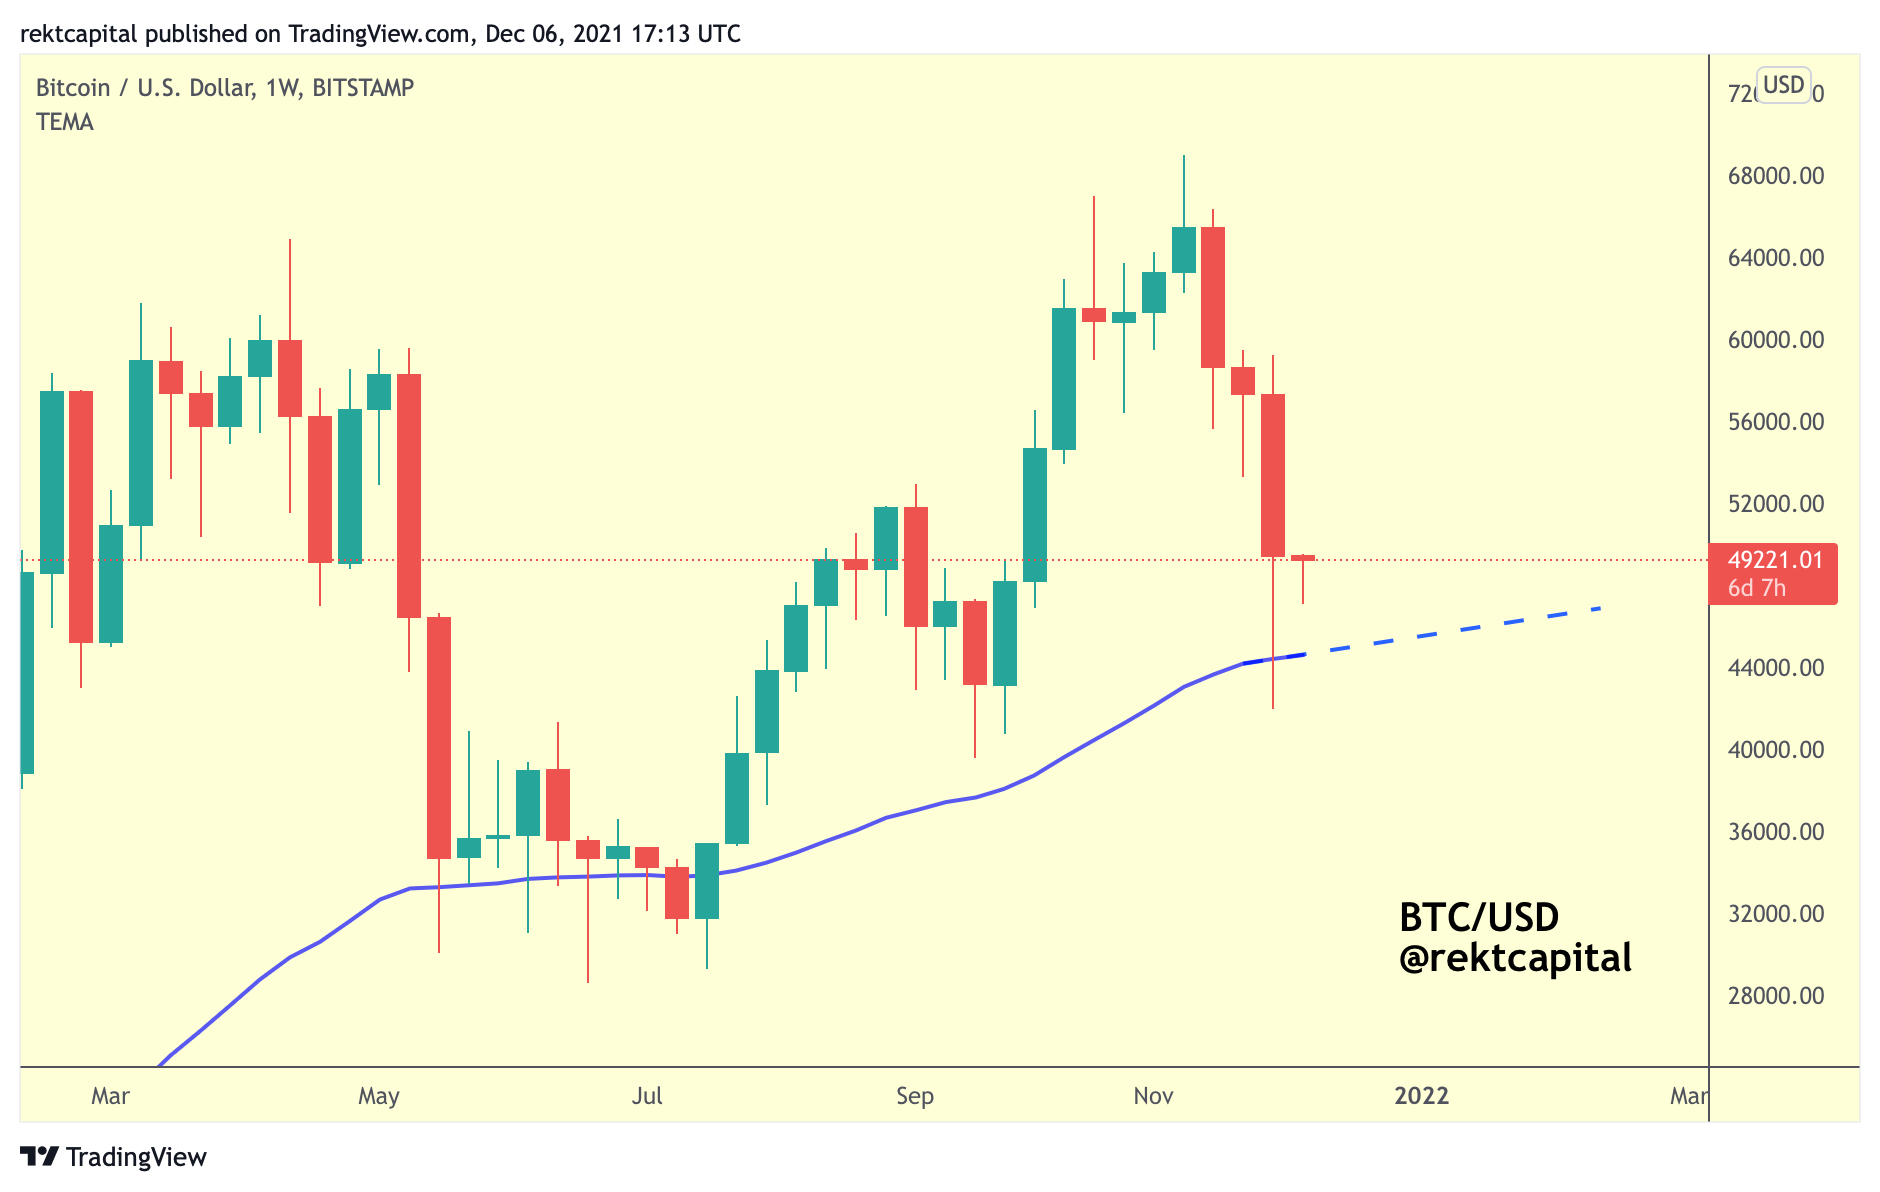
The 50-Week EMA Rebound
Bitcoin recently rebound from the 50-Week EMA on the recent retrace:
This EMA has figured as an important reference point for price in Bull Markets across time, as evidenced in my early June thread about the 50-Week EMA.
In a nutshell, the 50-week EMA figures as valuable support across BTC Bull Markets. Whenever this support is kept, the Bull Market continues.
In fact, whenever BTC crashes - the 50 EMA tends to rescue BTC from further downside. A good example of this tendency is the 2013 cycle:
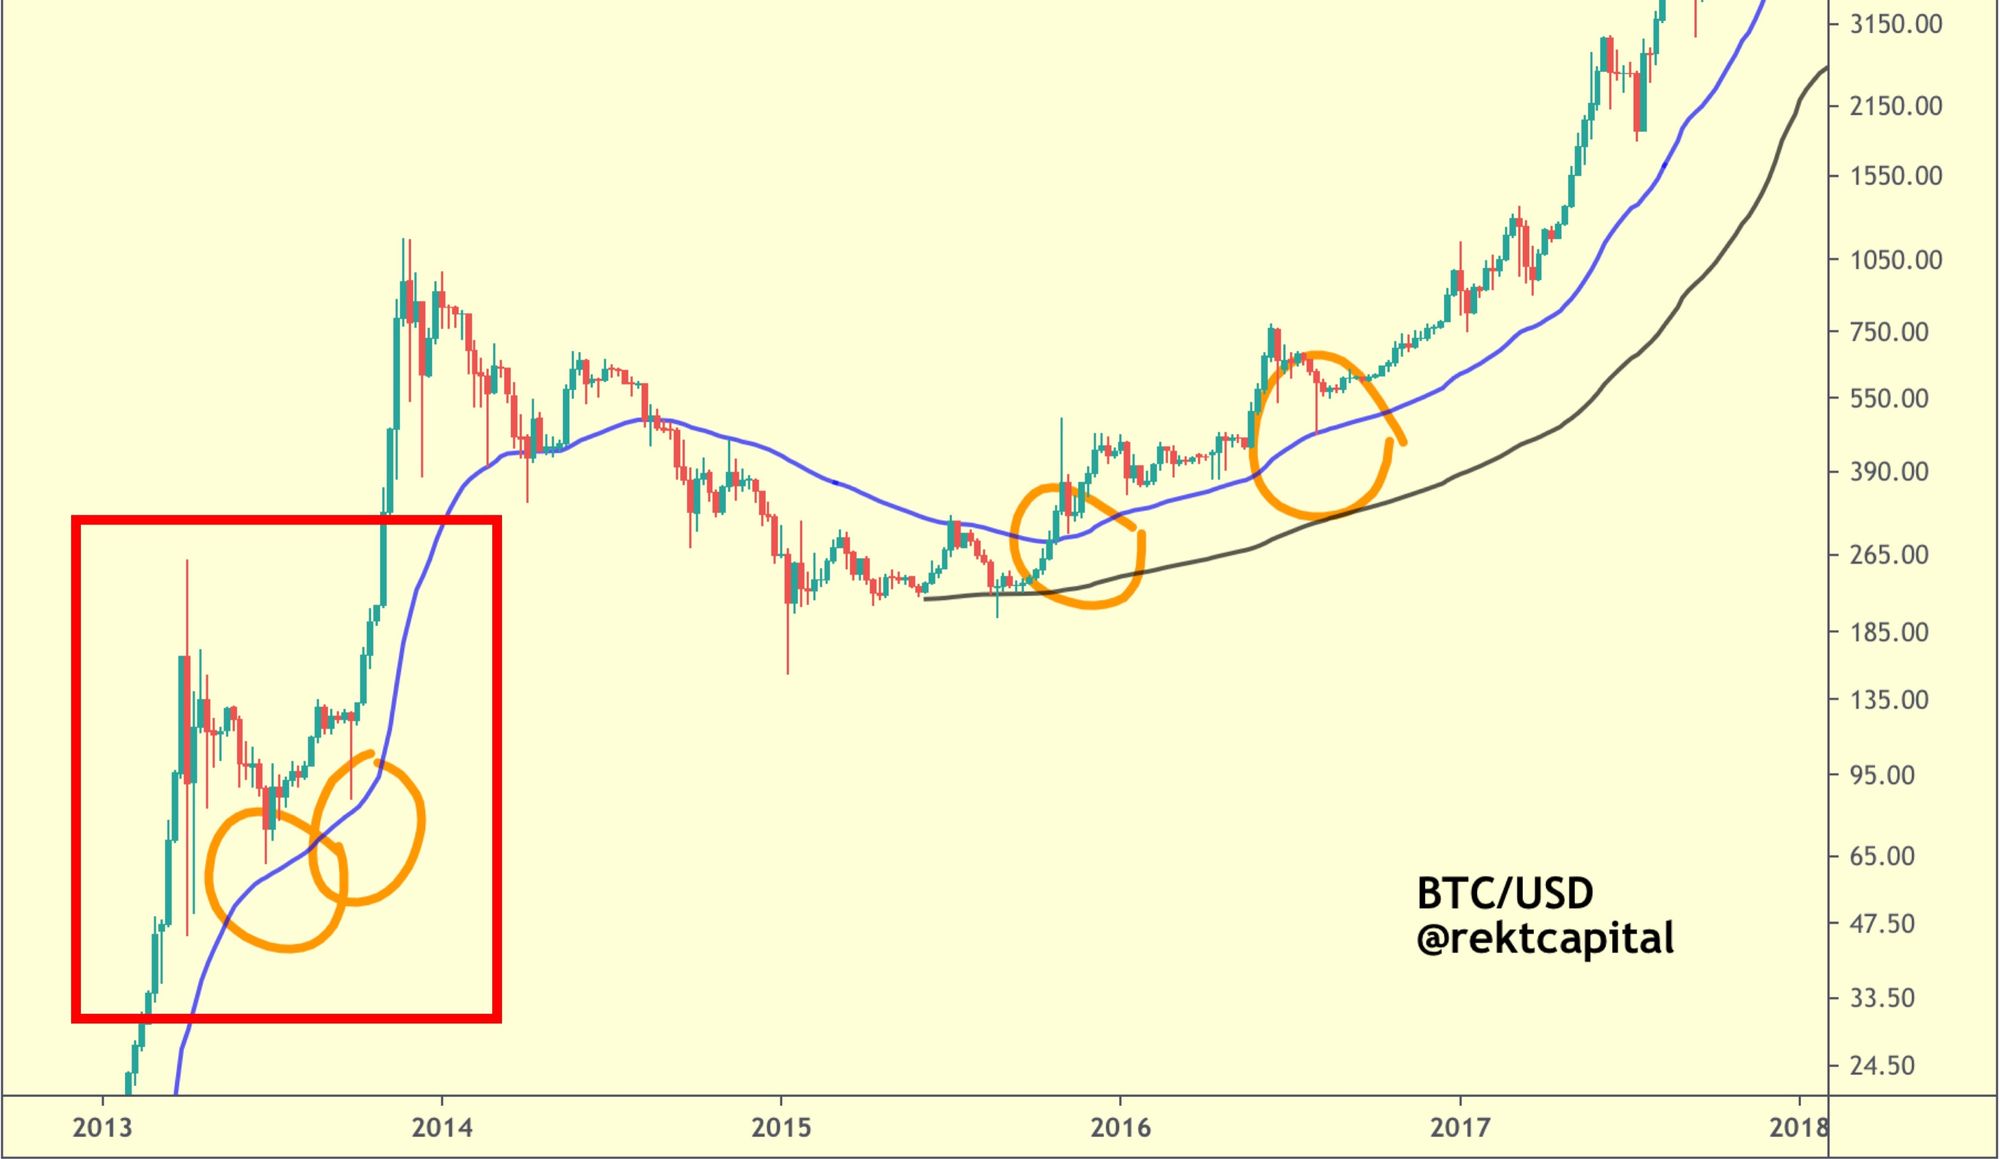
During the mid-cycle of 2021, BTC crashed towards the blue 50-week EMA but never actually contacted it for a retest.
As you can see later, BTC would successfully retest the blue 50-week EMA later on throughout 2016 to facilitate the Bull Trend of the time.
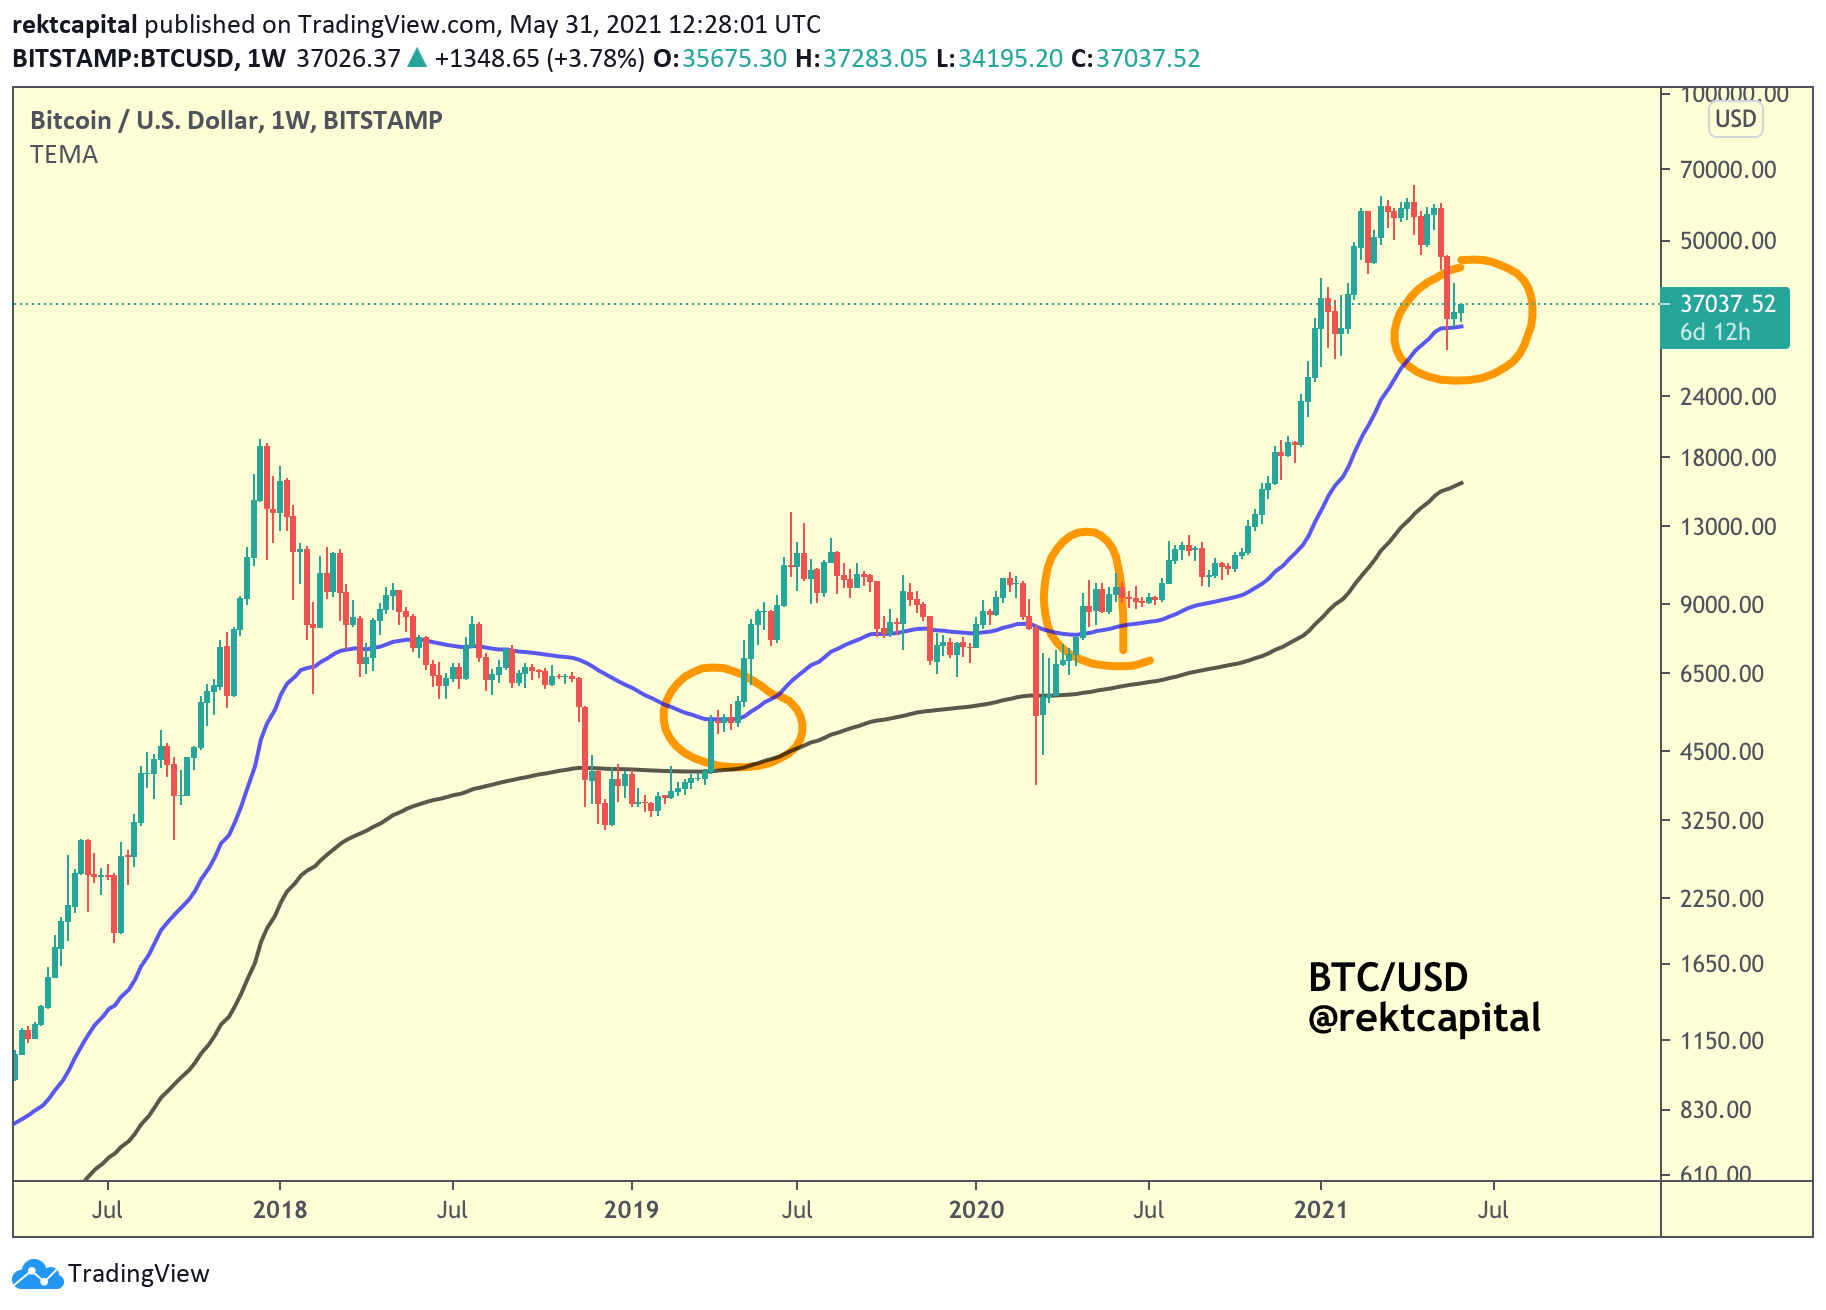
Other times when the 50 EMA facilitated Bull Trends?
In 2019, 2020, and even earlier this year in 2021, when I first created the thread about this key EMA:
All in all, once again BTC is at the 50-week EMA, finding support:

Holding this EMA is important to BTC’s bull-side momentum.
In fact, we saw BTC briefly lose the 50-week EMA earlier this Q2 after holding it as support for months, before ultimately breaking beyond it to reach new All Time Highs.
Generally, for a Bear Market to confirm itself, historically BTC needs to lose the 50-week EMA and then flip it into resistance and the reject price to lower price levels.
BTC is nowhere close to doing such at thing at this time.
So there is a similarity here - BTC now, just like earlier this year, has rebounded from the 50-week EMA.
But that’s not the only similarity we’re seeing right now…
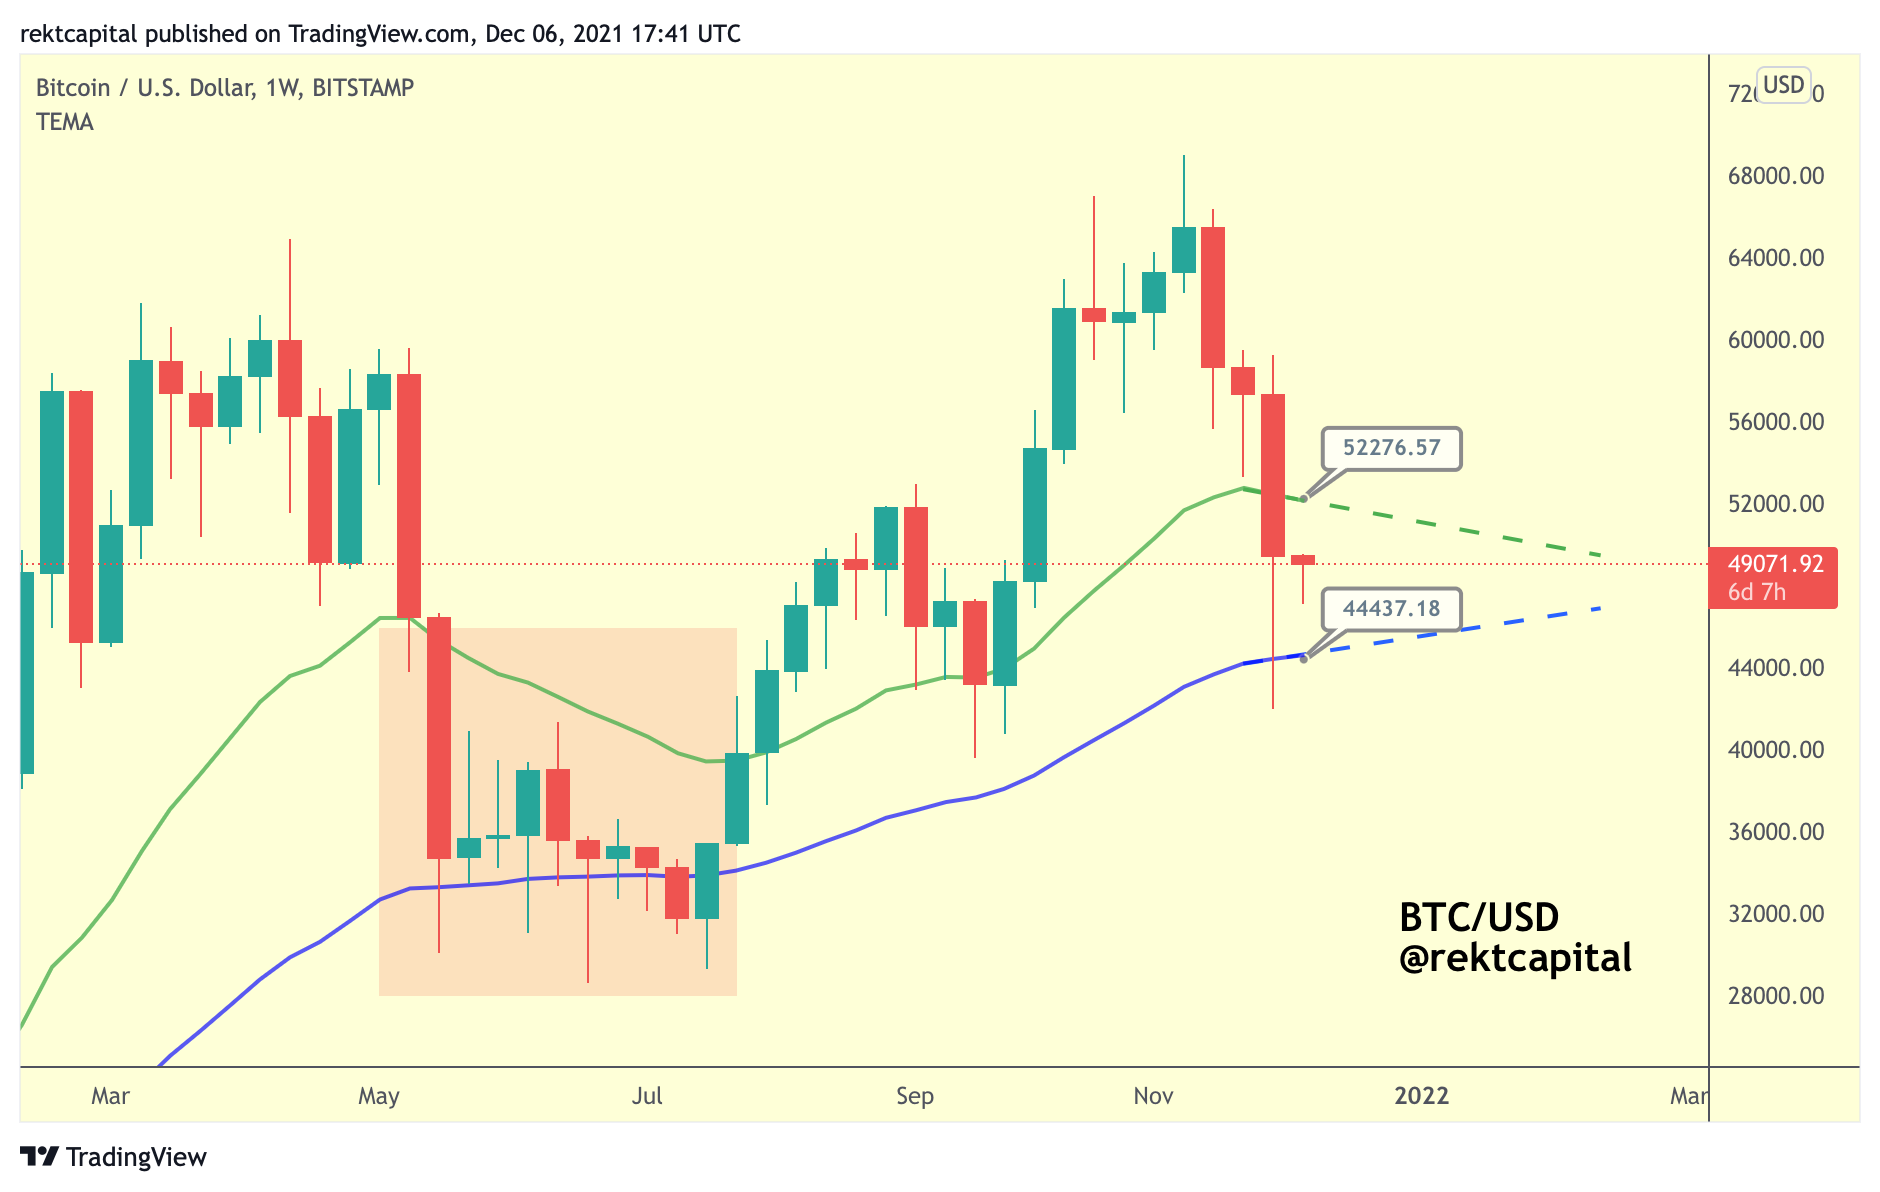
Two Bull Market EMAs
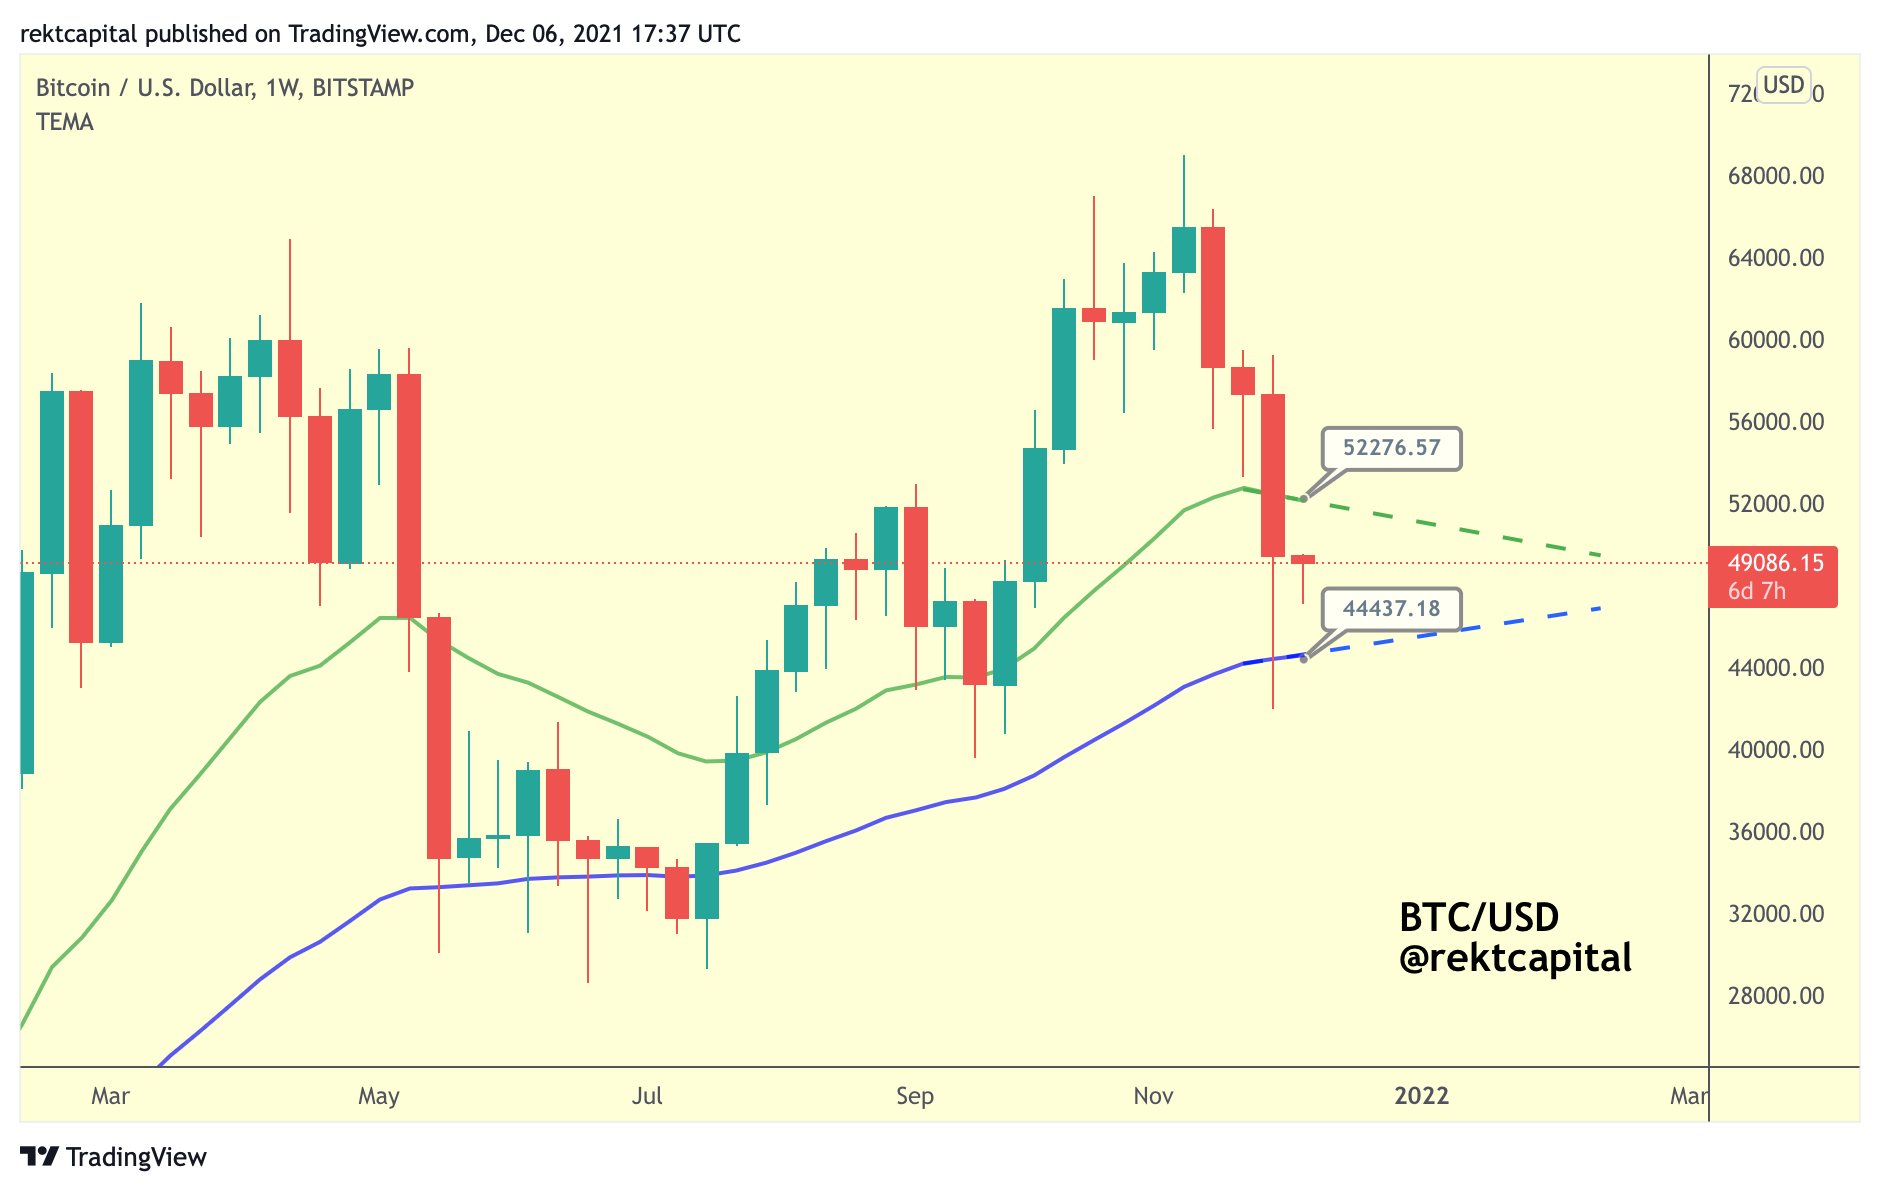
Bitcoin is also sandwiched in between two Bull Market EMAs:
- The blue 50-week EMA which represents a price point of ~$44450 at this time,
- The green 21-week EMA which represents a price point of ~$52250 at this time.
BTC is sandwiched in between these two EMAs now just like it was in Q2 of this year.
In fact, here is a thread that I created which highlighted the consolidation in early June of this year:
Right now, with the recent Weekly Close below the green 21-week EMA, BTC may have confirmed an extended consolidation period at these price levels, showing shades of the consolidation that took place earlier this year (red box):
Pi Cycle Top Indicator
And speaking of similarities to earlier this year - BTC has once again broken down from the Pi Cycle 111-day Moving Average (orange):
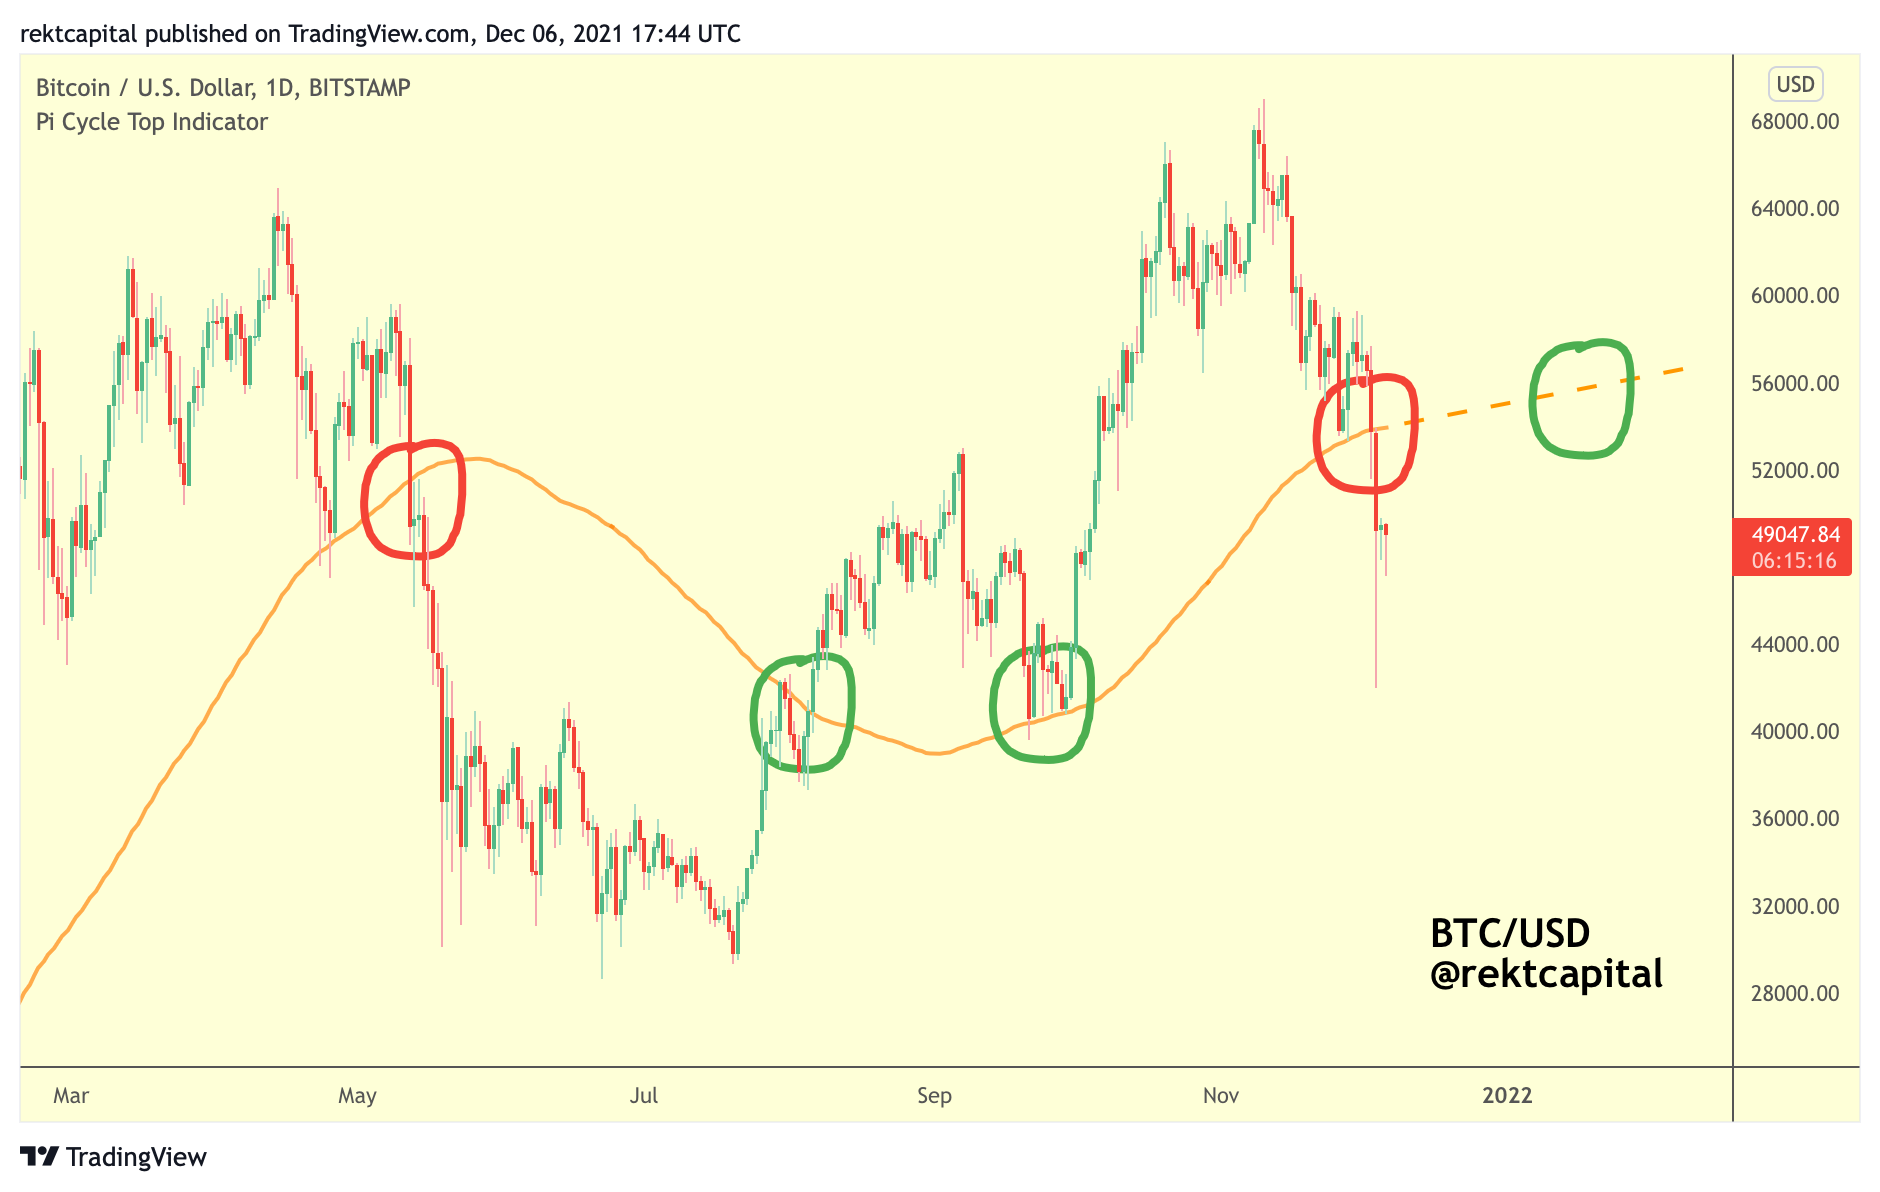
In May, BTC broke down from the Pi Cycle MA (first red cycle) before forming a base at lows and then recovering to break back above the Pi Cycle MA retesting it not once, but twice before making new All Time Highs.
Once again, BTC has lost the Pi Cycle MA but it will be crucial for BTC to reclaim it as support on the upcoming recovery.
The Pi Cycle MA will be located at around the ~$52000-$53000 price area, and so BTC needs to flip this price level into support.
Bear Markets tend to confirm when the orange Pi Cycle 111-day MA flips into resistance on the recovery.
However, the problem with talking about this tendency in isolation is that Pi Cycle Crossovers need to occur for Bear Markets to take place:
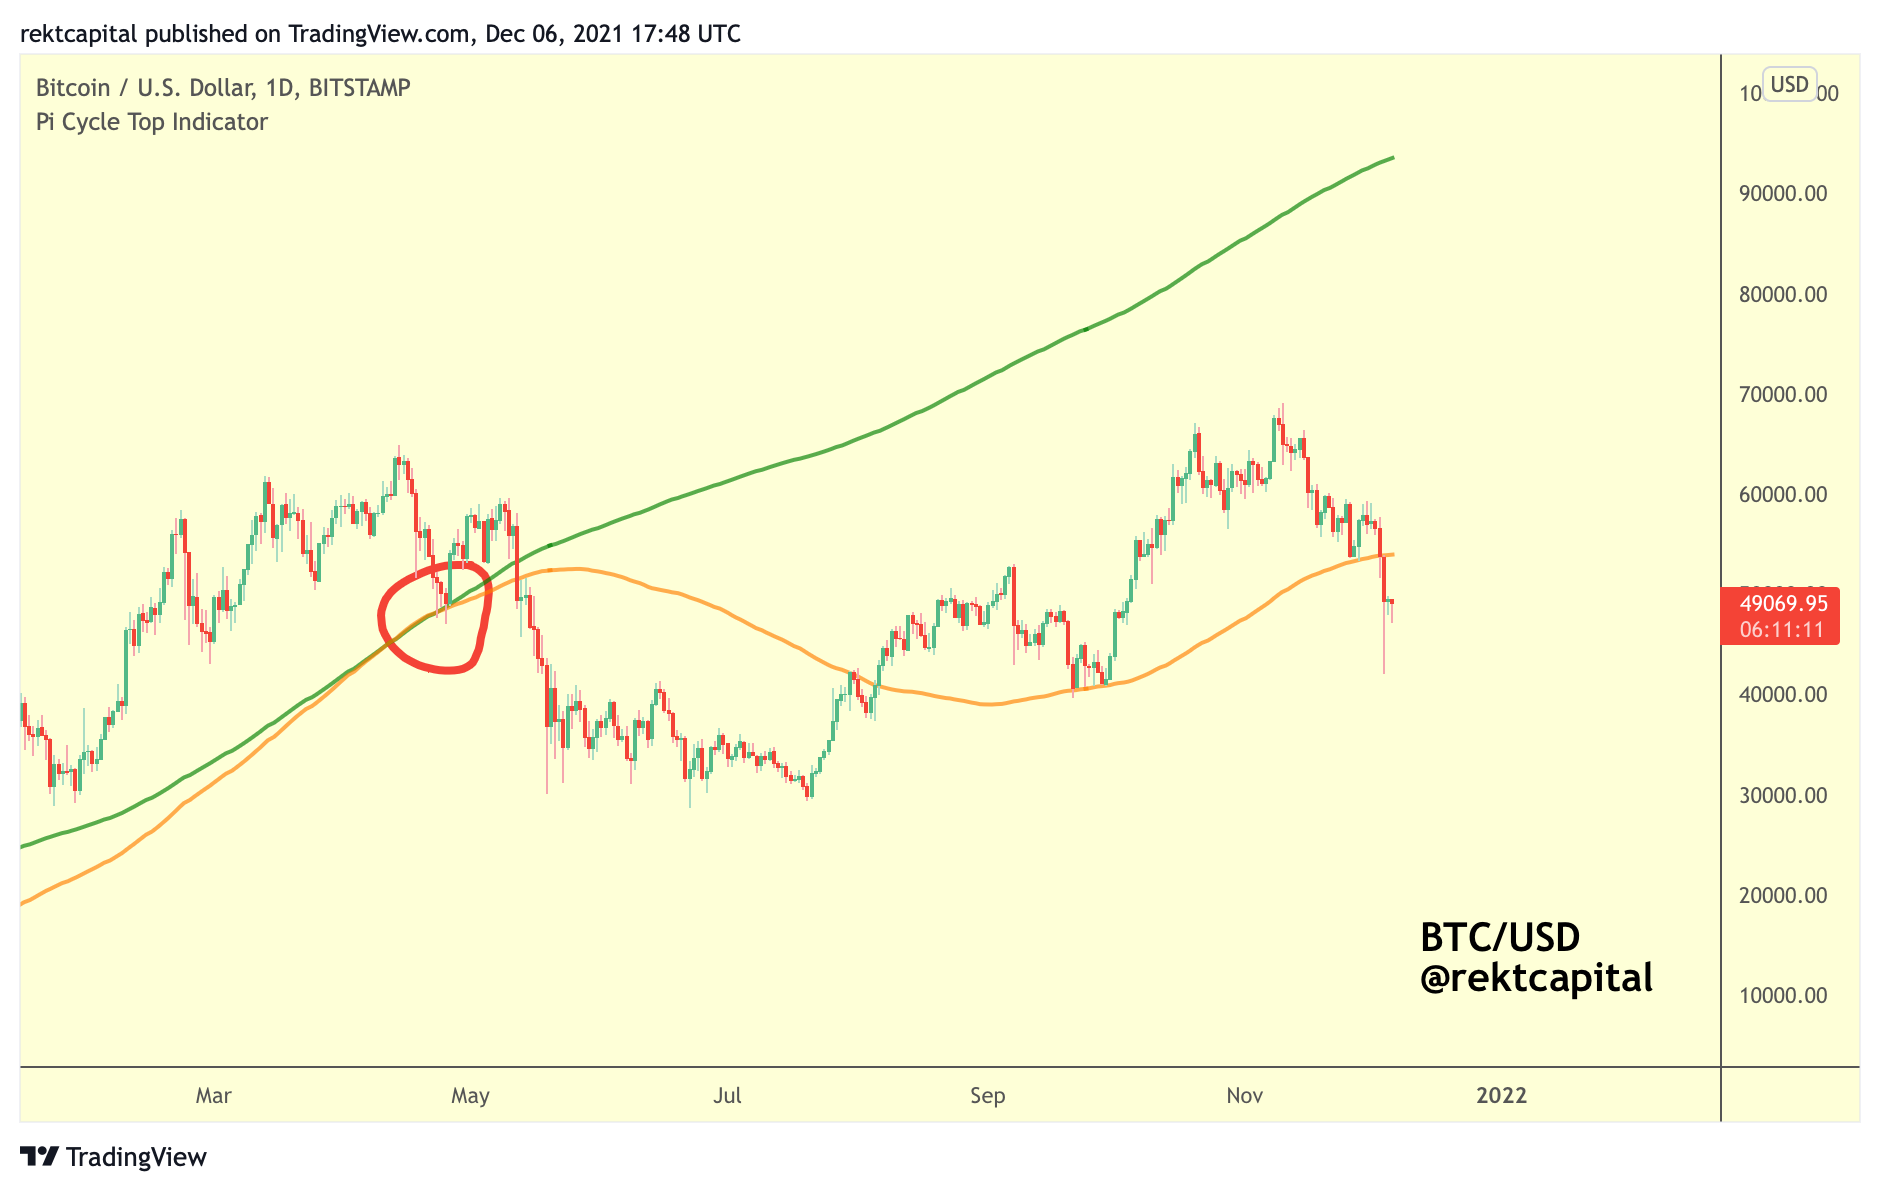
Yes, one Pi Cycle Top Crossover took place earlier this year, but the thing about Pi Cycle Crossovers is that they either denote Local Tops or entire Market Cycle Tops.
In May, the Pi Cycle Top Indicator perfectly denoted a Local Top as BTC went on to make new All Time Highs months later.
However, the two Pi Cycle MAs (green, orange) are nowhere close to crossing over a second time - and crossovers tend to occur within days of a BTC Local/Market Cycle Top.
The fact that there has been no second Pi Cycle Crossover or the mere fact that this Crossover is nowhere close to happening any time soon suggests that BTC simply hasn’t experienced a Market Cycle Top.
Data-Driven Insights & Level-Headed Approach
At times like these, it is crucial important to observe the data science models (Bitcoin Logarithmic Growth Curves, the Pi Cycle Top Indicator) as well as some key Bull Market Indicators (Macro Flags, pivotal EMAs).
Price action analysis and data-science is all about helping us navigate with a level-head the emotional rollercoaster that comes along with periods of extreme volatility.
I’m launching my new Bitcoin Investing course which focuses on exactly this: unbiased data science models and cutting-edge exploratory tools to help investors be confident about the market, reduce confusion when it comes to their investment strategies, and perhaps most importantly - learn how to navigate the market without any emotion but instead navigate the market with macro strategy.
Short-term volatility is designed to distract you from the macro perspective of what’s actually going on in the cycle.
Increase Confidence, Reduce Confusion
“Bitcoin Investing” will give you necessary tools to understand where we are in the cycle, how to properly time Bull Market peaks, what signs to watch out for for legitimate beginnings of a new Bear Market and so much more.
Ultimately, Bitcoin Investing is a resource designed to help you have a strategy in place to secure life-changing returns on your Crypto investment.
“Bitcoin Investing” will help you transform into a seasoned investor who doesn’t get swayed by volatility and is firmly grounded in their strategy that is fundamentally underpinned by stone cold analytics and level-headed insights stemming from data science models and other cutting-edge exploratory tools.
Over the coming days, I will share more data-driven insights in the Rekt Capital Newsletter to help you better navigate this retracement period.
We’ll be talking more about lengthening cycles and how this cycle is showing shades of not only 2013 price tendencies, but also 2017 price tendencies as well.
Thank you for reading and stay tuned.