Deeper Dip Coming For Bitcoin?
And if so, is it really worth worrying about?
Welcome to the Rekt Capital newsletter, a place for people who want to better navigate the crypto markets with the help of cutting-edge crypto research and unbiased market analysis.
You have ⏰ 2 days left ⏰ to join the Rekt Capital Hall of Fame plan to get access to the brand new upcoming TA video series “My Top 10 Altcoins with 10X Potential” along with annual access to the Premium newsletter.
Upgrade now and unlock your chance to change your financial future in the upcoming bull market:
Bitcoin Historical Accumulation Area
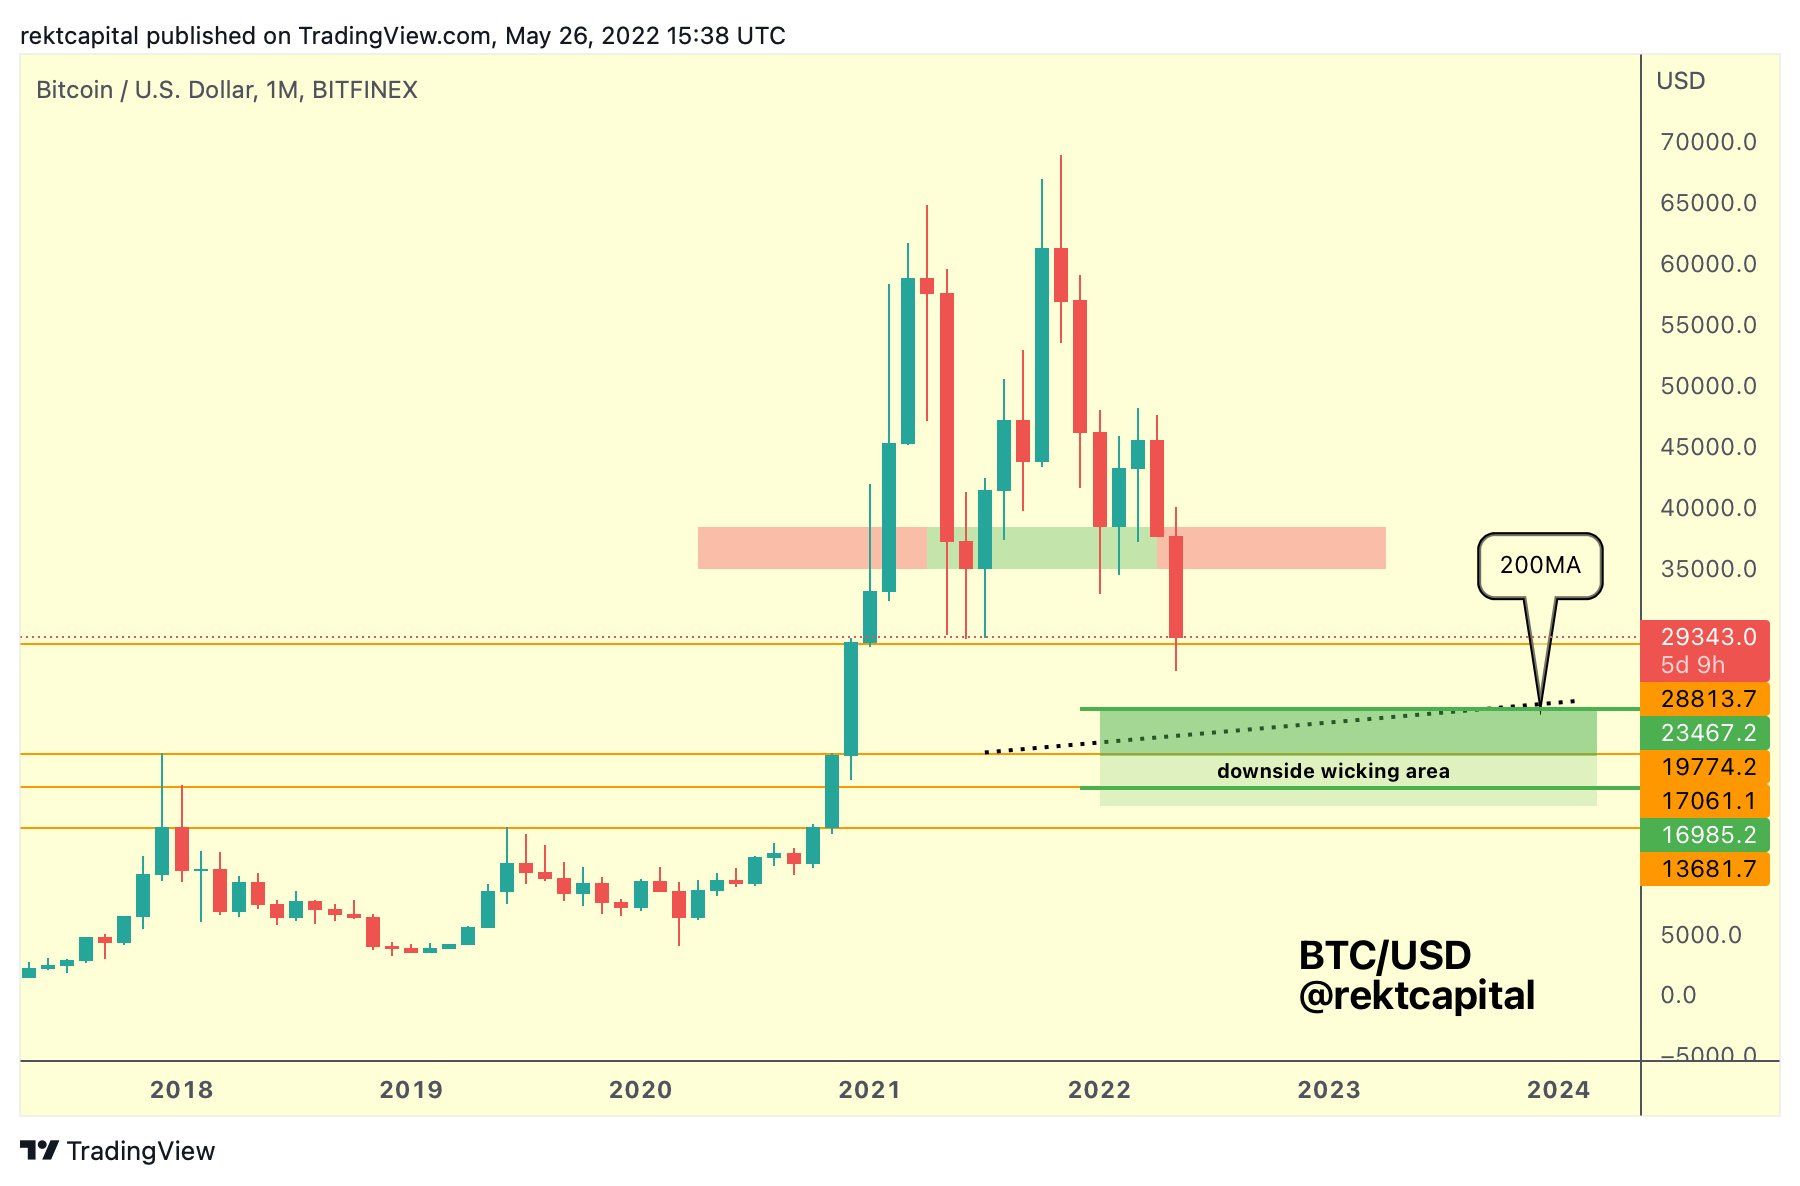
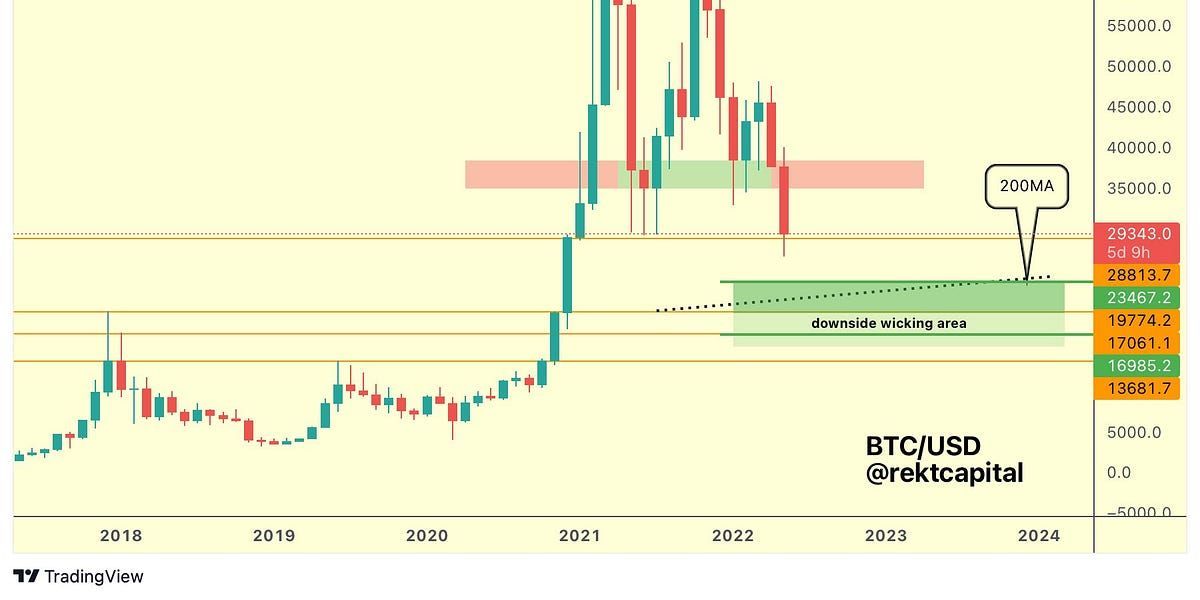
In late May 2022, I post a BTC chart to Twitter which featured a historical Accumulation Area (green) based on historical post-Death Cross retracement depths.
What are post-Death Cross retracement depths?
They are the % depth of correction that occur only after Bitcoin experiences a Death Cross crossover. A Death Cross is when the 50-day EMA cross down below the 200-day EMA.
These two EMAs are useful bullish-trend indicators. The 50 EMA is more of a short-term momentum indicator whereas the 200-day EMA more of an graphical representation of long-term investor sentiment.
In any case, Death Cross crossovers are bearish and preceded deeper downside.
And this downside has ranged from around -40% to even -70% in extreme cases like in 2013/2014.
And it was based on these varying retracement depths that this accumulation area was deduced.
Here is today’s update on that chart:
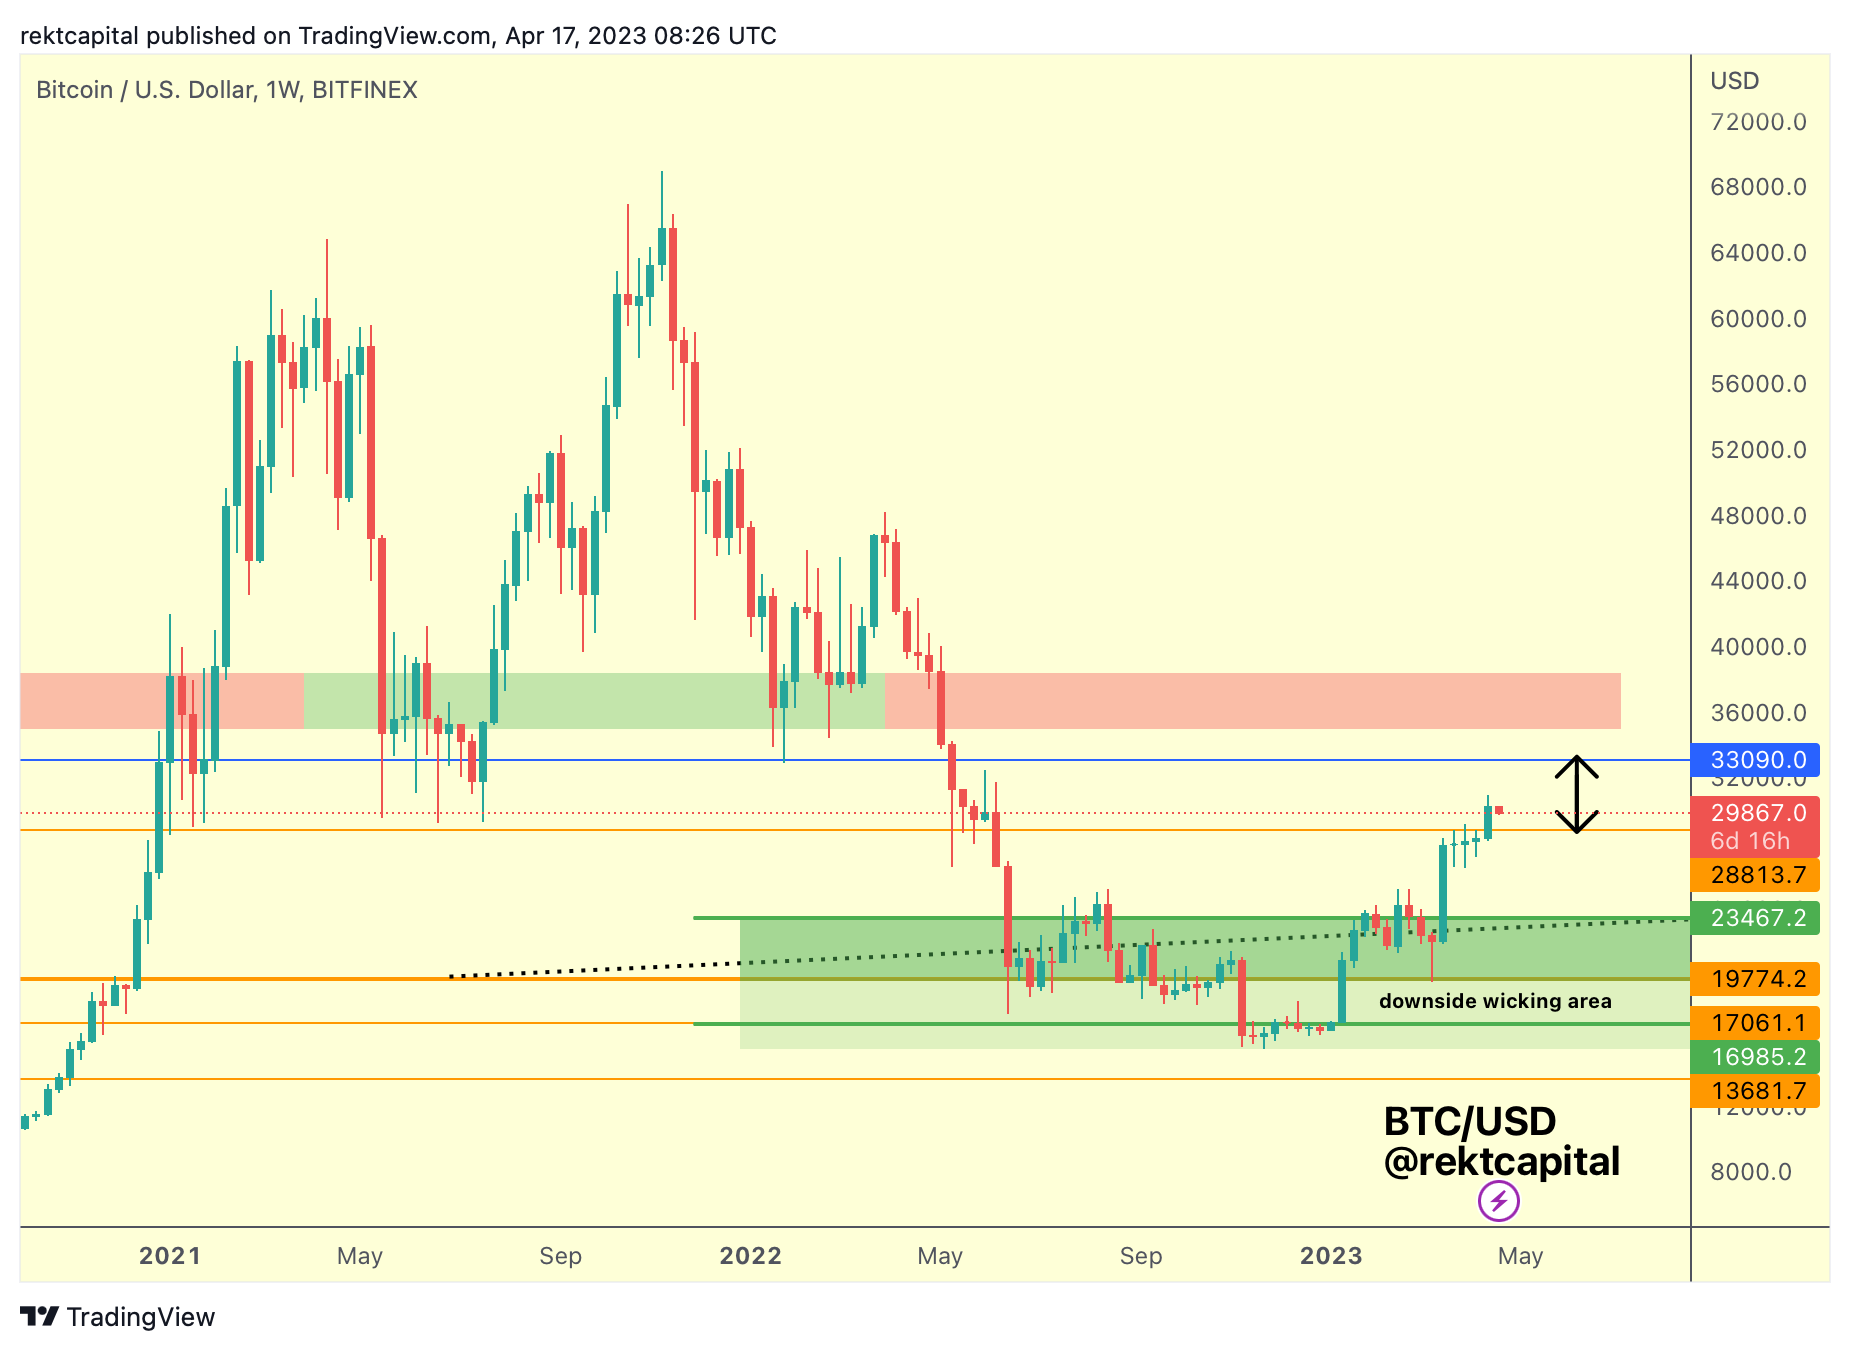
Of course, BTC touched almost the very bottom of that Accumulation Area at around $15500.
But price has since reversed and rallied to the ~$30,000 area.
Let’s turn our attention to the orange level which was already drawn on the chart in late May 2022 as well.
This is a Monthly level which once acted as resistance in late 2020 and acted as strong support in 2021.
In this cycle of 2023, BTC struggled to break beyond the orange level of ~$28800 for multiple weeks, forming a consolidation period at highs but ultimately breaching it last week.
In fact, BTC has printed a very favourably Weekly Close above ~$28800, confirming that the resistance is broken but a dip could be possible to solidify this same level as support.
And so BTC is positioned for a retest of $28800 as support and a successful retest would enable further upside.