Bitcoin – What's Next For Bitcoin?
What does this downside mean in the grander scheme of things?
Welcome to the Rekt Capital Newsletter, a resource for investors who want to better navigate the crypto markets with the help of cutting-edge crypto research and unbiased market analysis.
Bitcoin Remains Trapped Inside the Weekly Range

Bitcoin has printed yet another Weekly Close inside the broader range, continuing to consolidate between approximately $86,200 and $93,500 as price remains unable to escape this structure.
Over the past few weeks, Bitcoin has clearly been Weekly Closing below the Range High, reinforcing the range-bound environment.
This behaviour underscores that Bitcoin has not accepted higher prices on a sustained basis, despite prior upside acceleration via upside wicks beyond the Range High that briefly carried price above the range.
Instead, price has reverted back into consolidation, signalling that the market continues to transact within clearly defined boundaries rather than trend decisively.
In fact, after three consecutive weeks of rejecting from the Range High, price has now dropped into the Range Low of the range-bound construction for yet another price-strength confirmation milestone to check if the bottom of the range will hold.
Generally, the stability of this range has been predicated on price downside wicking into the pool of liquidity (light blue) resting beneath the range; perhaps another such dip into the pool would be sufficient to sustain the range going forward.
Weekly EMAs Compress Beneath the Range High
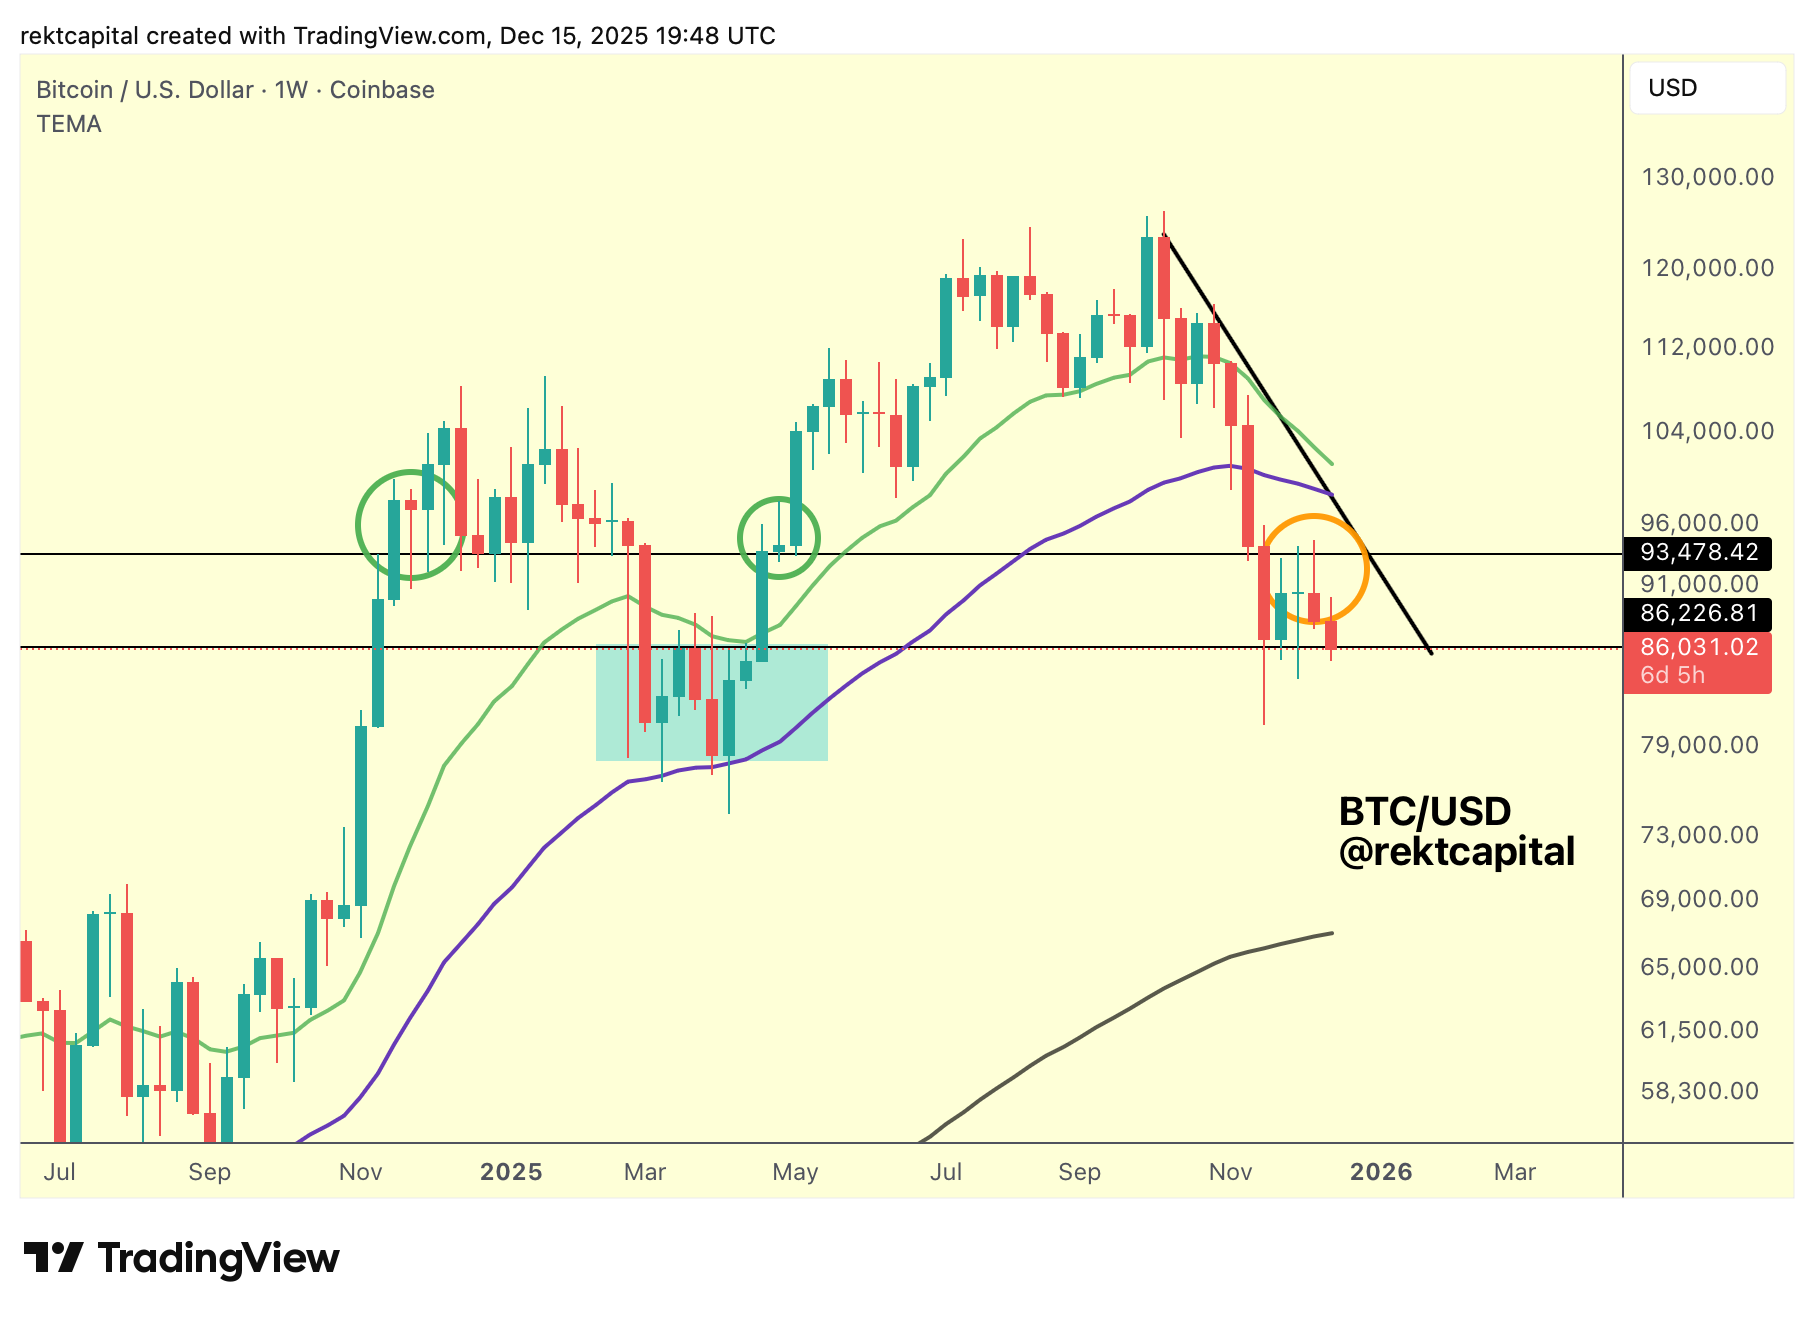
Despite Bitcoin continuing to hold a Higher Low within the Weekly Range, the broader Weekly structure is tightening as the 21-Week EMA (blue) and 50-Week EMA (green) converge beneath price.
The recent push toward the Range High briefly lifted these EMAs, but the subsequent rejection has resumed their inward compression.
This convergence is time-sensitive.
Based on current positioning, the two Weekly EMAs are likely to crossover around mid-January 2026, though the exact timing remains fluid, as any interim relief rally would naturally distort that trajectory.
What matters is not the date, but the structural signal the compression represents.
Historically, when these Bull Market EMAs cross, Bitcoin has tended to form relief cluster of several weeks rather than an immediate continuation.
That pattern typically unfolds as a cluster of sideways or modestly recovering candles before broader downside resumes, aligning with the possibility of relief extending through Q1 rather than resolving immediately.