Bitcoin - What's Next?
How deep could Bitcoin go?
Welcome to the Rekt Capital Newsletter, a resource for investors who want to better navigate the crypto markets with the help of cutting-edge crypto research and unbiased market analysis.
The RSI Downtrend vs Price Downtrend
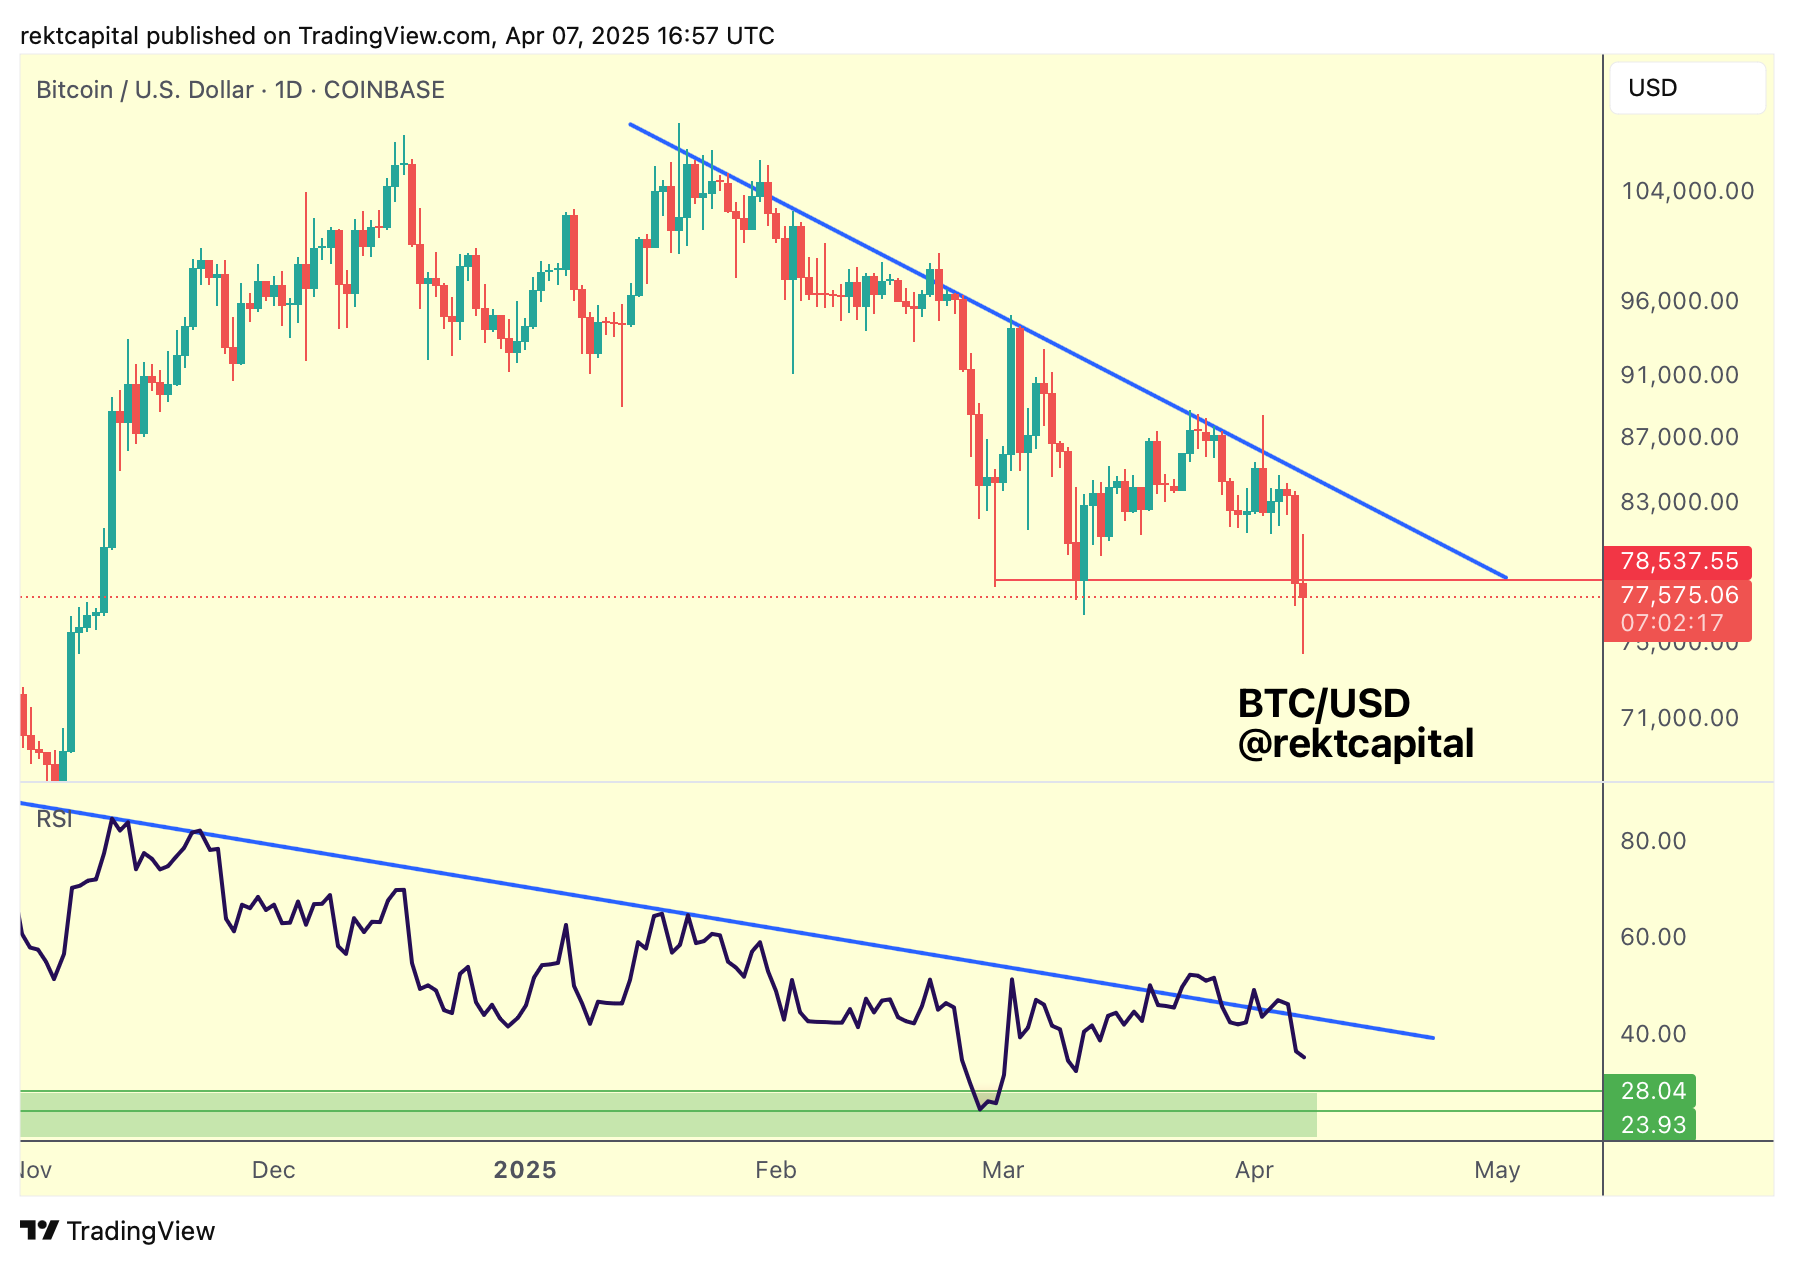
Bitcoin failed to break beyond its Price Downtrend and in the parallel universe, the RSI failed to post-breakout its RSI Downtrend into new support, sustainably.
And in the absence of these two confirmations of breaking respective Downtrends, price wasn't able to manifest strength.
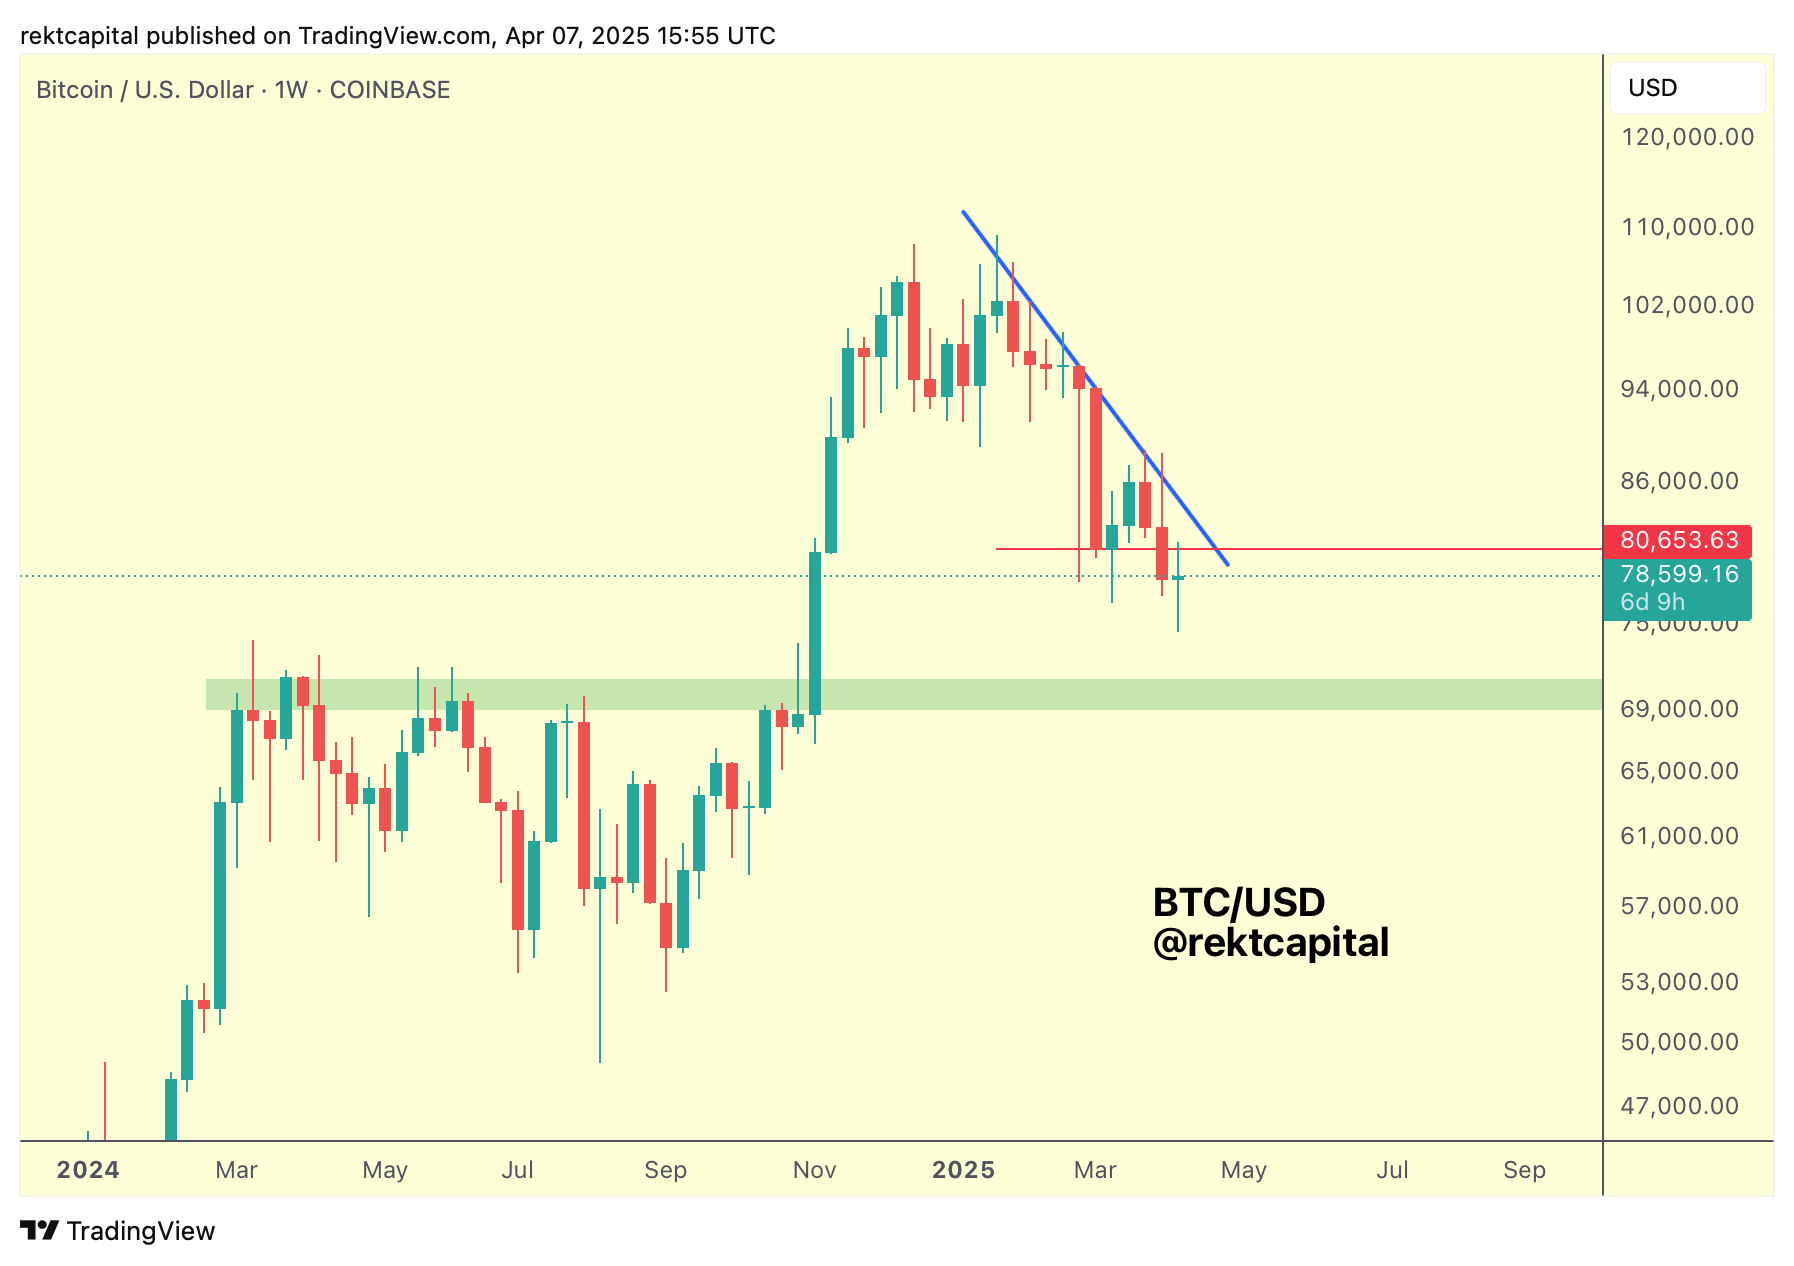
In fact, BTC recently Daily Closed below the March lows of $78500 (red) and price is showcasing initial signs of turning these lows into new resistance.
This is also demonstrating itself on the Weekly timeframe as well.
But before we discuss the Weekly, it's still worth looking at the historical Daily RSI tendencies.
Historical Daily RSI Tendencies
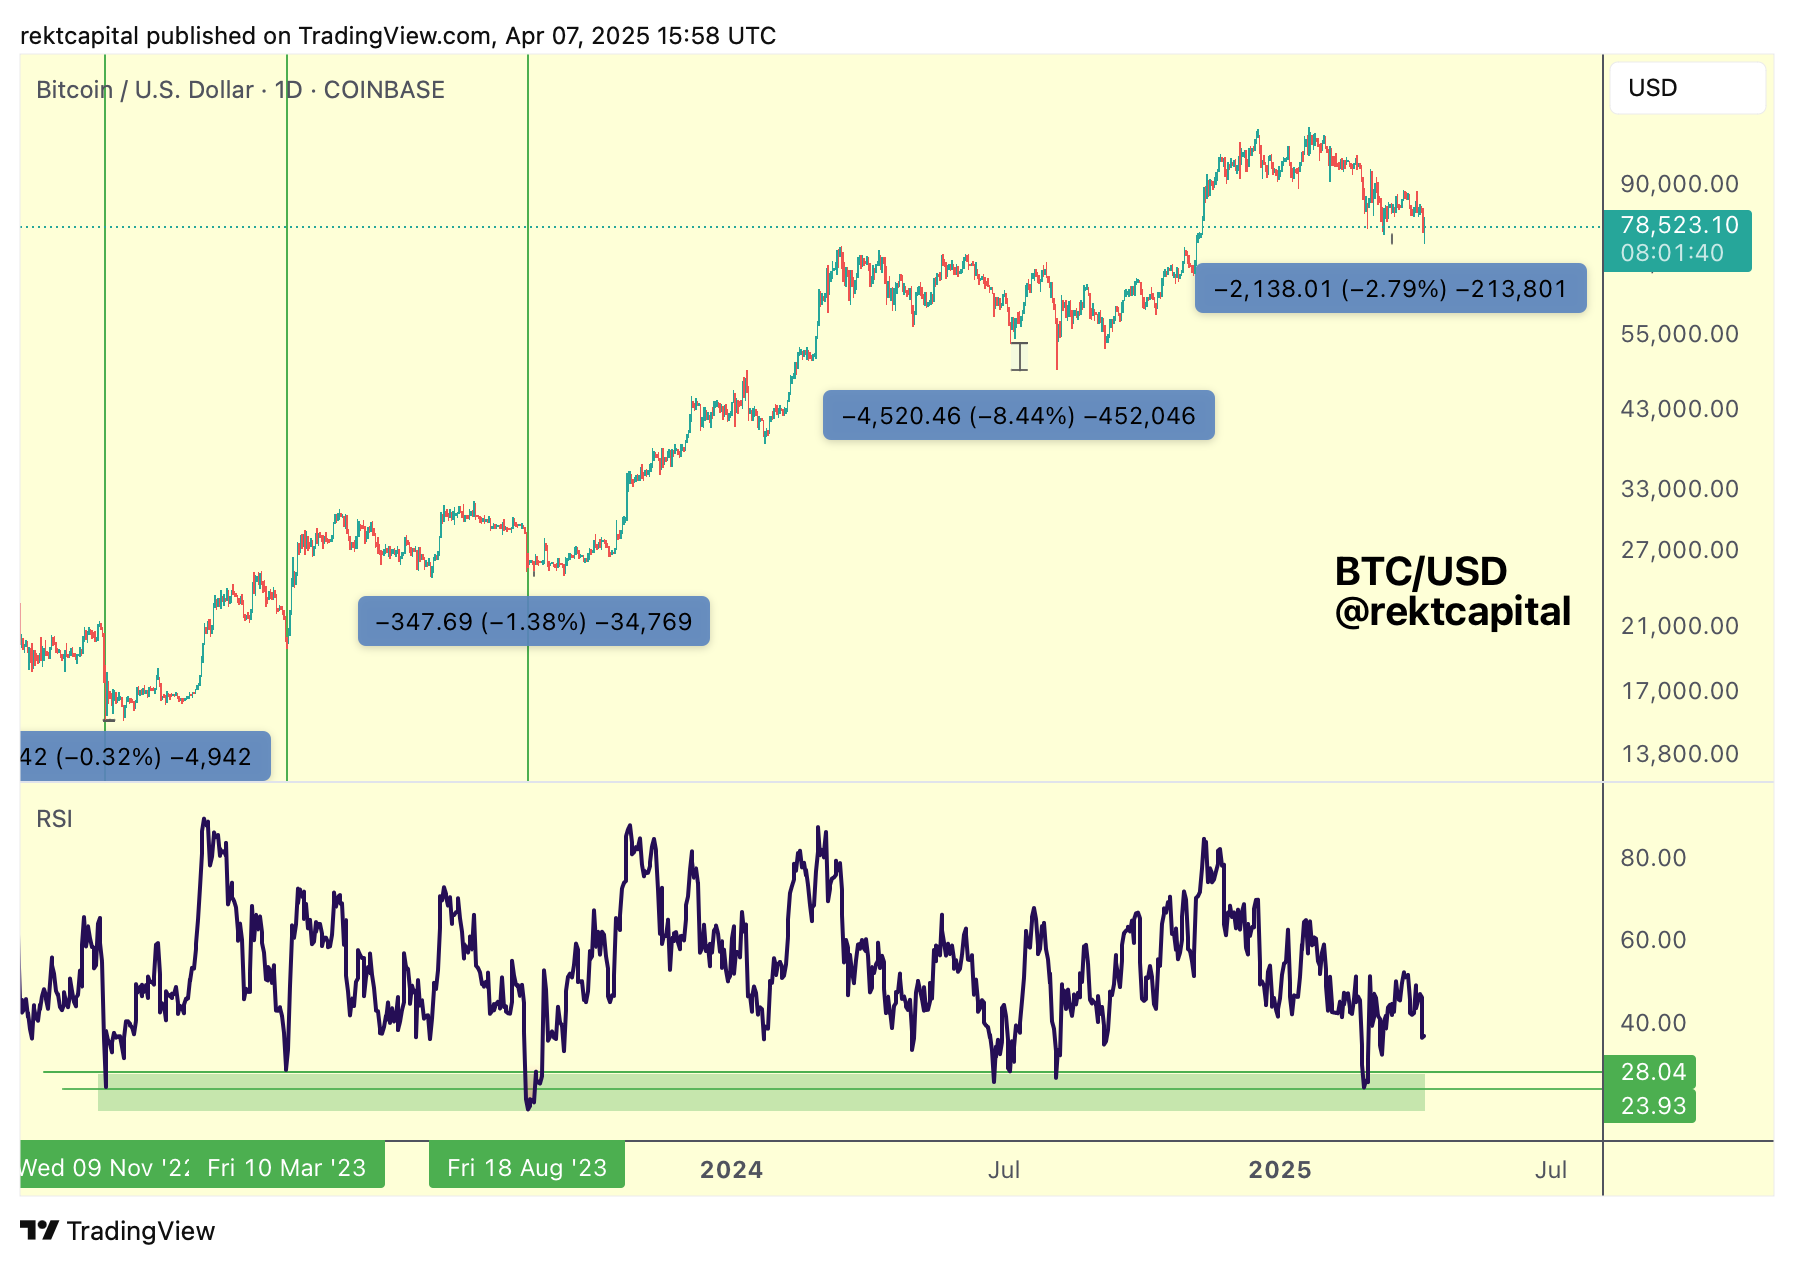
Specifically, throughout this cycle, Bitcoin has a tendency of developing Bullish Divergences via Higher Lows on the RSI and Lowers Lows in the price action as part of generational bottoms:

The first Price Low forms when the first RSI Low forms.
But the second Price Low tends to be lower than the first Price Low when the second RSI Low forms.
In other words, the RSI forms a Higher Low while price forms a Lower Low; the distance between the two Price Lows tend to be between -0.32% to -8.44% wide.
Right now the price distance is -2.79%:
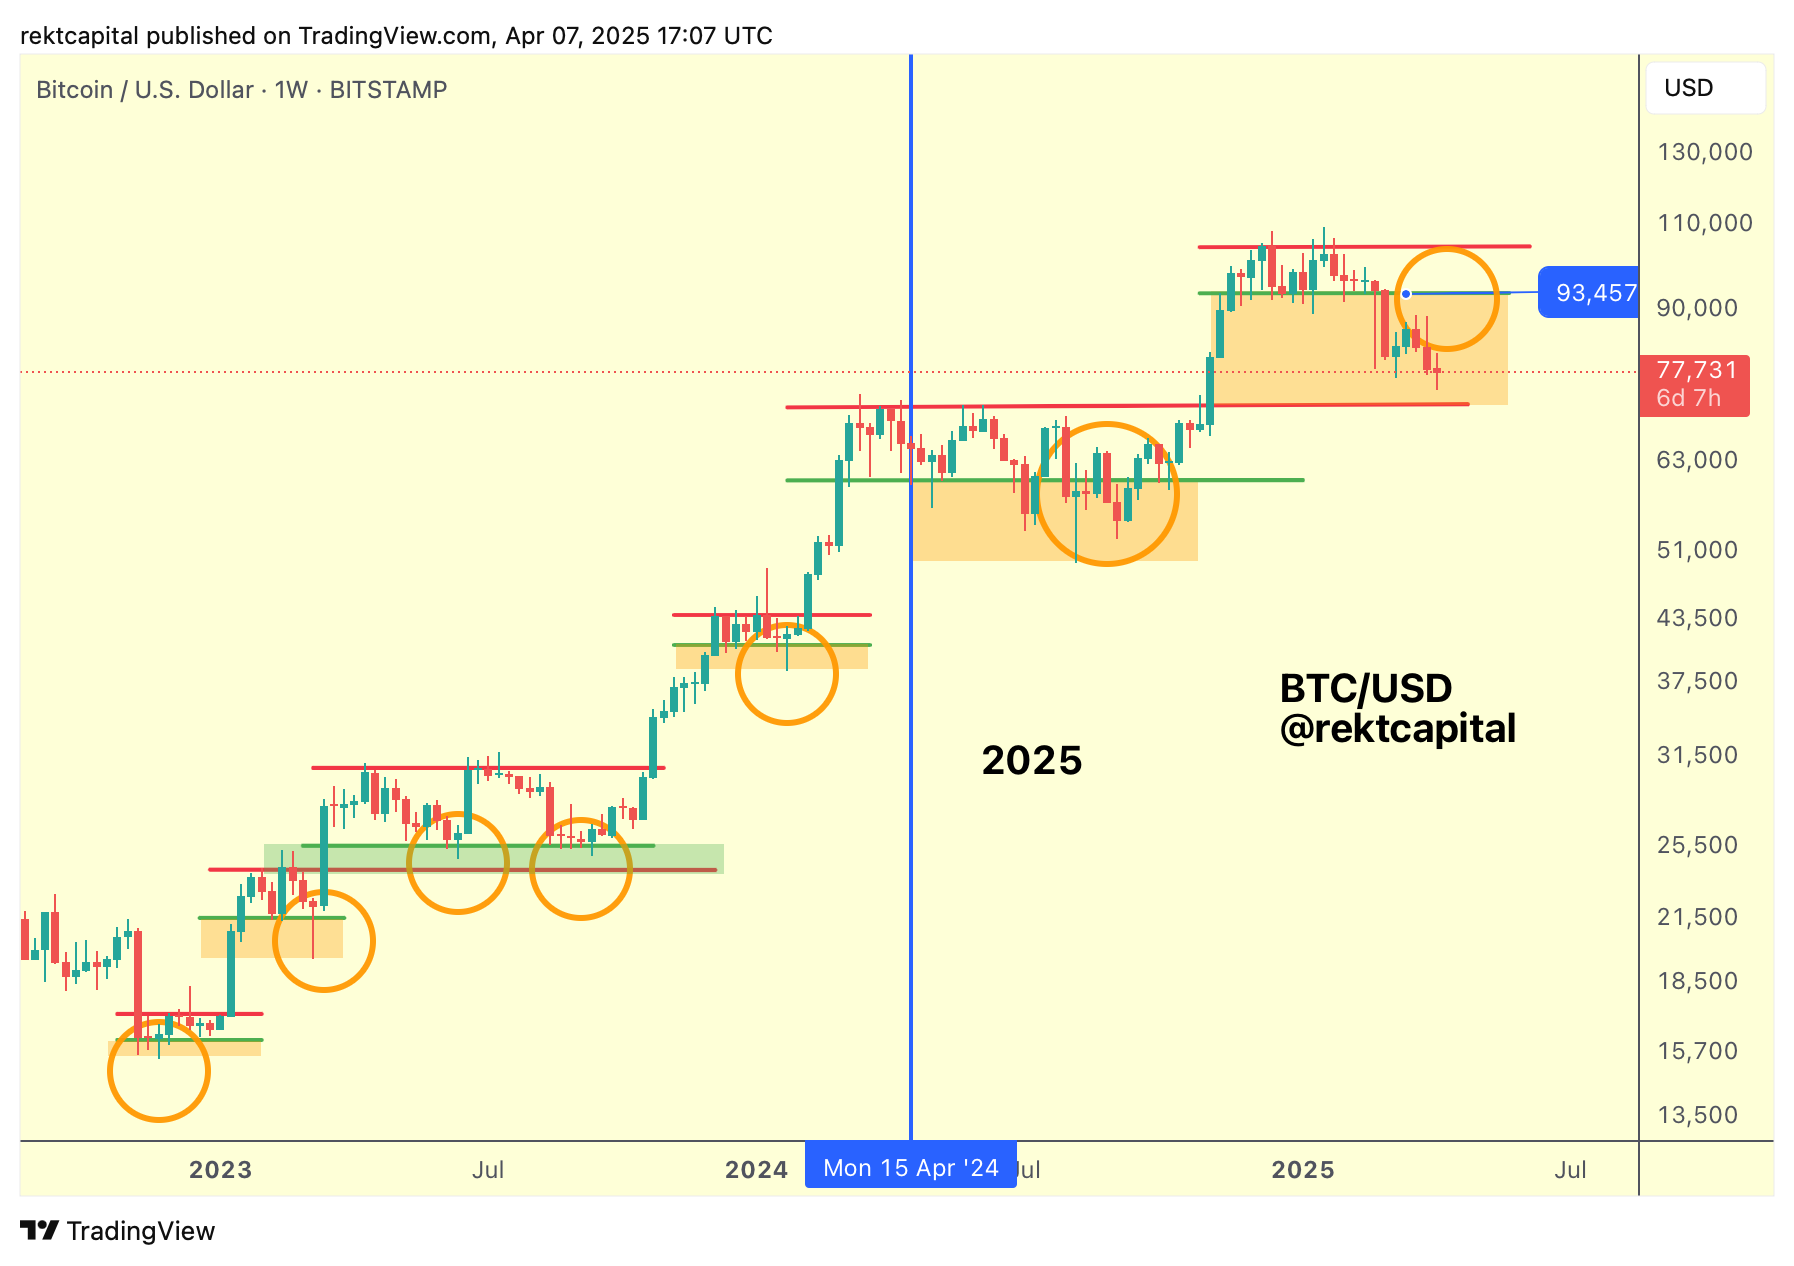
But if this price distance in the price lows were to turn into an -8.44% distance like in mid-2024, then price would drop into ~$70000 which are the Pre-Halving highs:
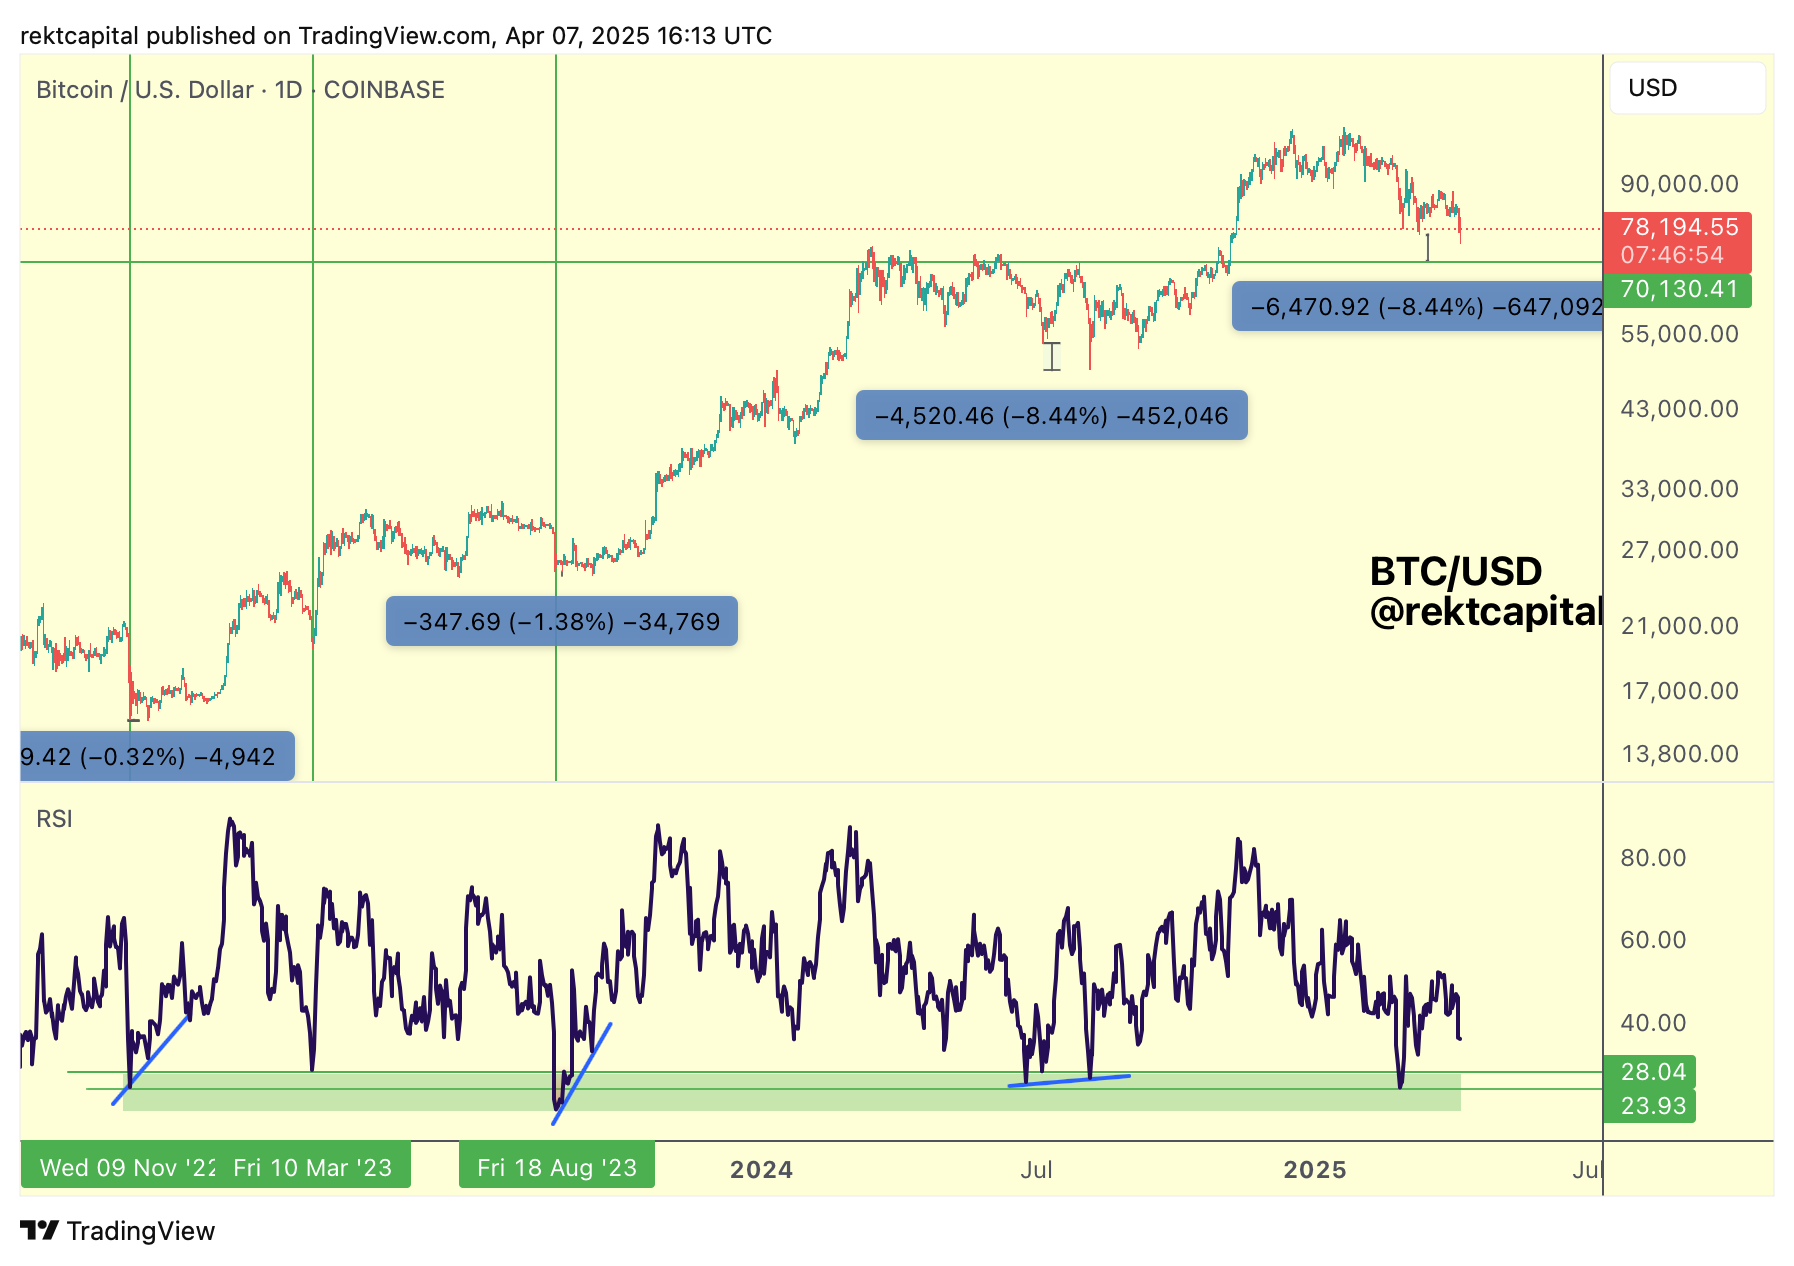
More, this level represents the Post-Halving ReAccumulation Range High:
However this won't be the first time in this cycle that Bitcoin will get close to the Range High of the previous ReAccumulation Range.
In mid-2023, the downside wicking deviations below the range got quite close to the previous ReAccumulation Range of early 2023, for example (green box):
Consolidation Fuelled By CME Gaps
Last week we spoke about how Bitcoin was forming a sideways range fulled by CME Gaps:
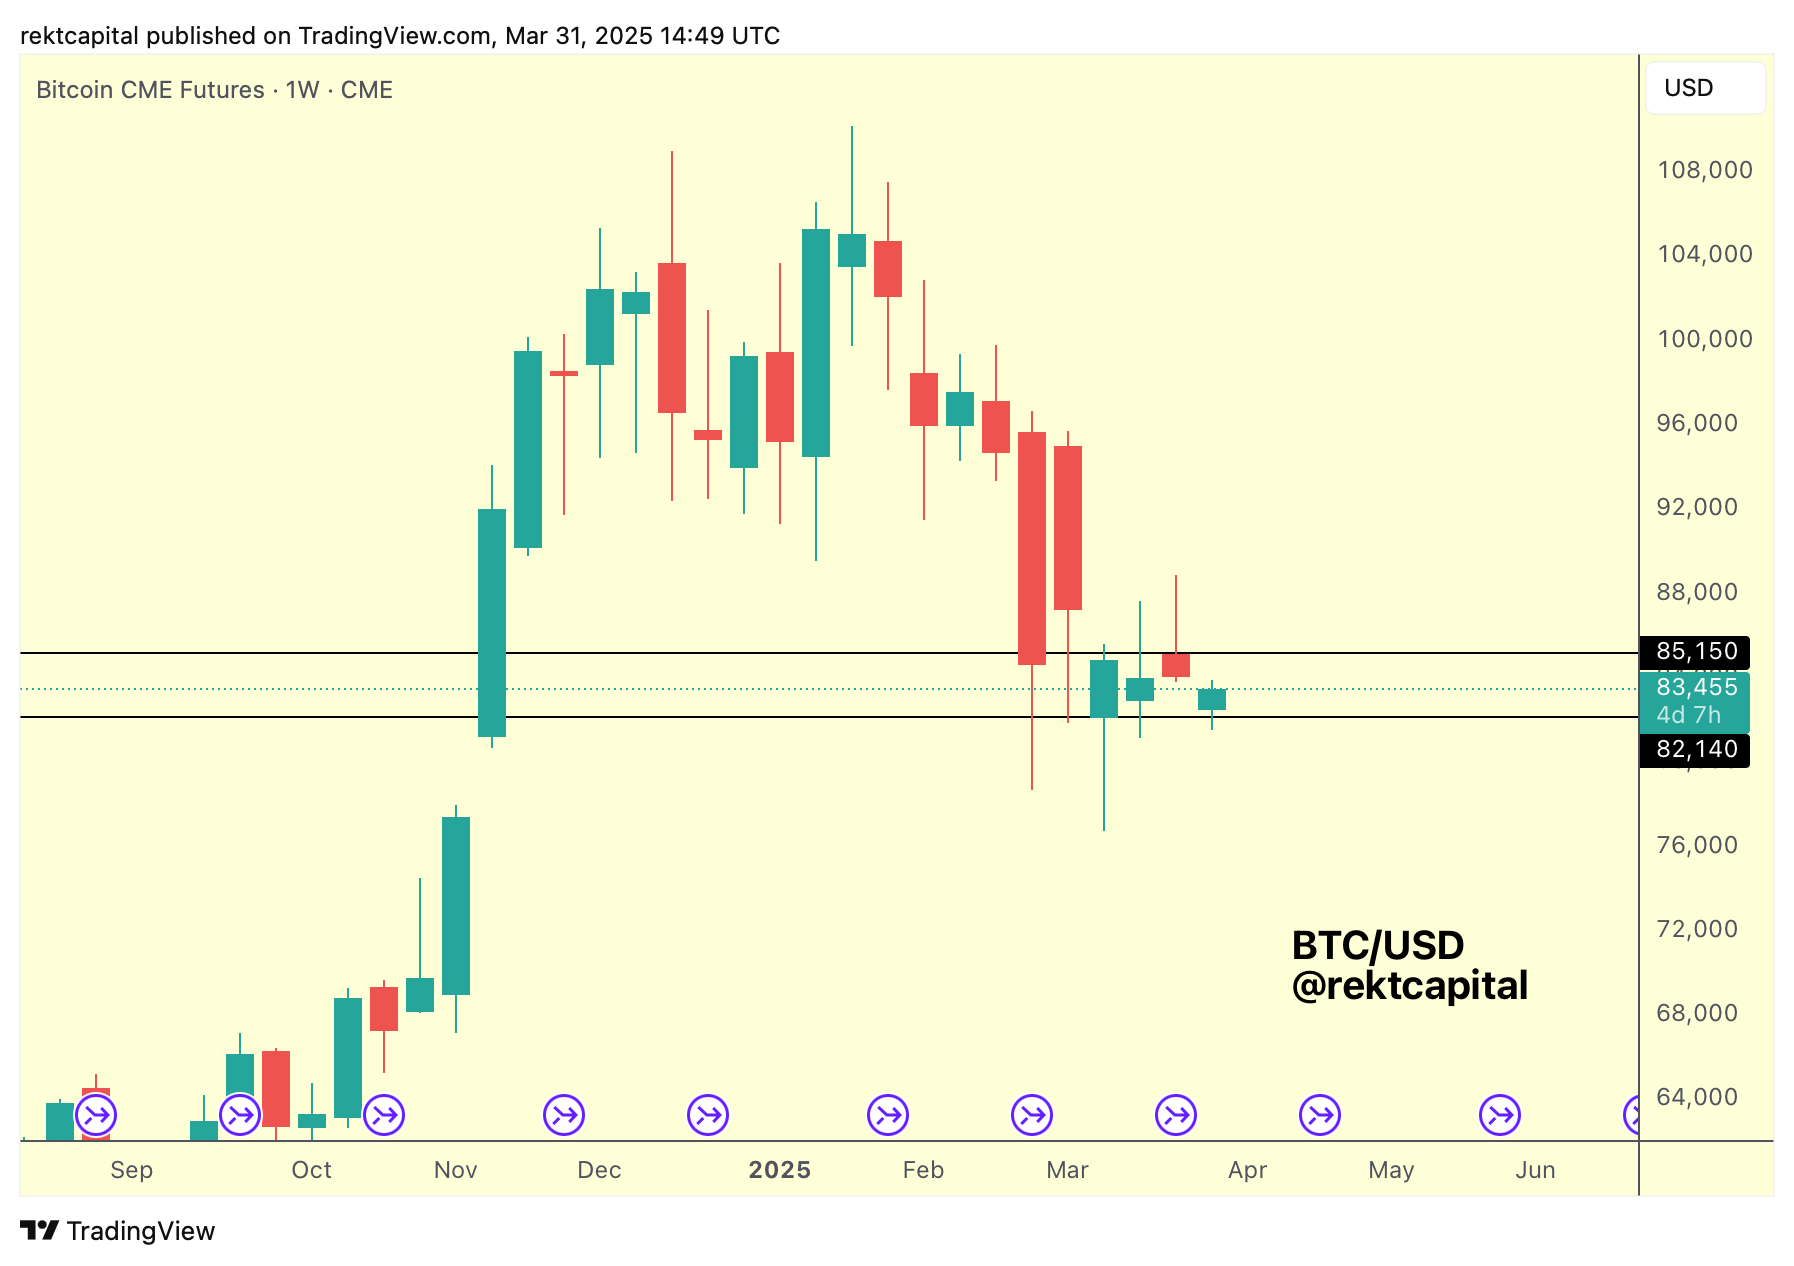
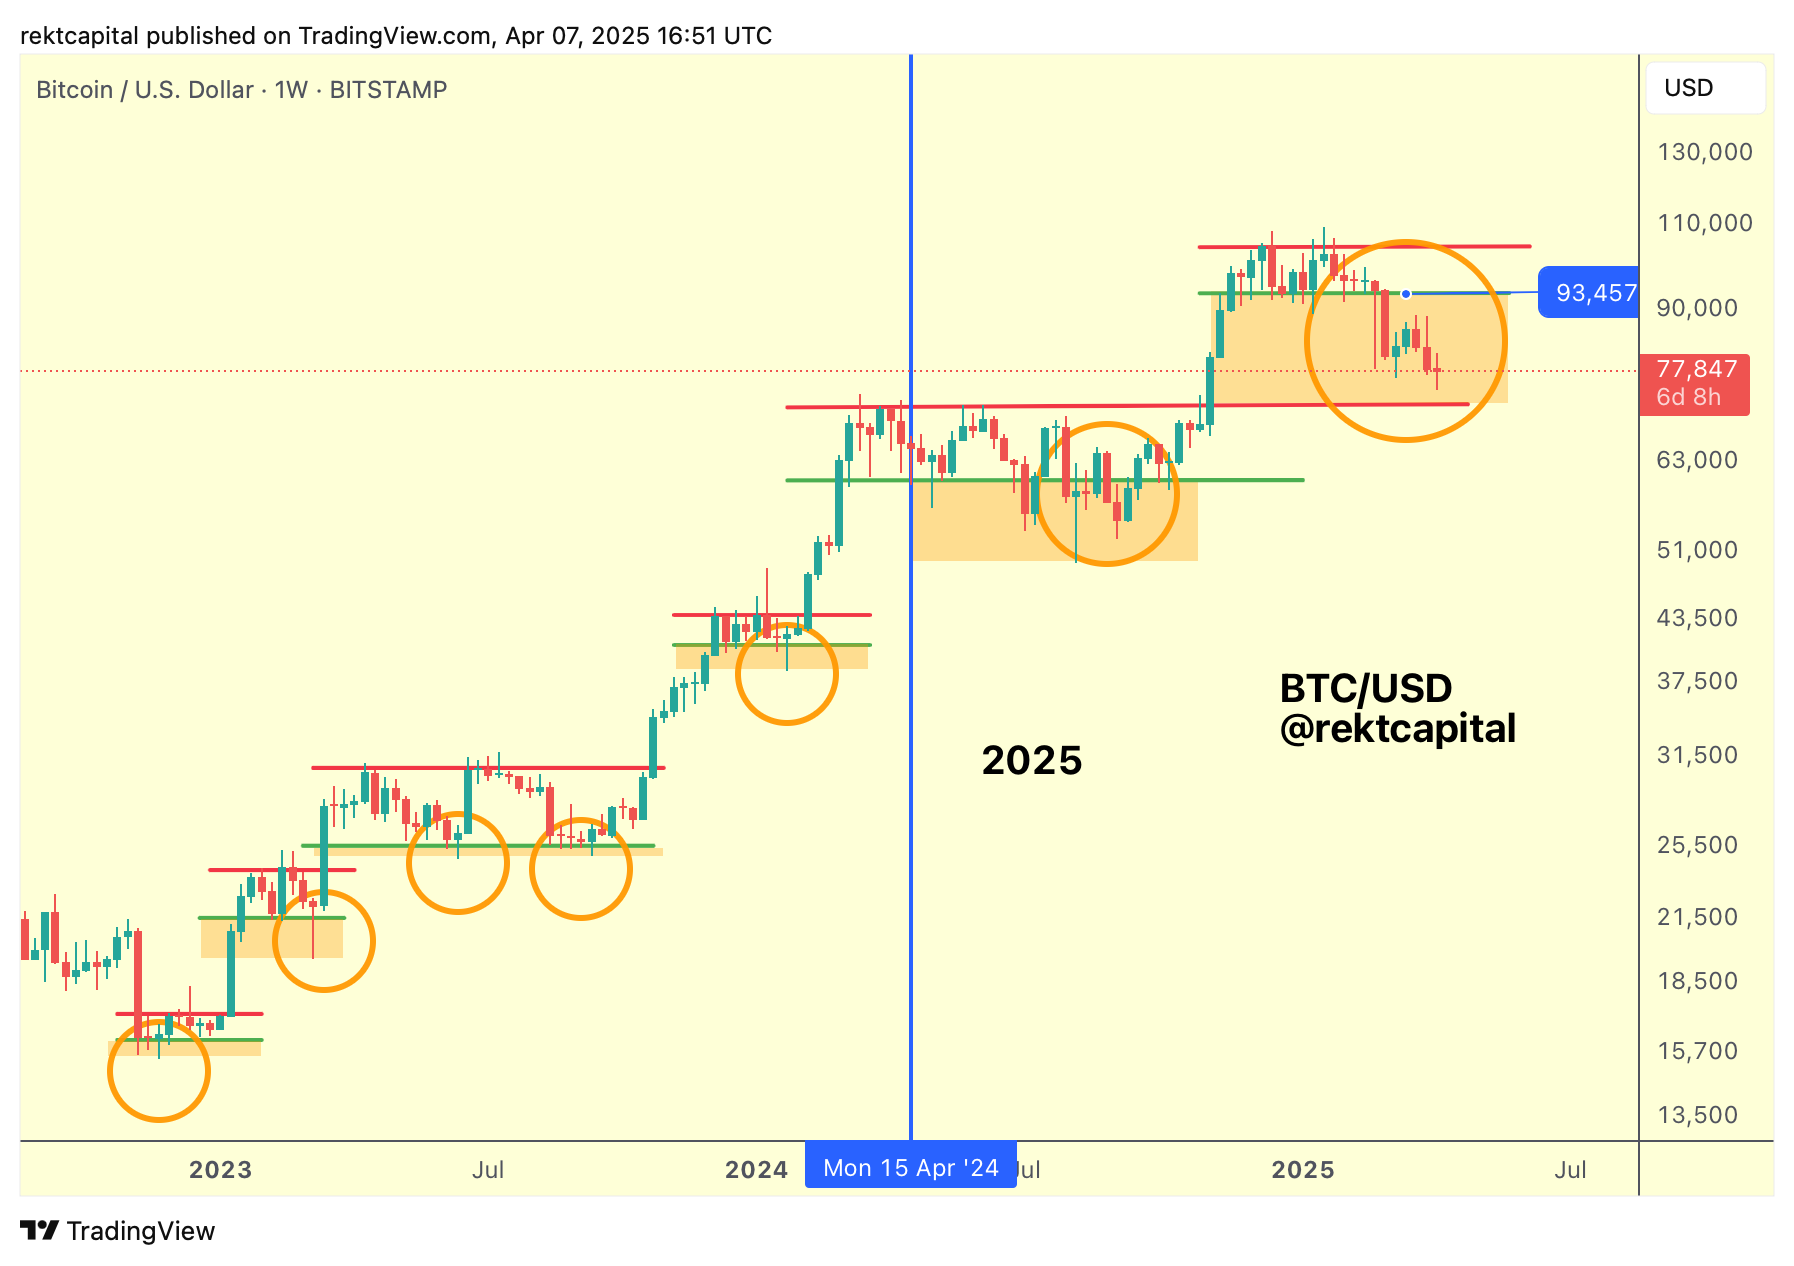
But this week, Bitcoin has actually broken down from this range, to form a brand new Weekly CME Gap in the process:
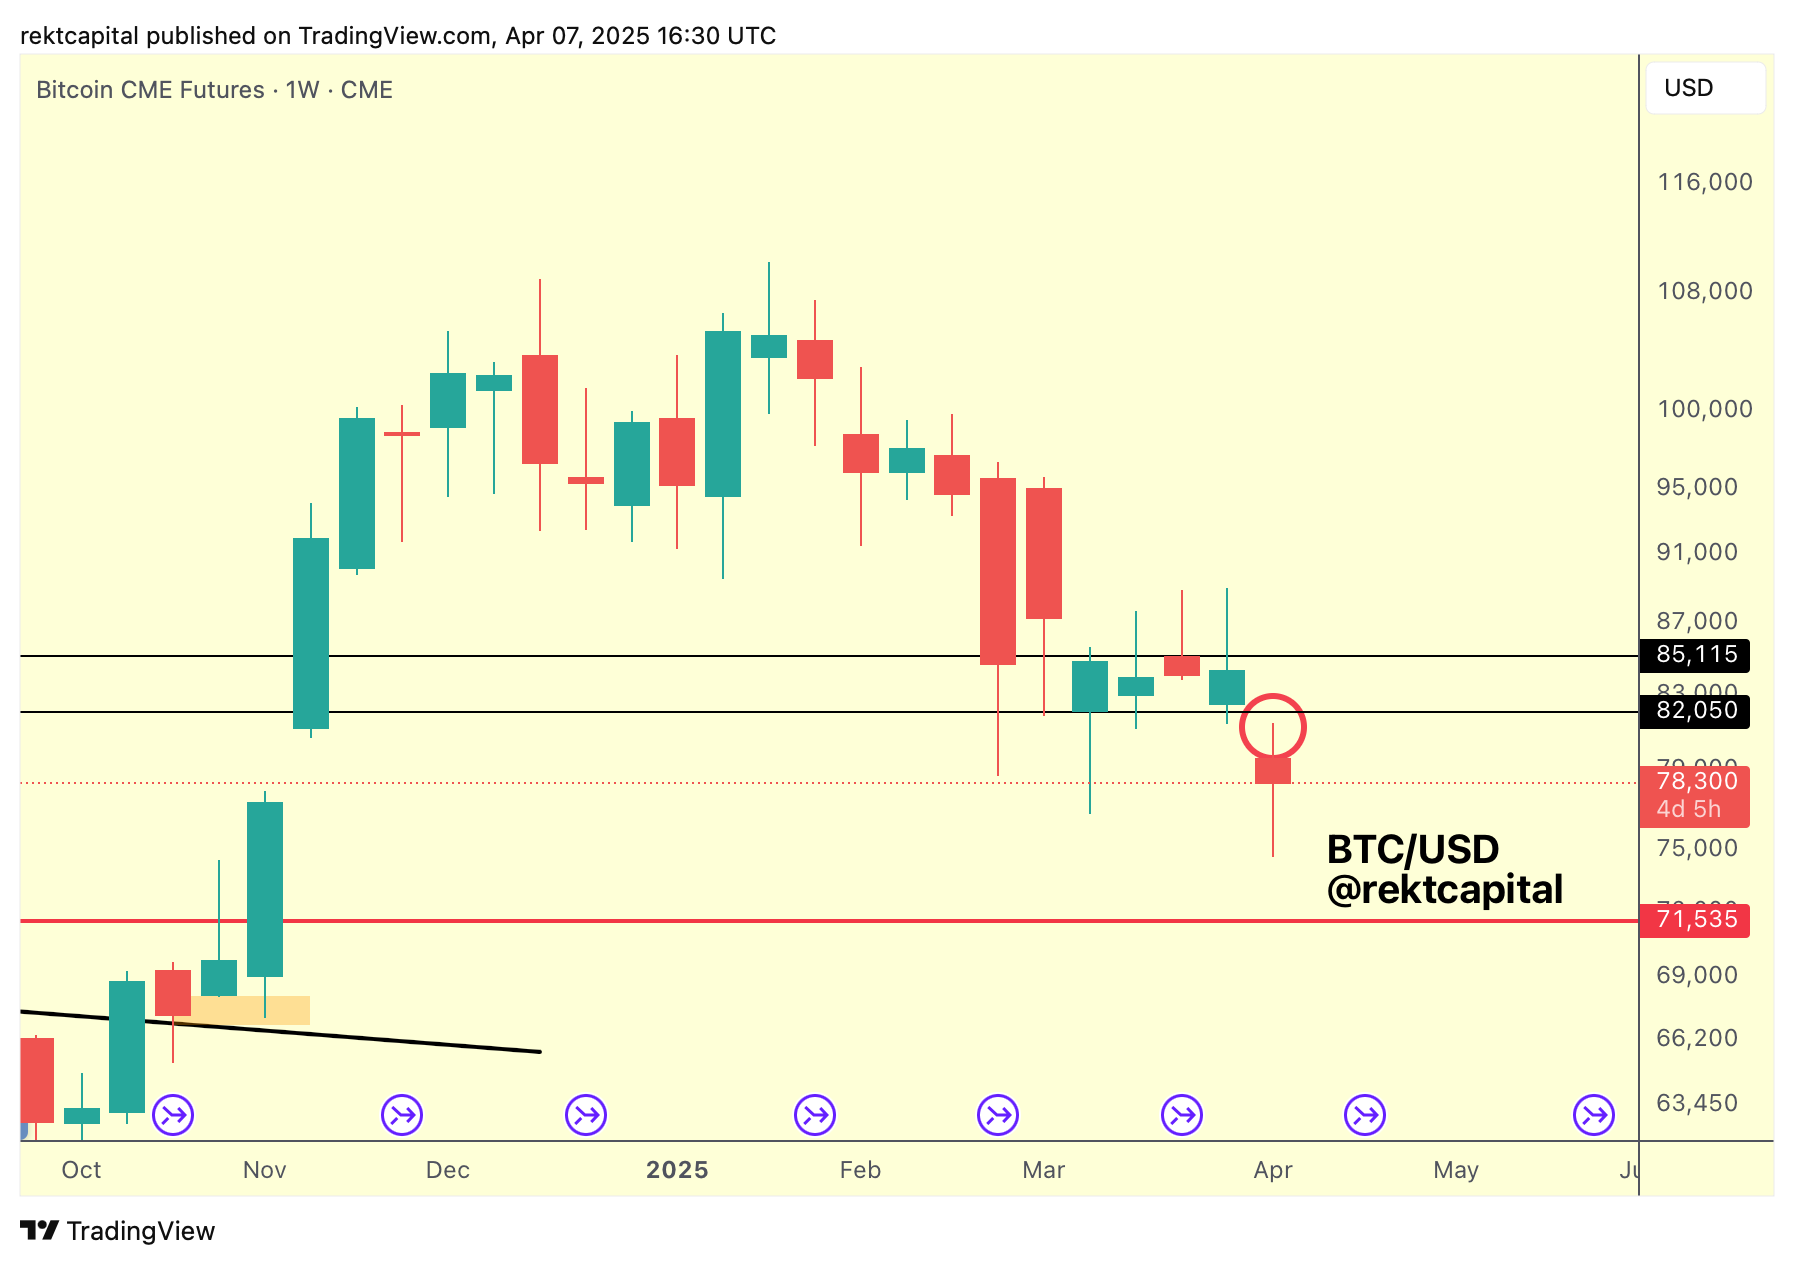
In fact, this brand new CME Gap (red circle) is being treated by price as a new resistance.
This technically makes sense - after all, CME Gaps can act as dynamic supports or resistances.
And since Bitcoin has lost the range, price is showcasing signs of turning that old support into new resistance; BTC has promptly filled this recently formed CME Gap and is rejecting from there.
Let's simplify this to its core:
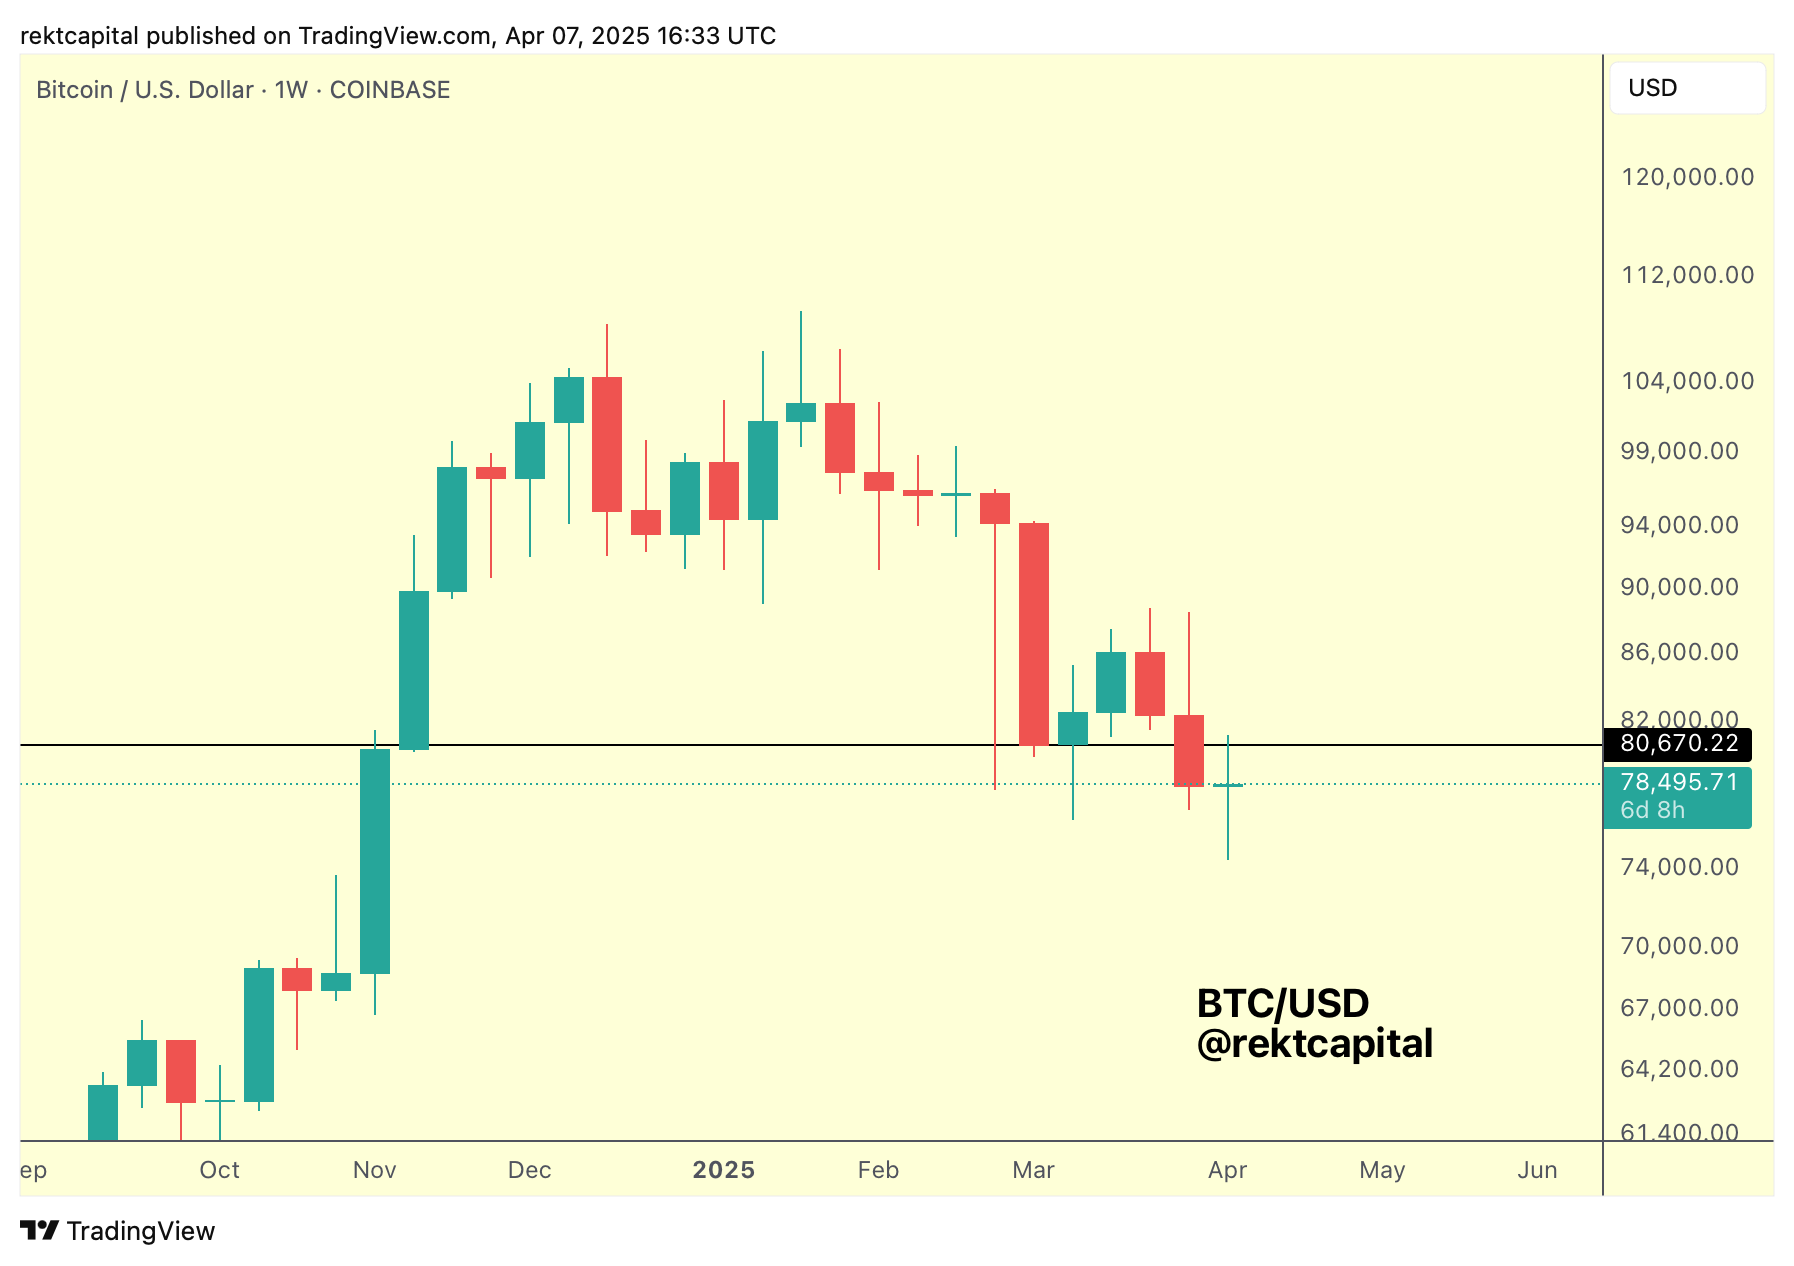
Bitcoin has Weekly Closed below the early March lows of $80670 (black) and as a result, price has lost that level as support.
And price has actually upside wicked into the underside of this same level, treating it as support (this upside wick partially filled the newly formed CME Gap).
Bitcoin needs to reclaim this $80670 level as support if price wants to position itself for a challenge of the Weekly Downtrend that has been plaguing price for a number of months:
Turning this level into a confirmed resistance would send price into additional downside continuation.
There are very few supports between current prices and ~$70000 (green, pre-Halving highs) and so that means there is a market inefficiency here that is waiting to be filled upon confirmed breakdown.