Bitcoin - Weekly Double Bottom But Macro Lower High
How to think about this current recovery for Bitcoin, macro-wise
Welcome to the Rekt Capital Newsletter, a resource for investors who want to better navigate the crypto markets with the help of cutting-edge crypto research and unbiased market analysis.
Bitcoin's Two Old All Time Highs
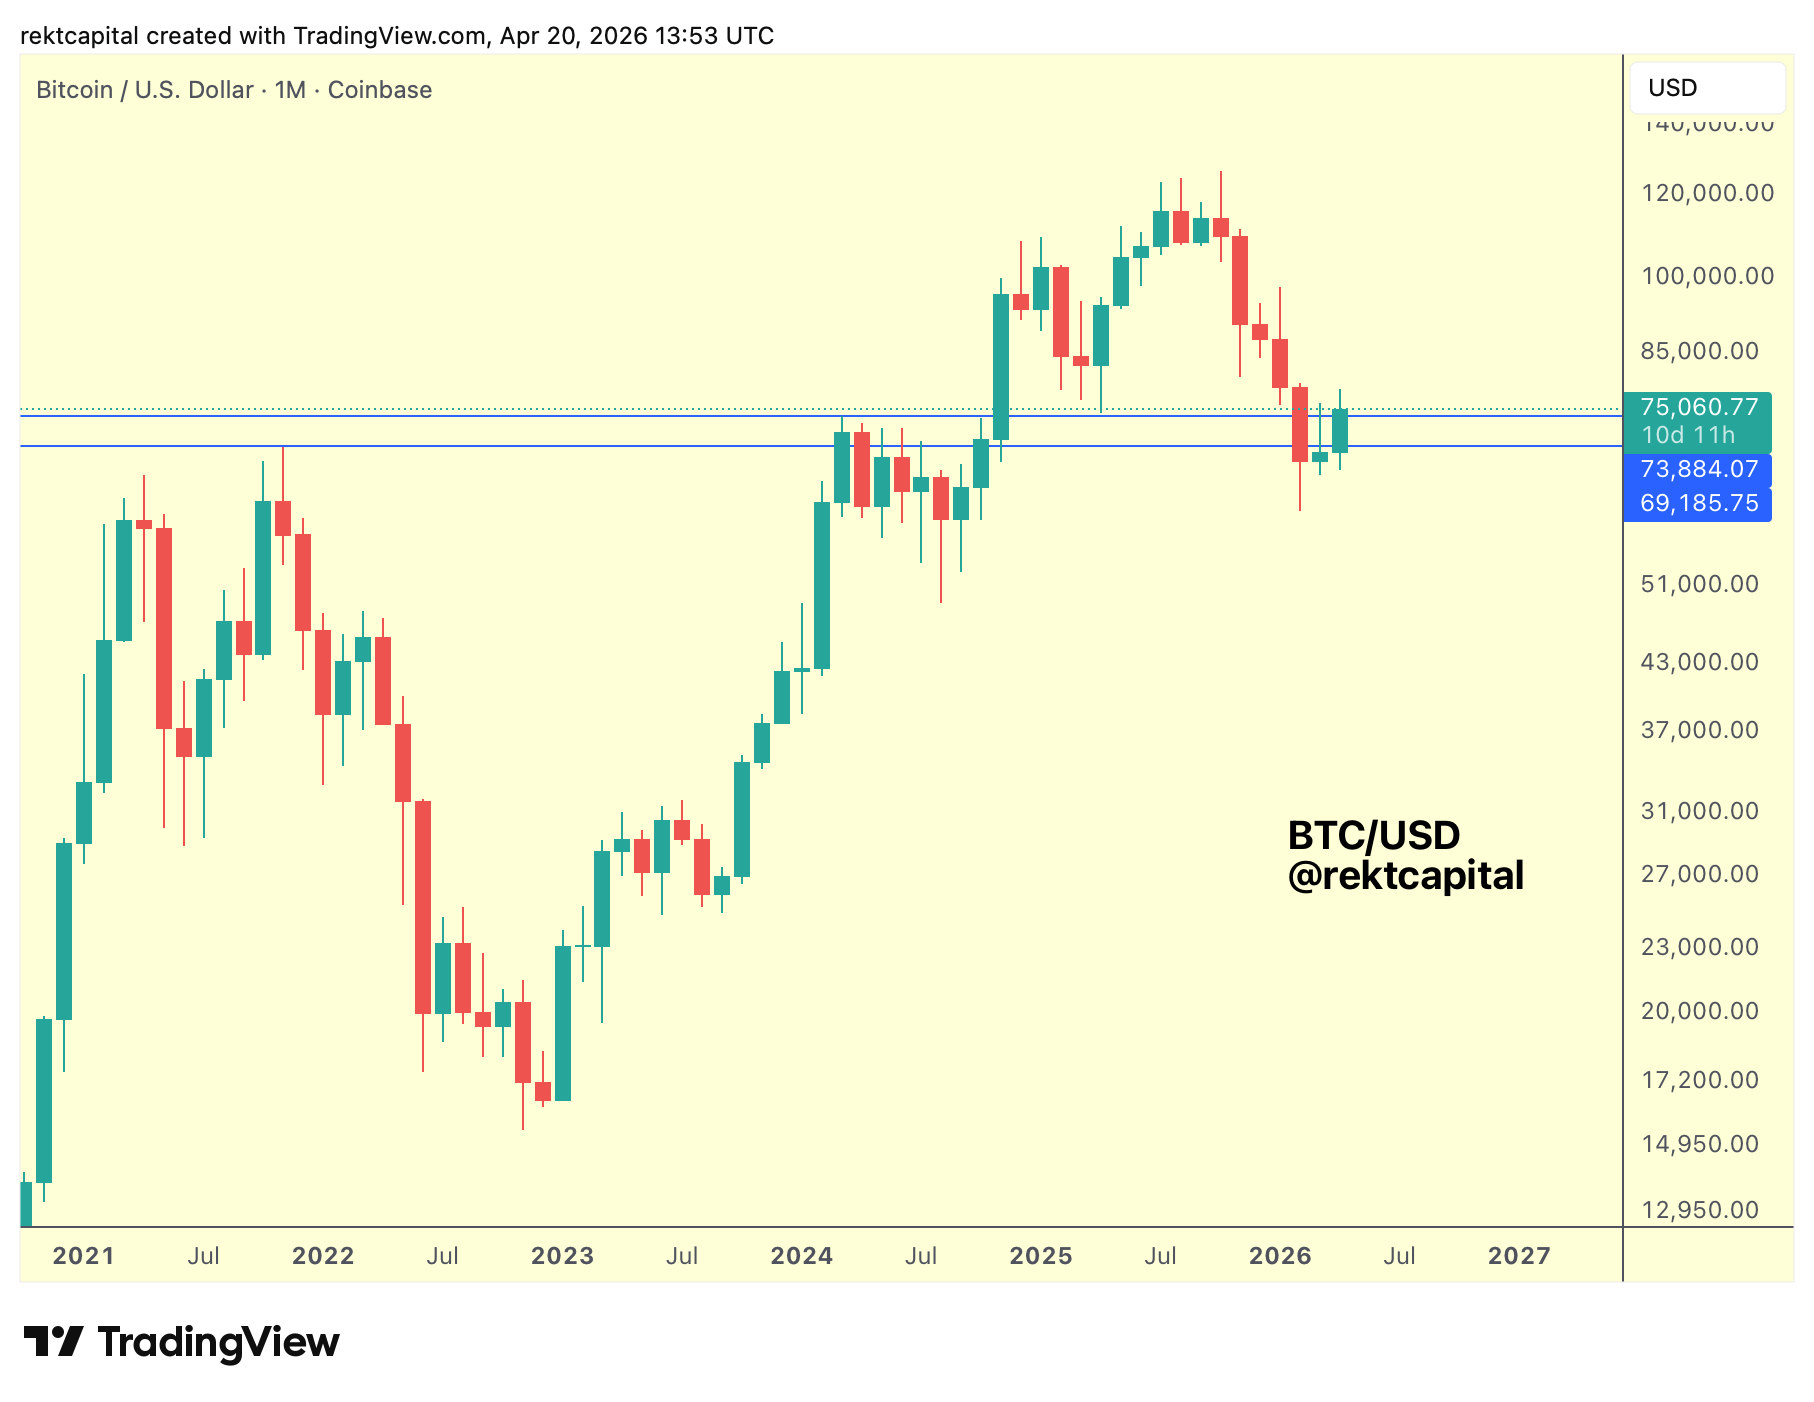
The 2021 old All Time High at $69,185 (blue horizontal) and the 2024 old All Time High at $73,884 (dotted blue horizontal) form a key liquidity cluster for Bitcoin's price action.
Two months ago, both levels were lost as support.
Last month, price was rejecting from both as potential new forms of resistance. This month, however, the reaction has been noticeably different.
No real sellers piling on. No sell-side pressure strong enough to drive price into further downside continuation.
After a multi, multi-month stretch of relentless red candles with very little respite in between, that lackluster response from sellers is meaningful.
Seller exhaustion is always going to become a factor eventually.
We are currently seeing a period of relief and that is understandable after the sustained sell-side pressure of recent months.
We simply cannot go into much deeper levels without some form of respite in between, and we are seeing that now.
But this is Macro relief, not a reversal.
We are just over midway through the Bear Market, with at least six months still ahead. Arguments can be made for a 380, 390, even 400-day bear cycle, that will be fine-tuned later in the cycle.
For now, a Macro Lower High remains the probable outcome from here, with newer lows to follow over time.
Weekly Double Bottom Confirmation?
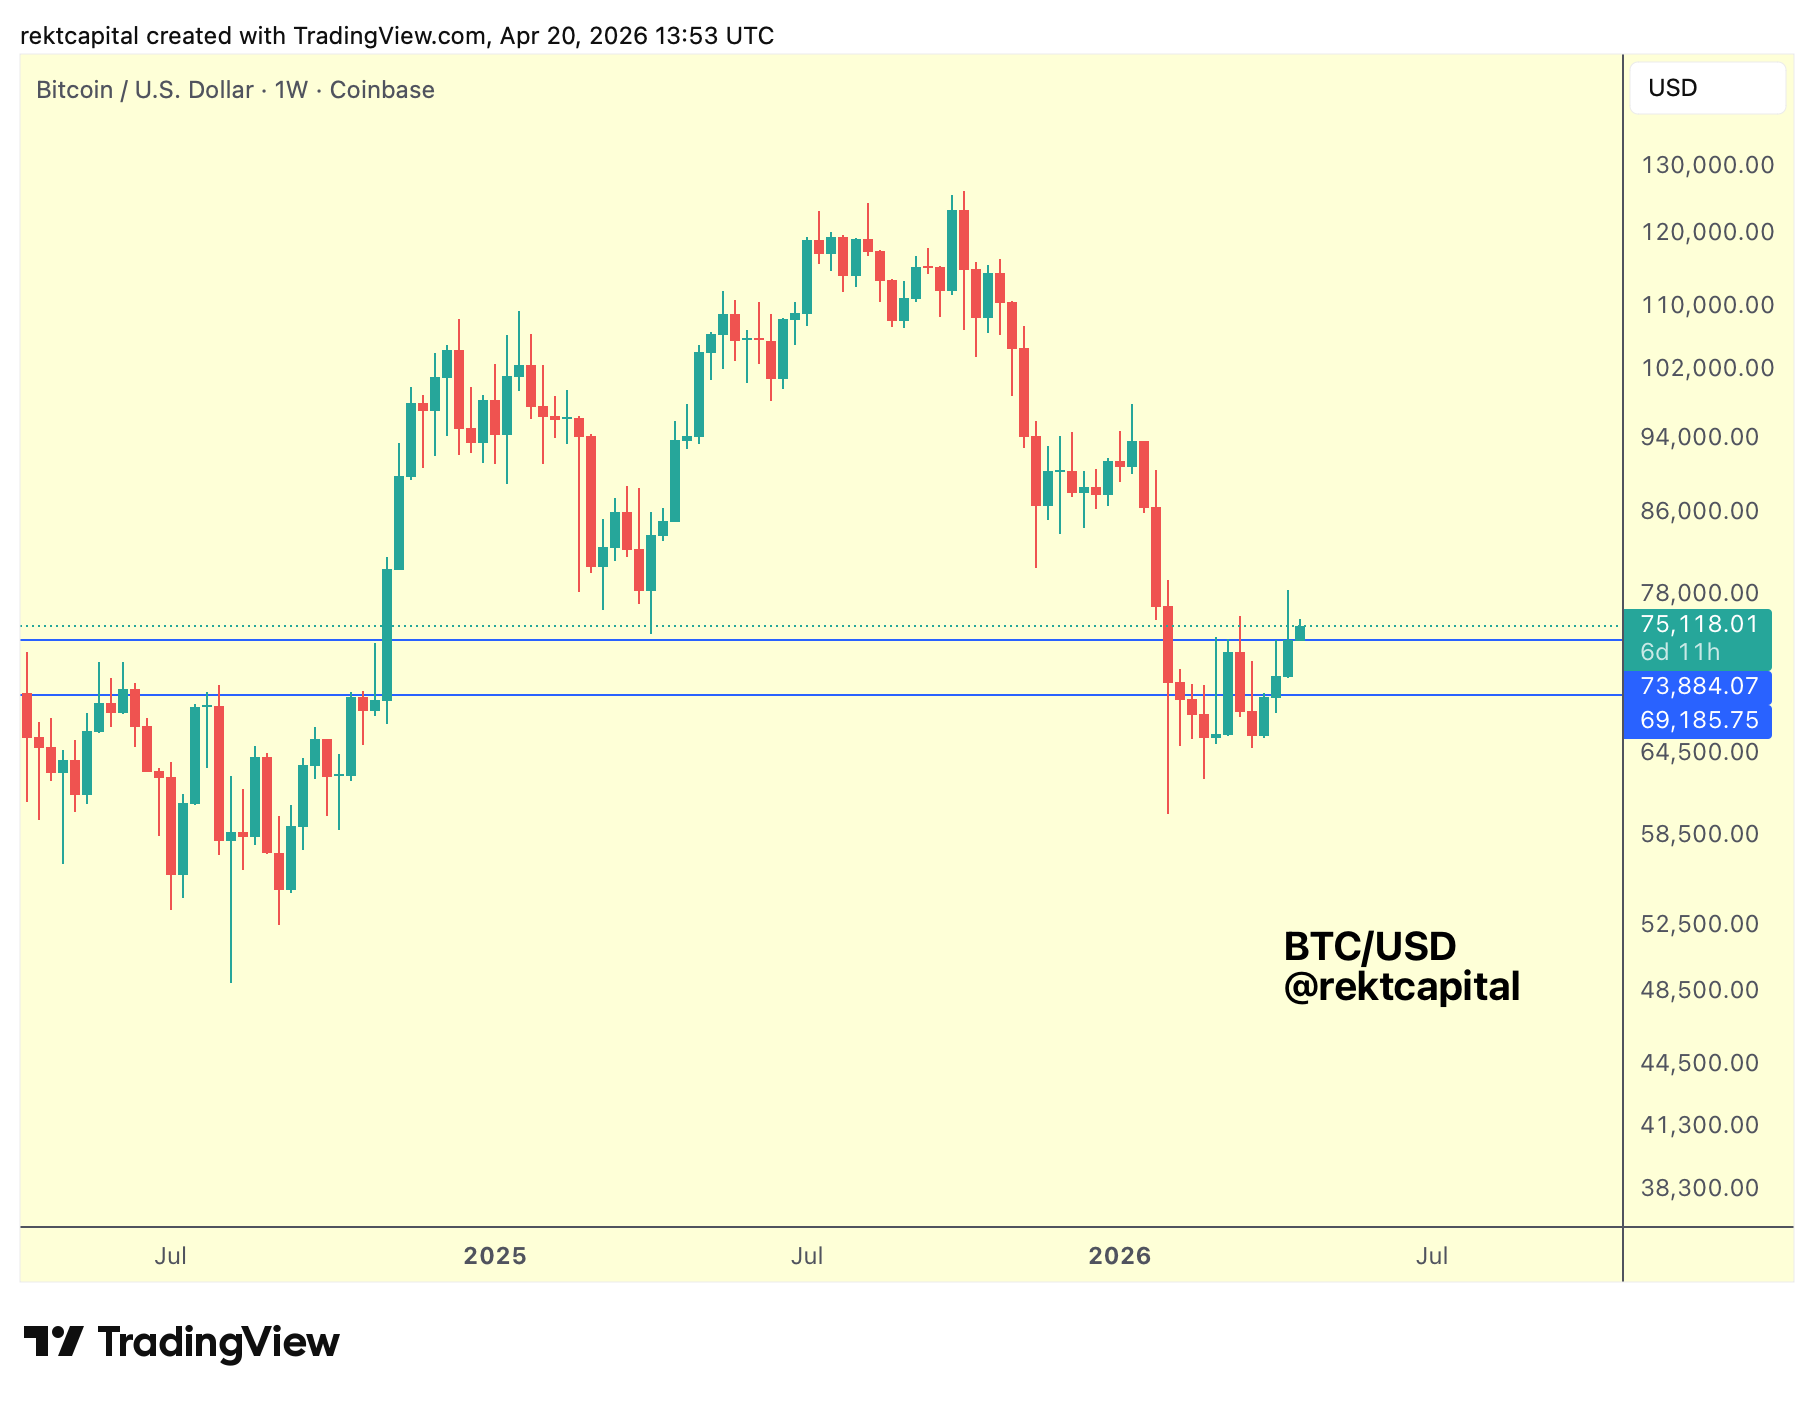
Zooming into the Weekly timeframe, those same two levels remain the focal point.
The 2021 old All Time High at $69,185 has been turned into new Weekly support. That is promising.
The 2024 old All Time High at $73,884, however, is a different story.
Last week's Weekly Close came in below it, meaning it technically remains a ceiling. This week, price is attempting to hold above it but that attempt is still unconfirmed.
What is worth noting is how the rejections from $73,884 have evolved.
A few weeks back, the level produced a meaningful pullback. Two weeks back, that pullback was markedly shallower.
There is a reason to argue that this supply barrier is weakening over time.
The broader context here is level-by-level reclamation, mustering buy-side momentum before encountering a stronger ceiling.
We saw a similar sequence around $110,000 in the latter stages of the Bull Market: a fine base developing over multiple weeks, even a Higher Low, but ultimately lacking the momentum to propel price to new highs.
Resulting in yet another Macro Lower High. The same pattern played out around $86,000 in late 2025.
That strong ceiling, when it comes, could materialise in the low $80,000s - the $82,500 region specifically, the Macro base of the triangle discussed in prior issues.
A Double Bottom formation is currently developing on the Weekly.
Breakout confirmation is not yet complete, and even a confirmed breakout would only produce a one-to-one Measured Move into that $82,500 region at most.
In a Bear Market, the failure modes matter as much as the setups, fake breakouts, failed Post-Breakout Retests, a Measured Move that falls short. All are live possibilities here.
And then there is the Monthly Close to consider.
Will it land above both old All Time Highs? Just below $73,884 but above $69,185?
That second scenario would likely see price remain sandwiched within this cluster, limited upside, and potentially a precursor to Macro downside over time.