Bitcoin Two Weeks Away From New Highs?
The Bitcoin Price Discovery Transitional Phase
Welcome to the Rekt Capital Newsletter, a resource for investors who want to better navigate the crypto markets with the help of cutting-edge crypto research and unbiased market analysis
Bitcoin Rallies Across Its Range
Over the past few weeks, we've spoken about how BTC has essentially moved across its range, starting of with the first Range Low at ~$91000 (blue):
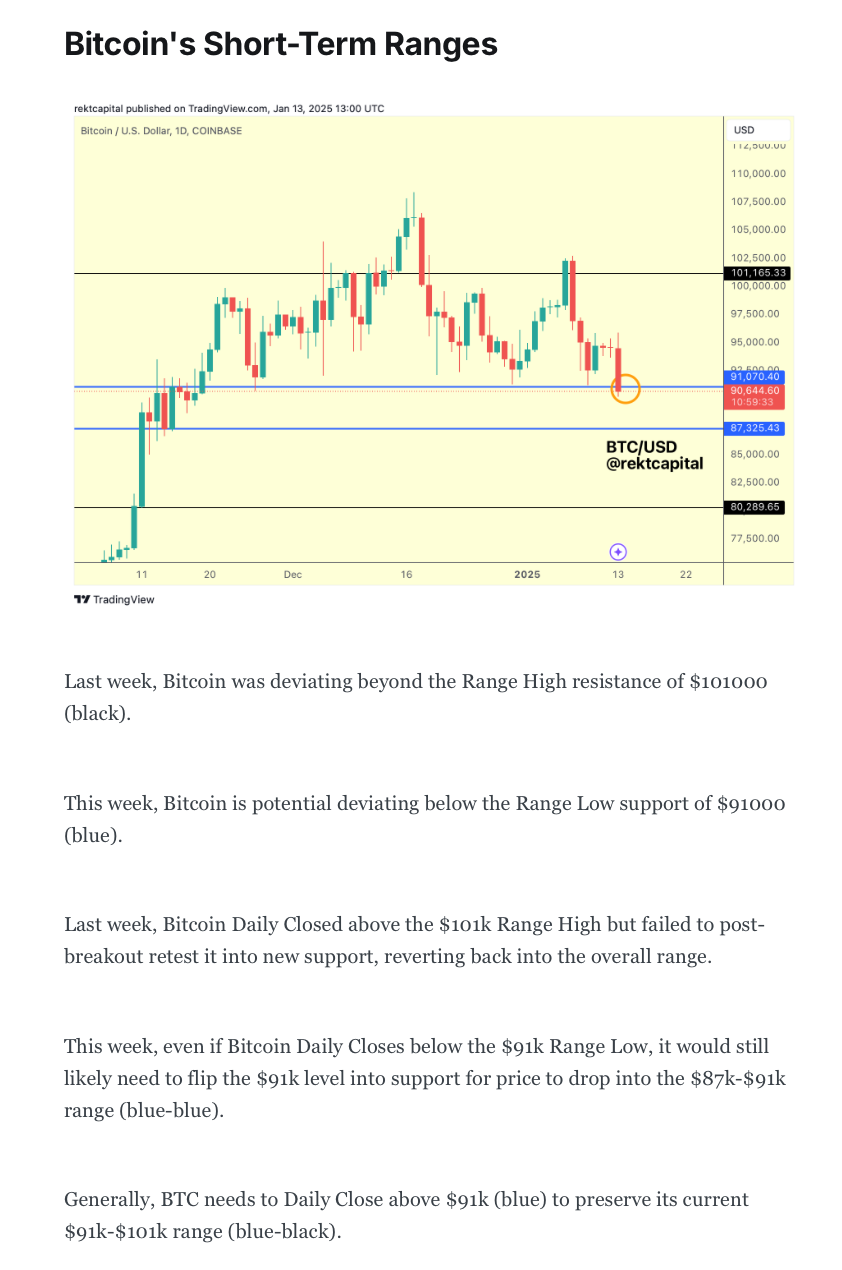
To rally above the Range High of $101k (black) to turn it into new support:
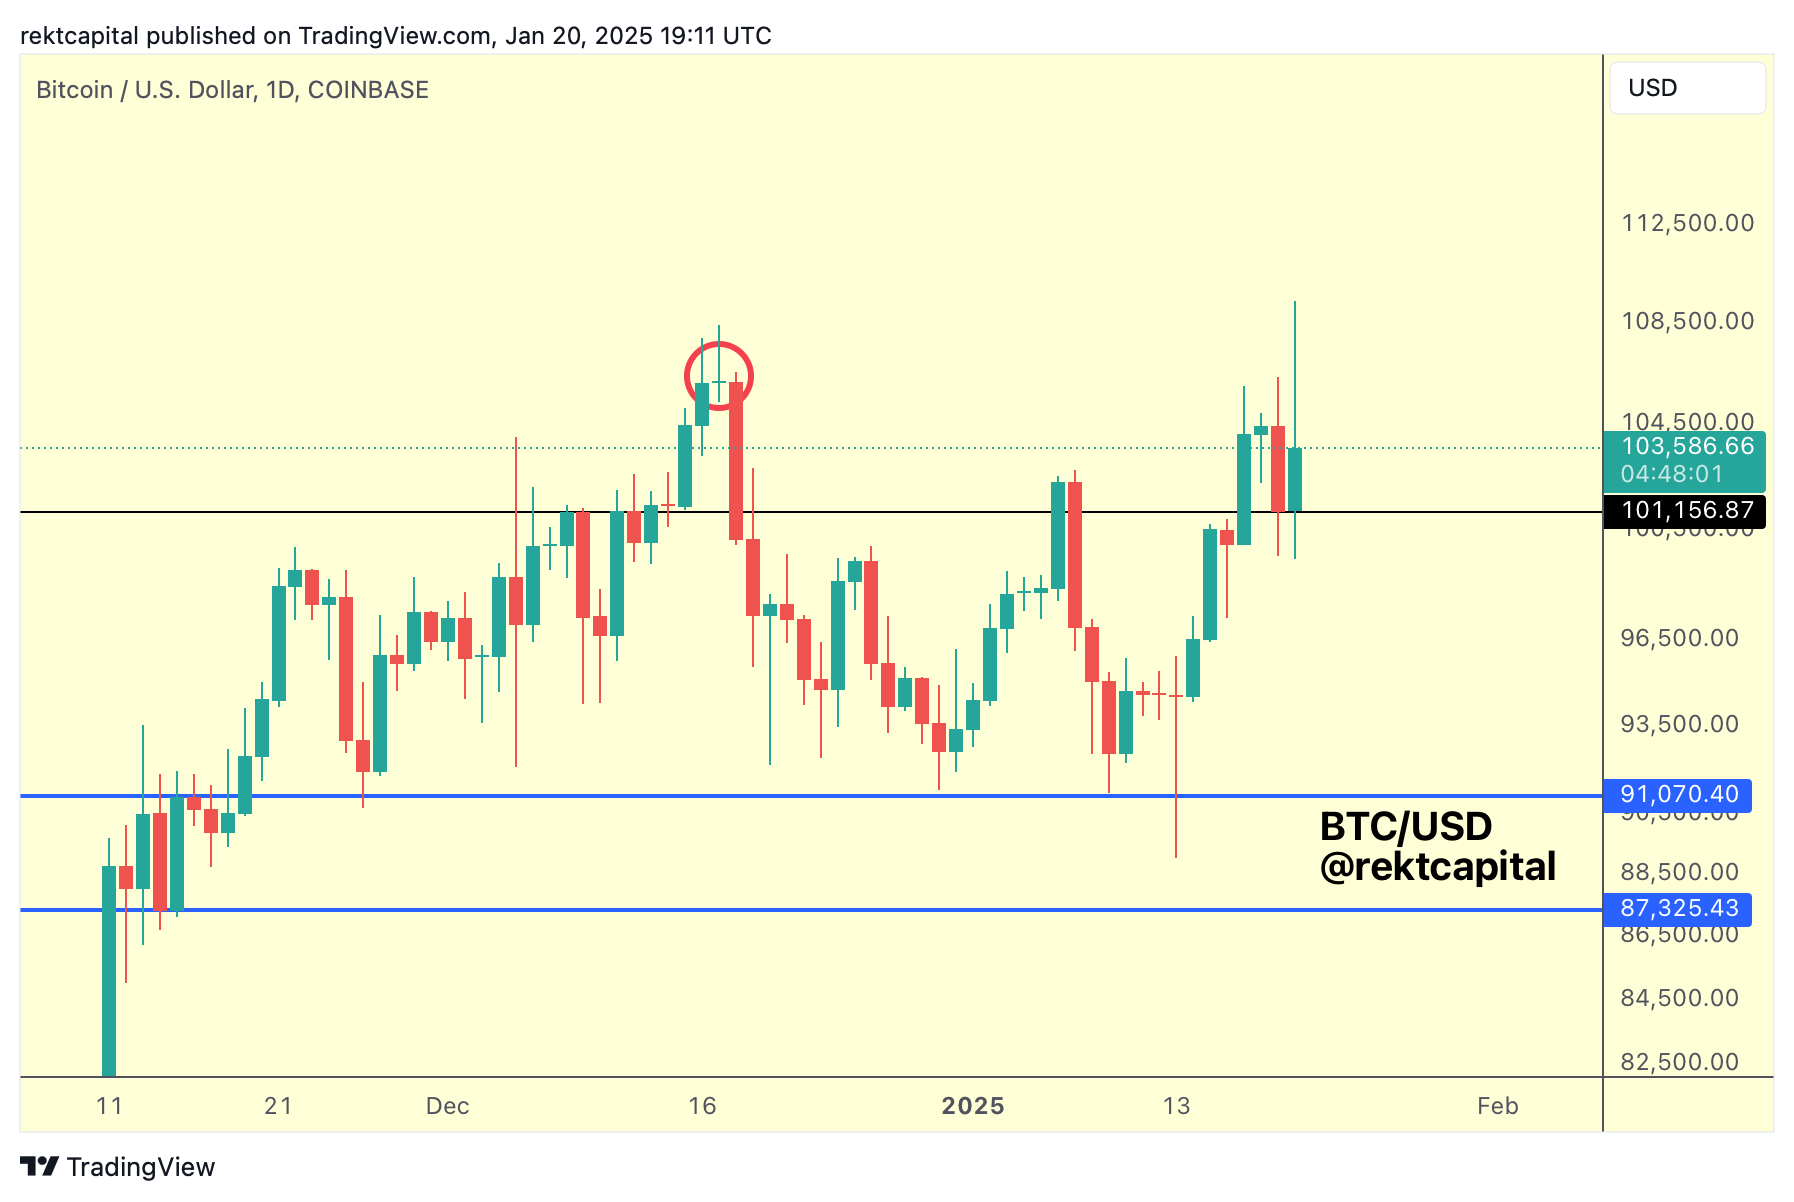
To form a new Range High at $106k (red):
While appreciating that the Range Low had become a confluent support with the multi-week downtrend (red):
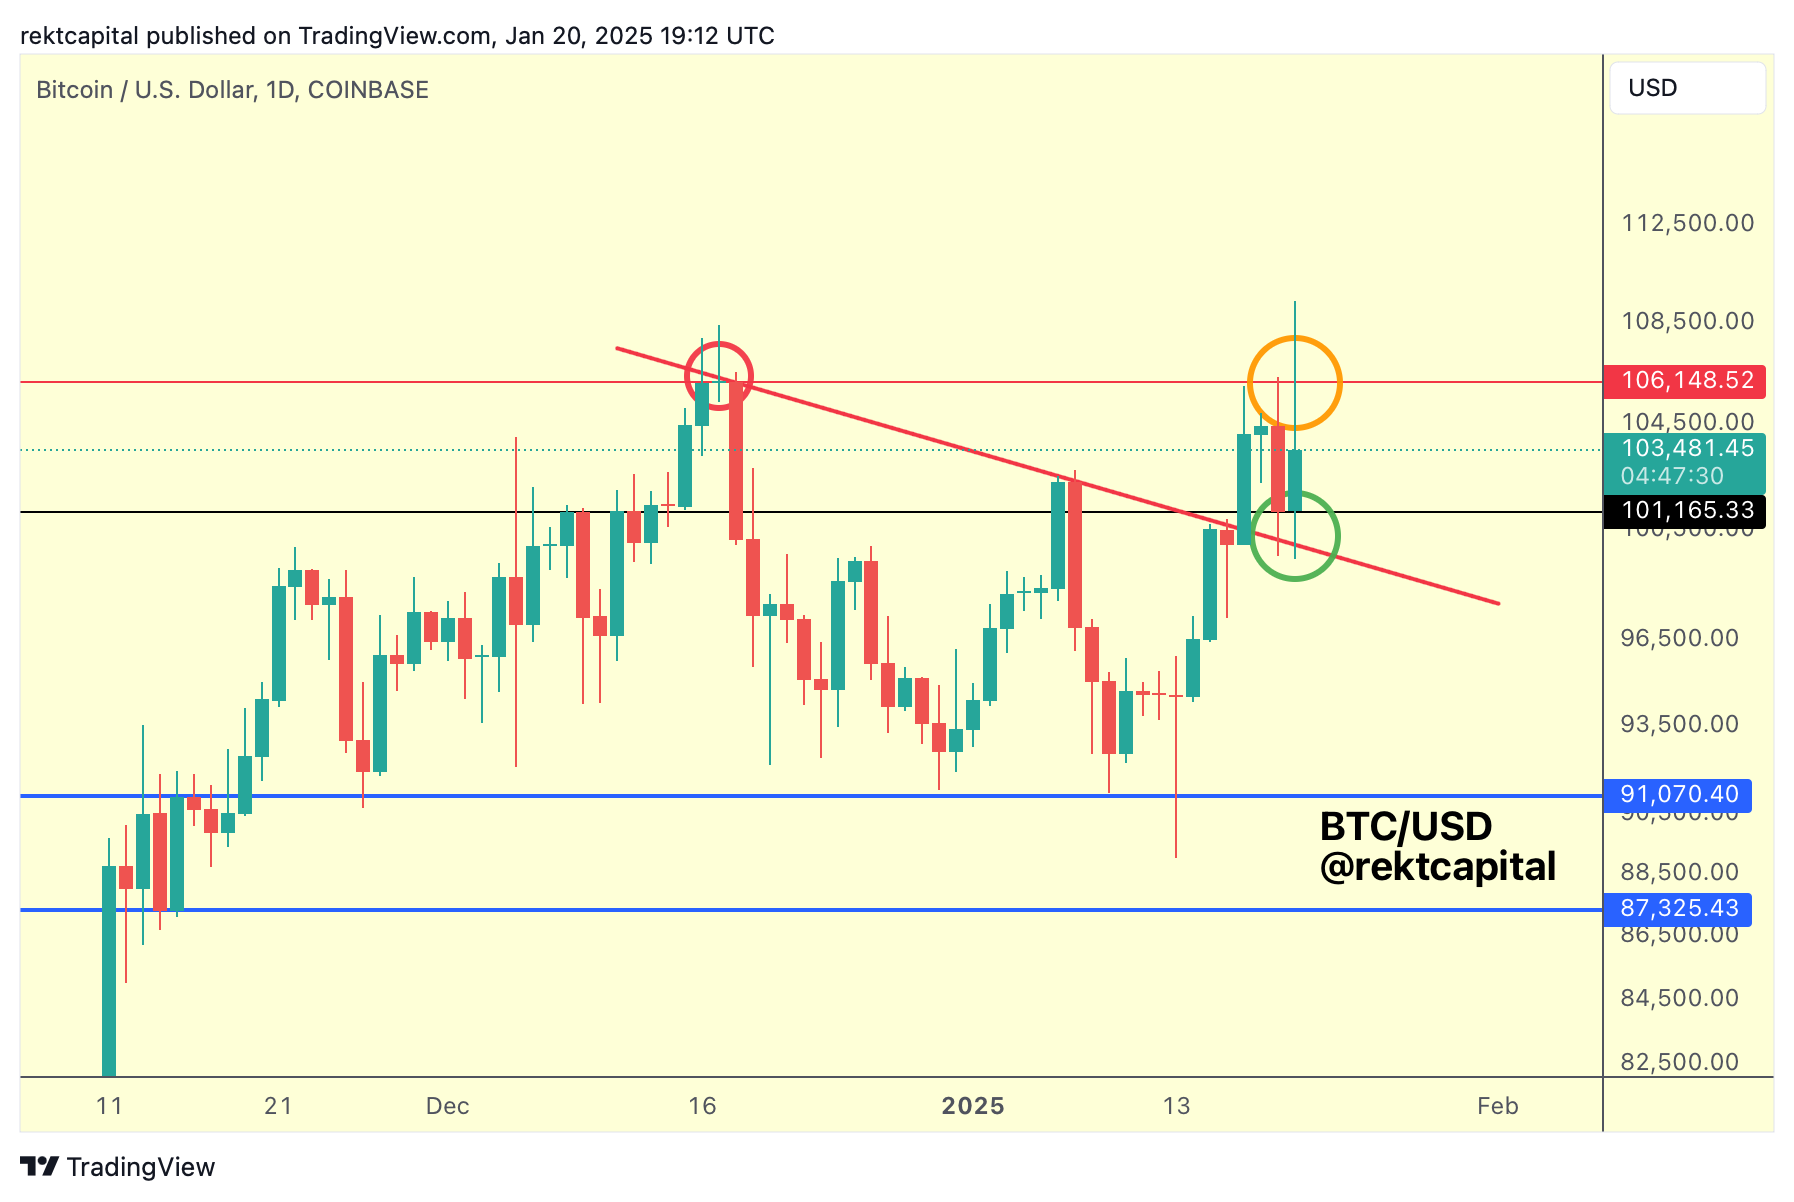
To enable a revisit of the red Range High at $106k again:
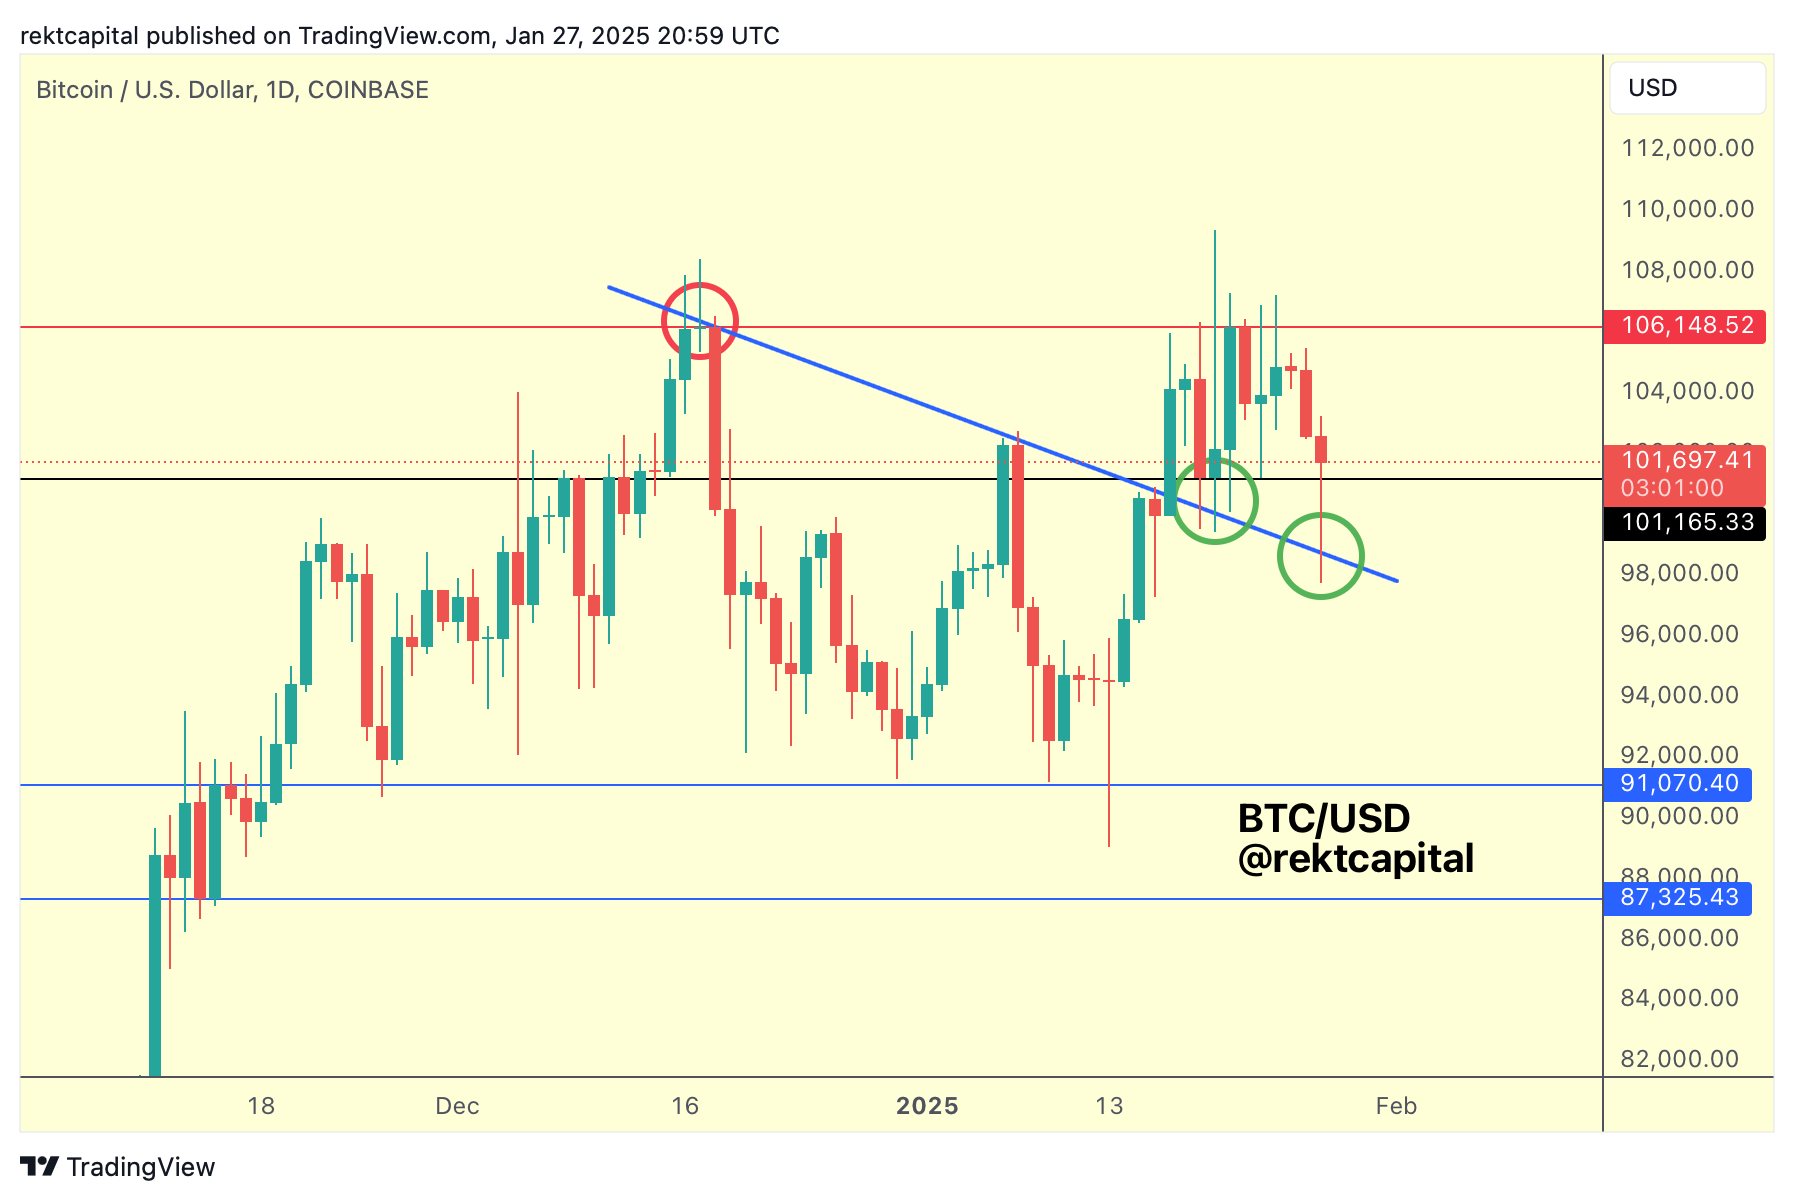
And since that revisit, BTC has dropped back into the Downtrending resistance for yet another retest (green circle), but this time this diagonal is less confluent with the Range Low at $101k (black).
Nonetheless, if this diagonal can hold as support and BTC can Daily Close above the black $101k Range Low, then the range between $101k-$106k would be preserved for additional consolidation.
The Weekly
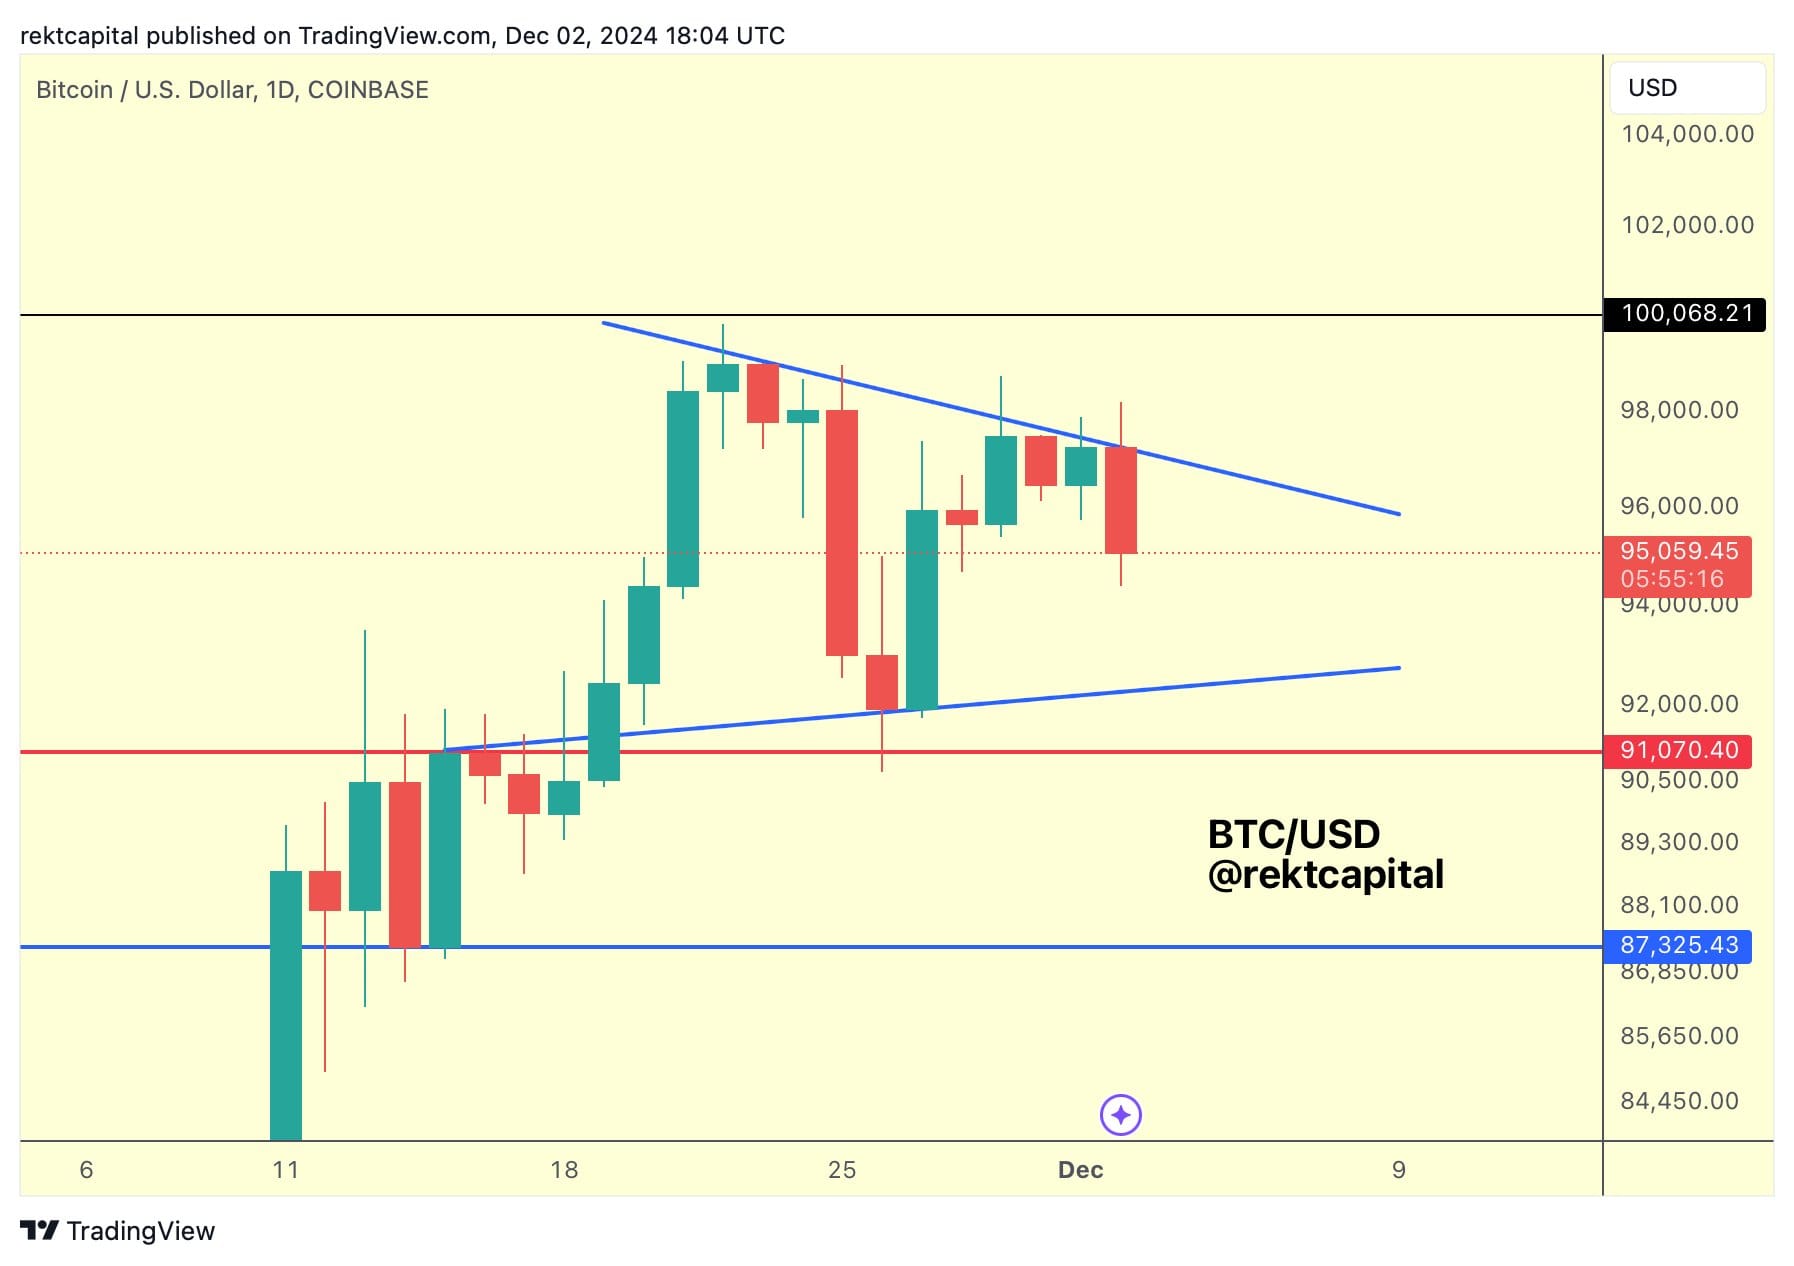
Back in early December, we spoke about BTC forming a triangular market structure:
And it's been almost two months since that time and this triangular market structure still stands, but on the Weekly:
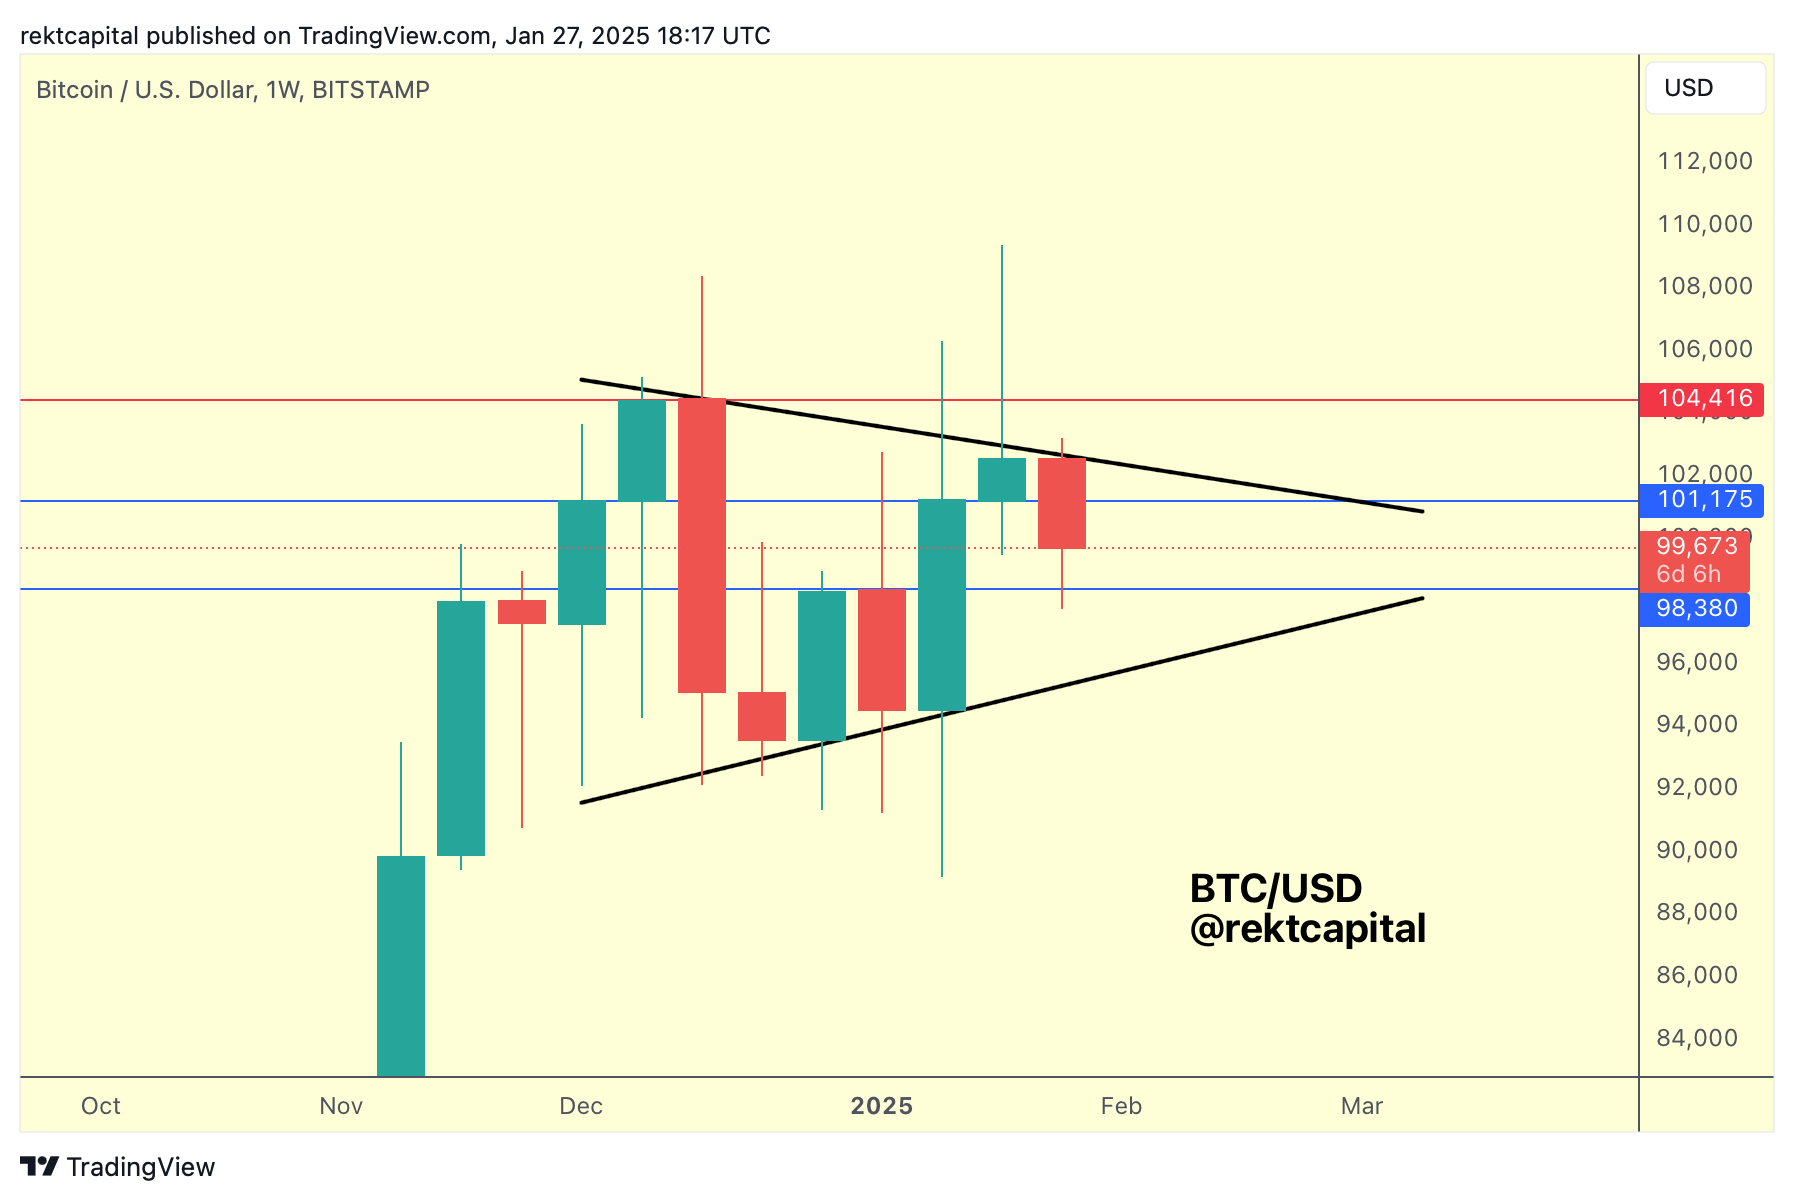
Price compression continues to occur within this pattern as BTC coils into the apex of the market structure in preparation for its next trend-defining moment.
And what's interesting about the base of this triangular market structure is that it is actually approximately confluent with the Monthly Bull Flag:
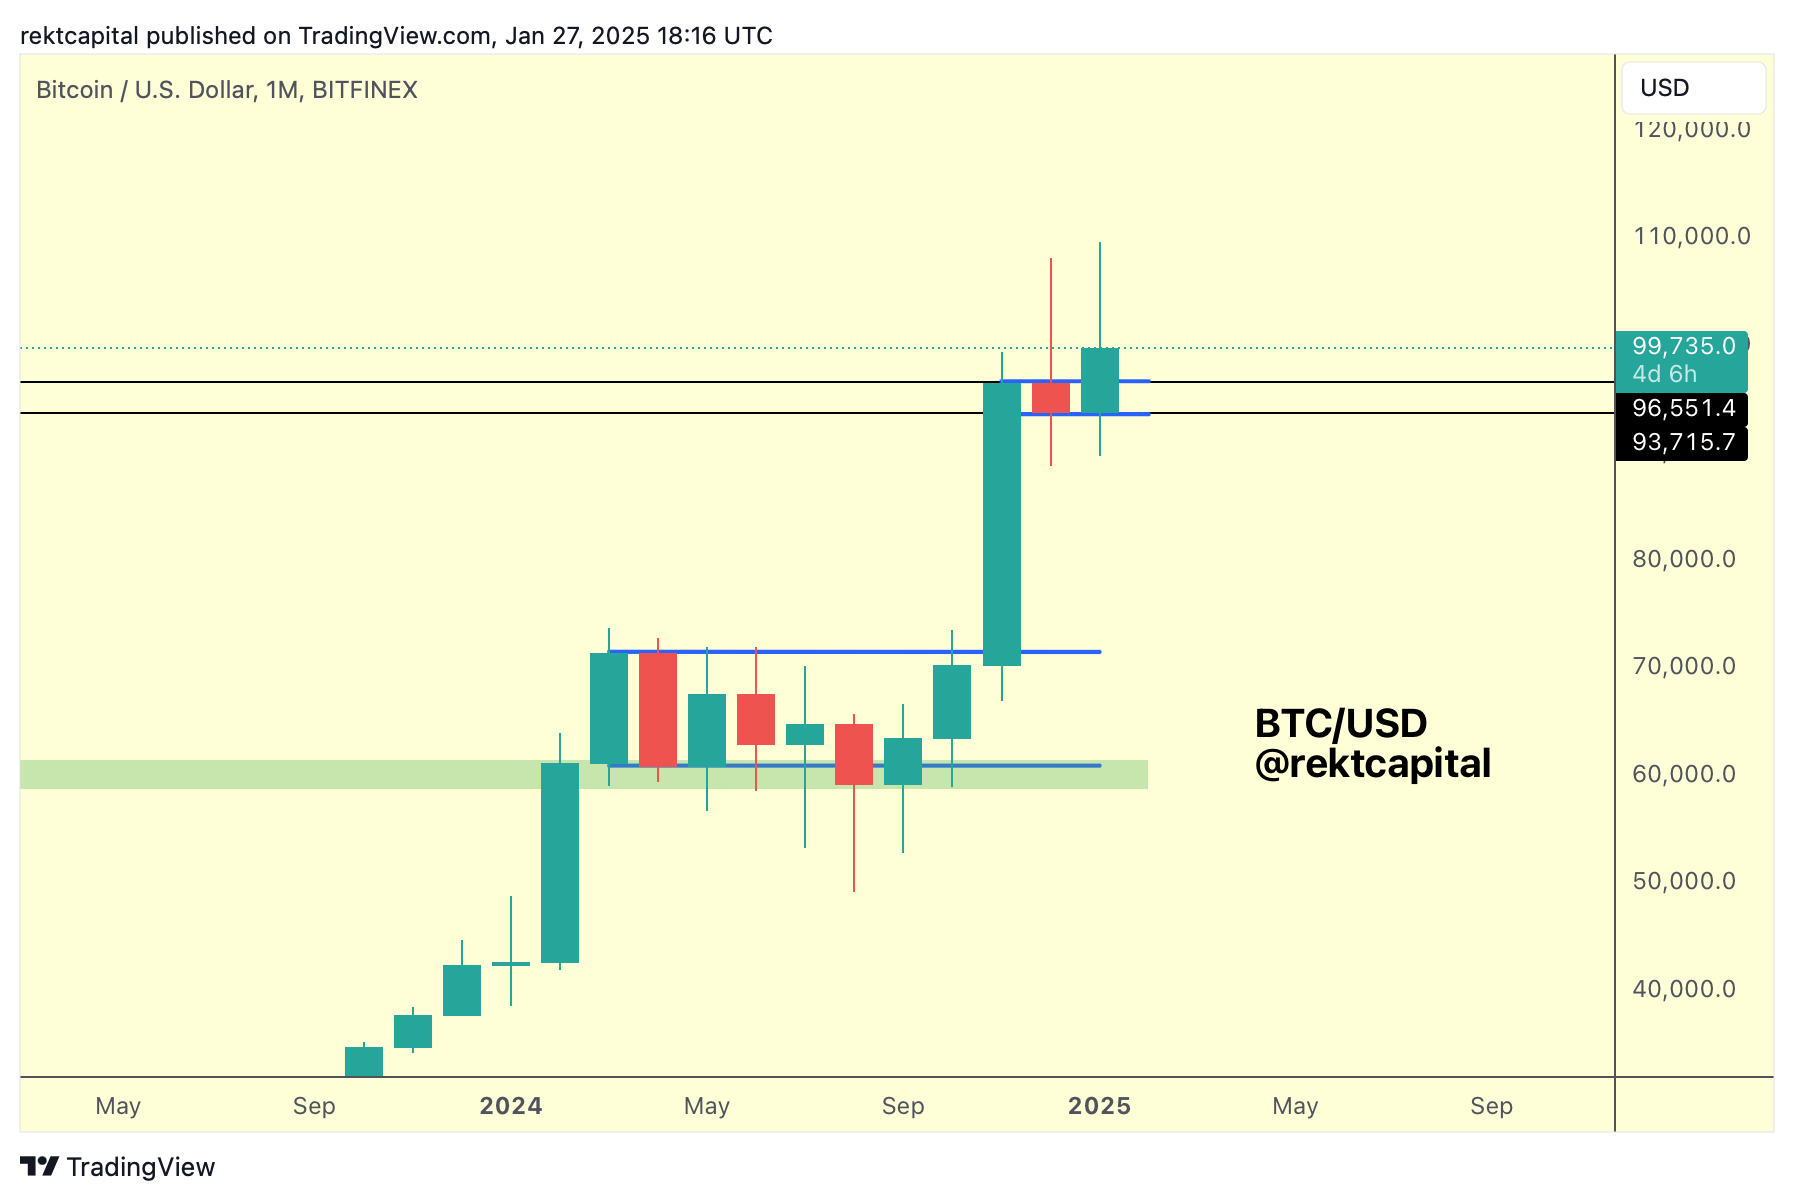
The Monthly Bull Flag is at $96500 and should BTC Monthly Close above this level, February could see price dip for a post-breakout retest of said level to confirm the breakout and enable trend continuation going forward.
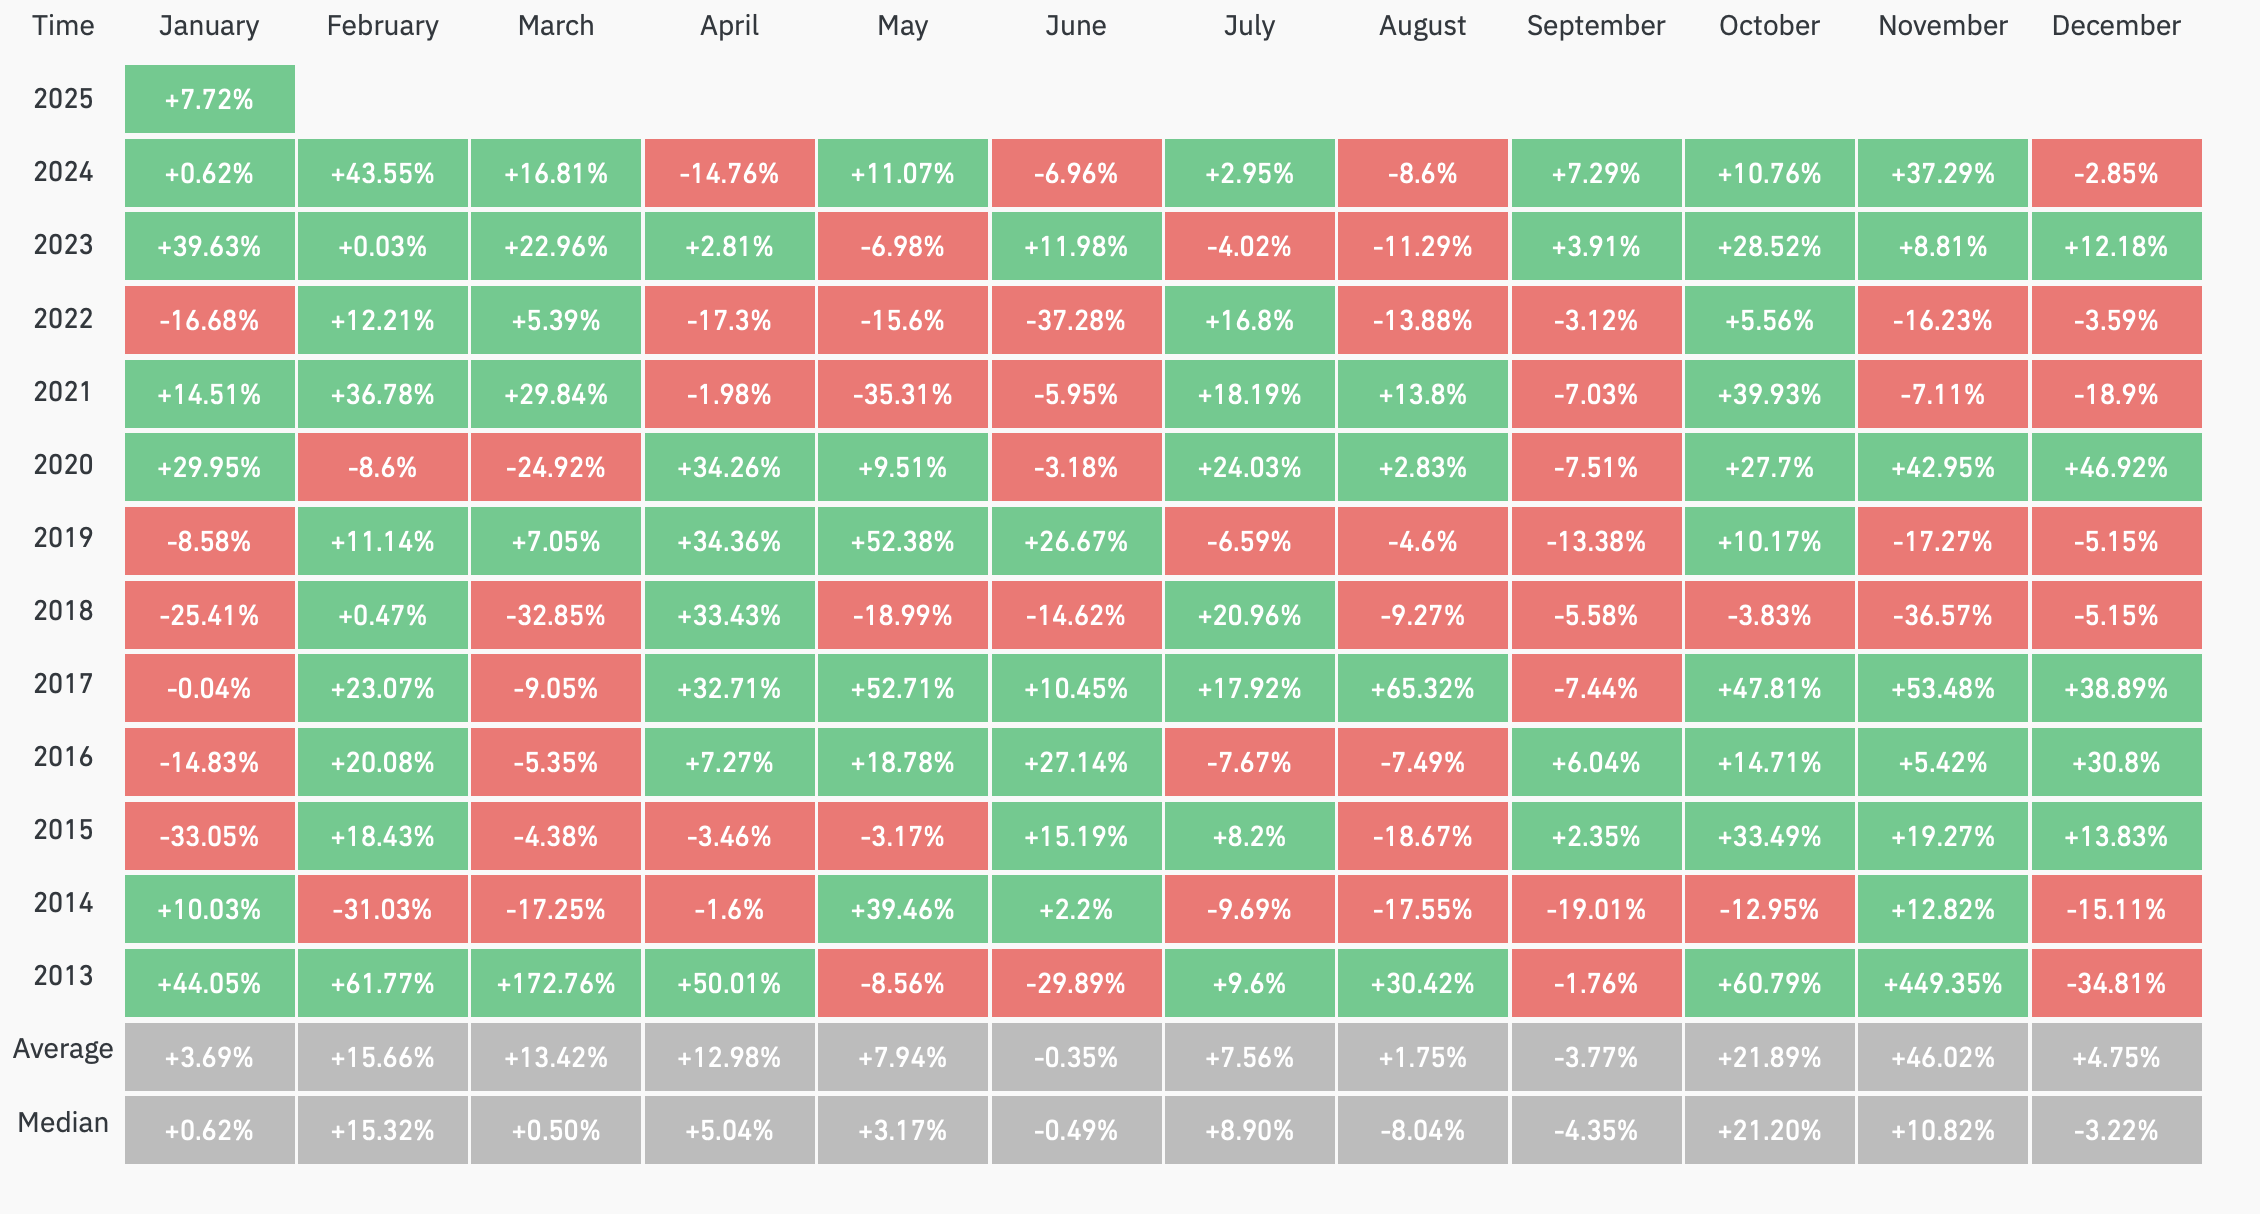
There's a very high chance of downside volatility in the upcoming Monthly Candle of February because if we turn to the previous several month's-worth of price action on the Monthly timeframe, each candle offered a decent-sized downside wick.
However, even with this possibility of downside wicking, there's a strong possibility that that sort of volatility would serve as a means to an end to confirming a breakout from a Monthly structure while also facilitating historical tendencies related to the month of February, which oftentimes across time has figured as a strong month of upside: