Bitcoin - The Macro Diagonal
Breakout & Retest Analysis
For the past month or so, we've been discussing the following chart:
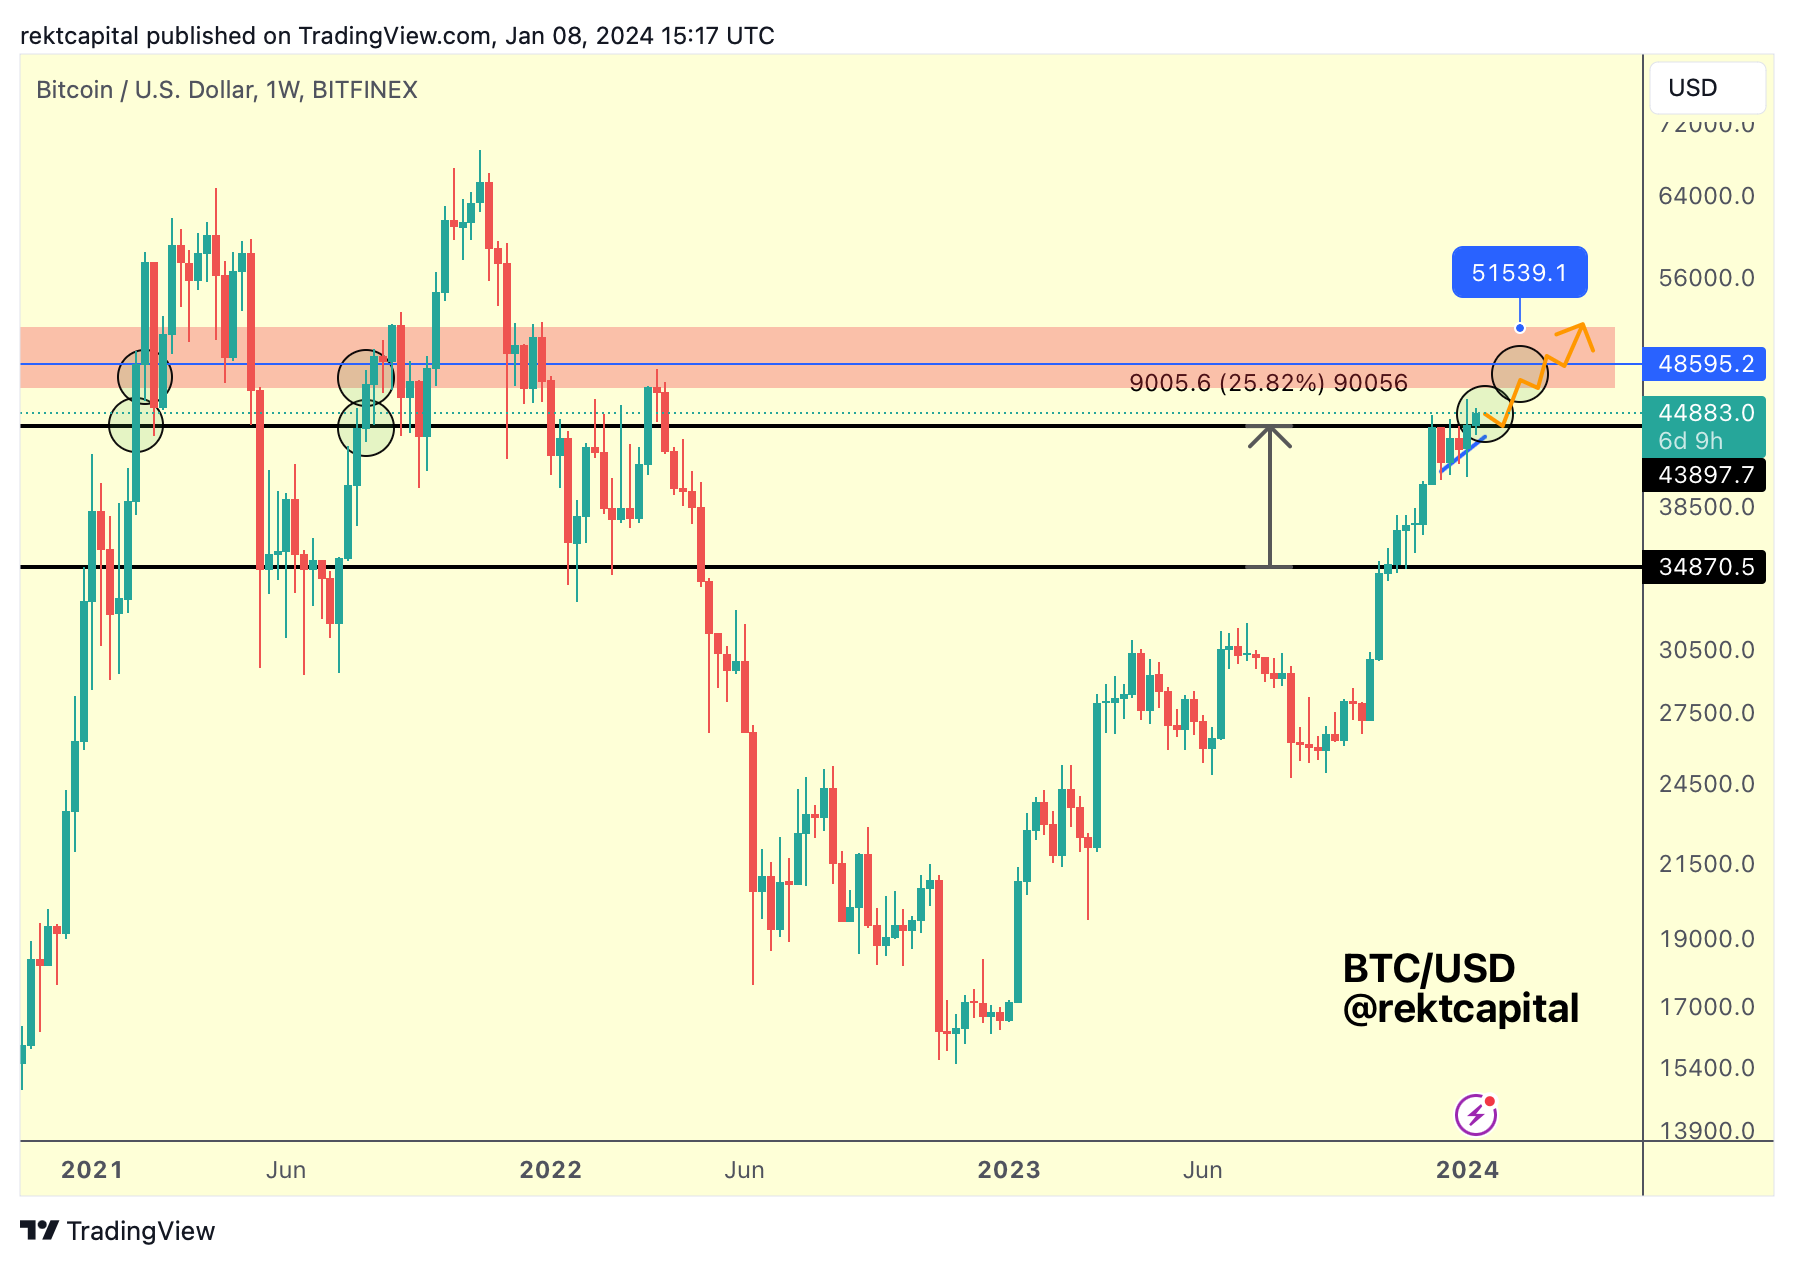
And although this orange path didn't begin earlier this year (because there was a takeout), it was still the pathway that was always going to be a possibility upon breaking beyond $44000 (black) resistance, whether price did that sooner or later.
It turned out that BTC preferred to follow it later, rather than sooner:
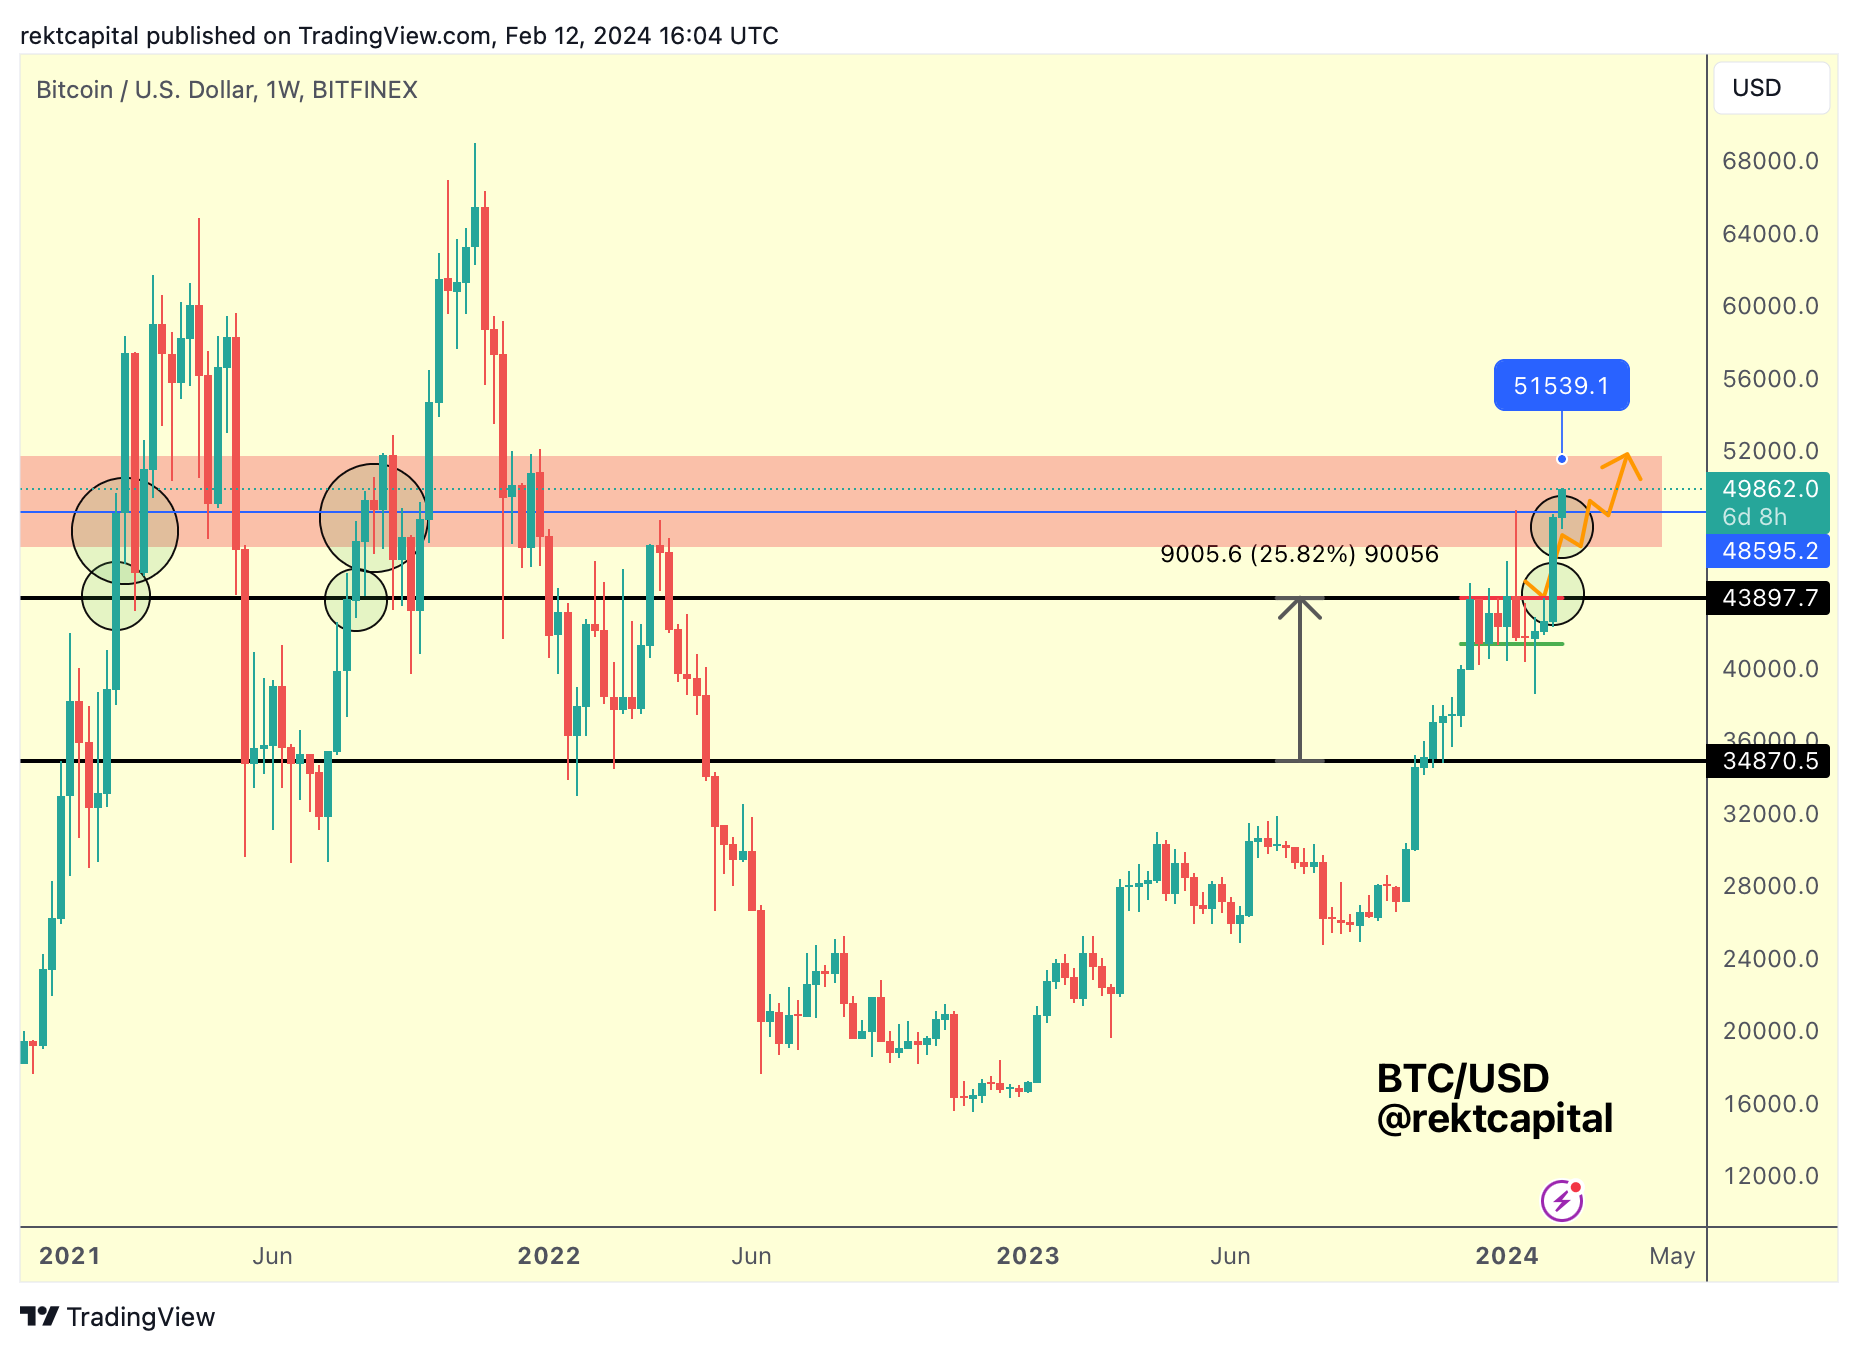
By mid-February, BTC had followed the majority of the orange path.
And as of today, it has completely followed it, fulfilling the expected move:
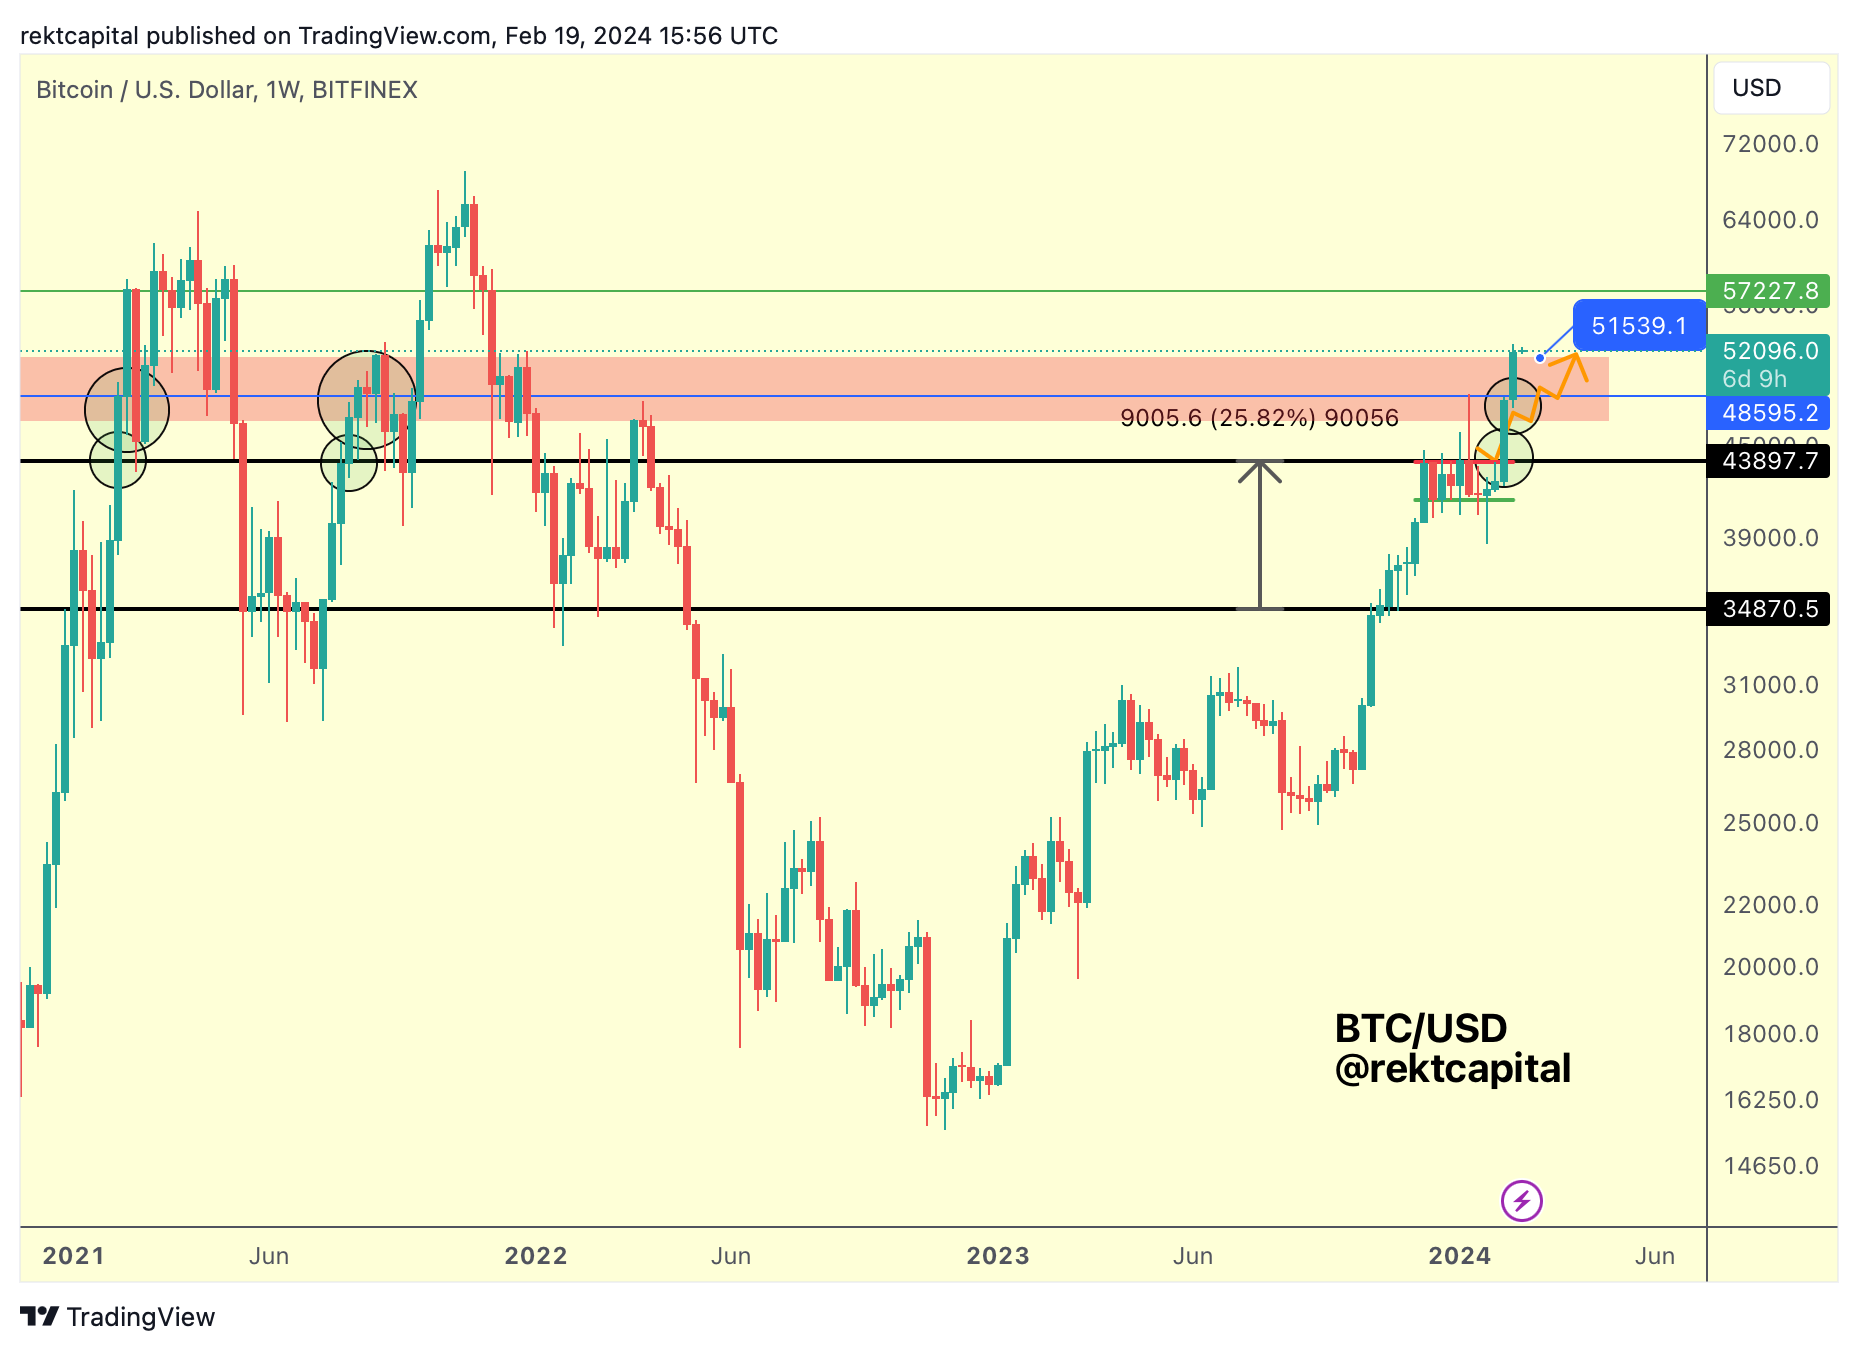
So what's next?
Firstly, it's important to note that BTC has Weekly Closed above the red box top for the first time ever.
And as a result, for the first time ever it is positioned for what could be a retest of the red box top as well, should BTC dip soon:
If BTC manages to successfully reclaim the top of the red box on the retest then BTC could rally to at least the mid-$50000s or even better to the $57000 level (green) with scope for deviation beyond here.
But BTC is slowly reaching thin air, so to speak, when it comes to resistances.
Because BTC hasn't really spend too much time at around current price levels and as a result the supports and resistance around here aren't very clear.
So with BTC Weekly Closing above the red boxed area for the first time ever, it is entering unchartered technical territory.
Because we don't know how BTC tends to behave around these levels.
For example, we know what BTC tends to do when the top of the red box ~$51500 acts as resistance or even the $57000 (green) level does - in the previous Bull Market BTC would reject from here and drop into the ~$44000 region, even to the low ~$40000s if we account for downside volatility:
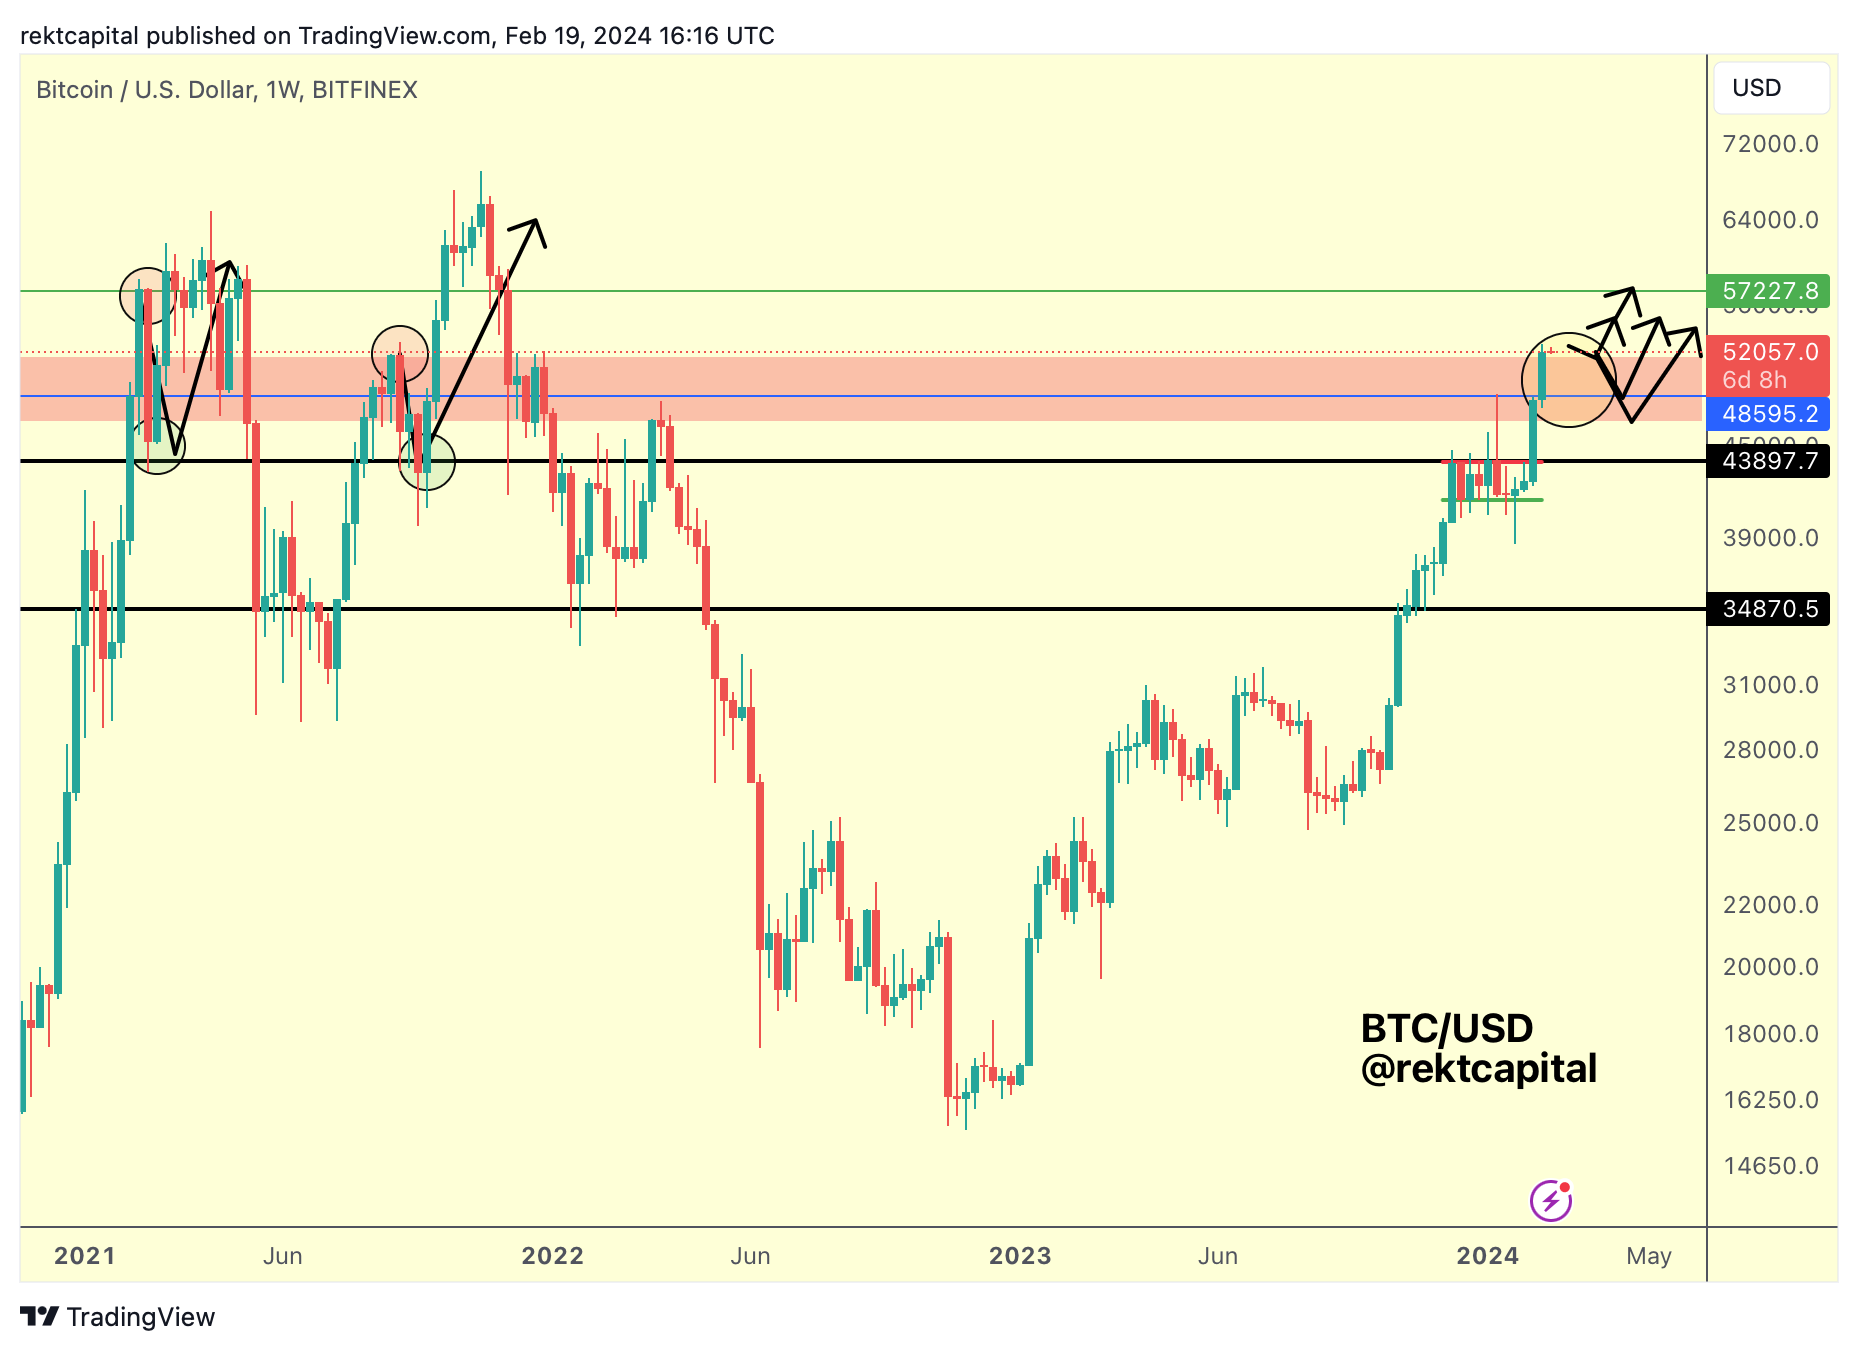
In the first instance from the left, BTC rejected from the $57000 (green) resistance and dropped into the ~$44000 region (black) before reversing to the upside to revisit those initial rejecting highs.
In the second instance, BTC would reject from the $51500 top of the red box before dropping slightly below $40000 (black) before reversing to the upside to revisit those initial rejecting highs.
So if this is a fake-breakout right now beyond the $51500 top of the red box, then worst case scenario could be BTC dropping into the ~$44000 (black).
But because BTC has Weekly Closed above the $51500 red box top, setting itself up for a retest of that same level as new support, as long as that retest is successful, that black $44000 level won't be visited.
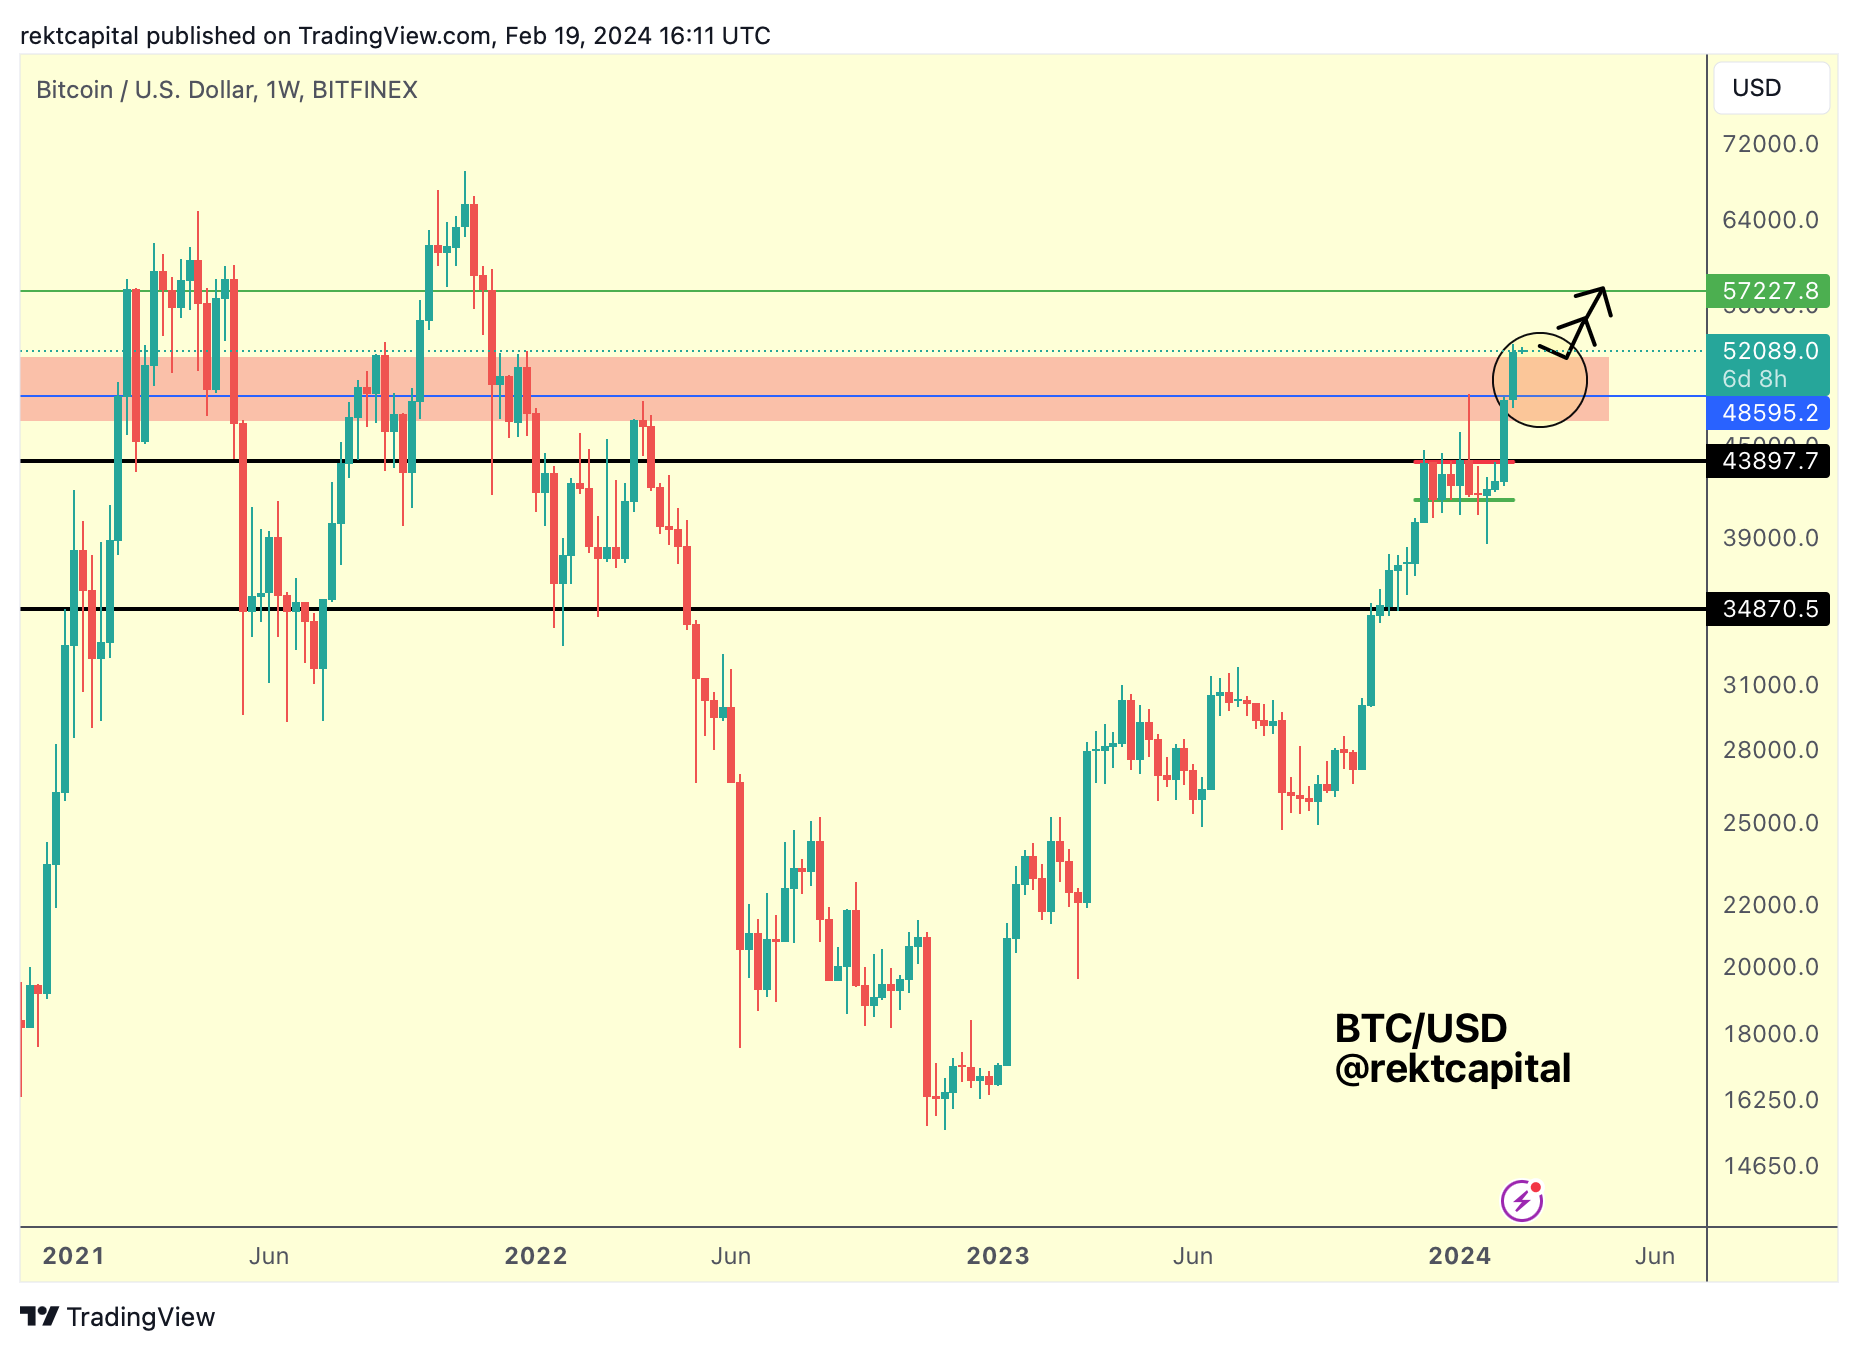
In fact, the most we could hope for is a volatile retest of the $51000 top of the red box, in which case BTC could downside wick anywhere within the red box (i.e. yellow circled area).
So the BTC retest here may very well be in progress - let's see how volatile it will be before continuation.
But continuation in general looks to be more likely given where BTC is in the cycle right now:
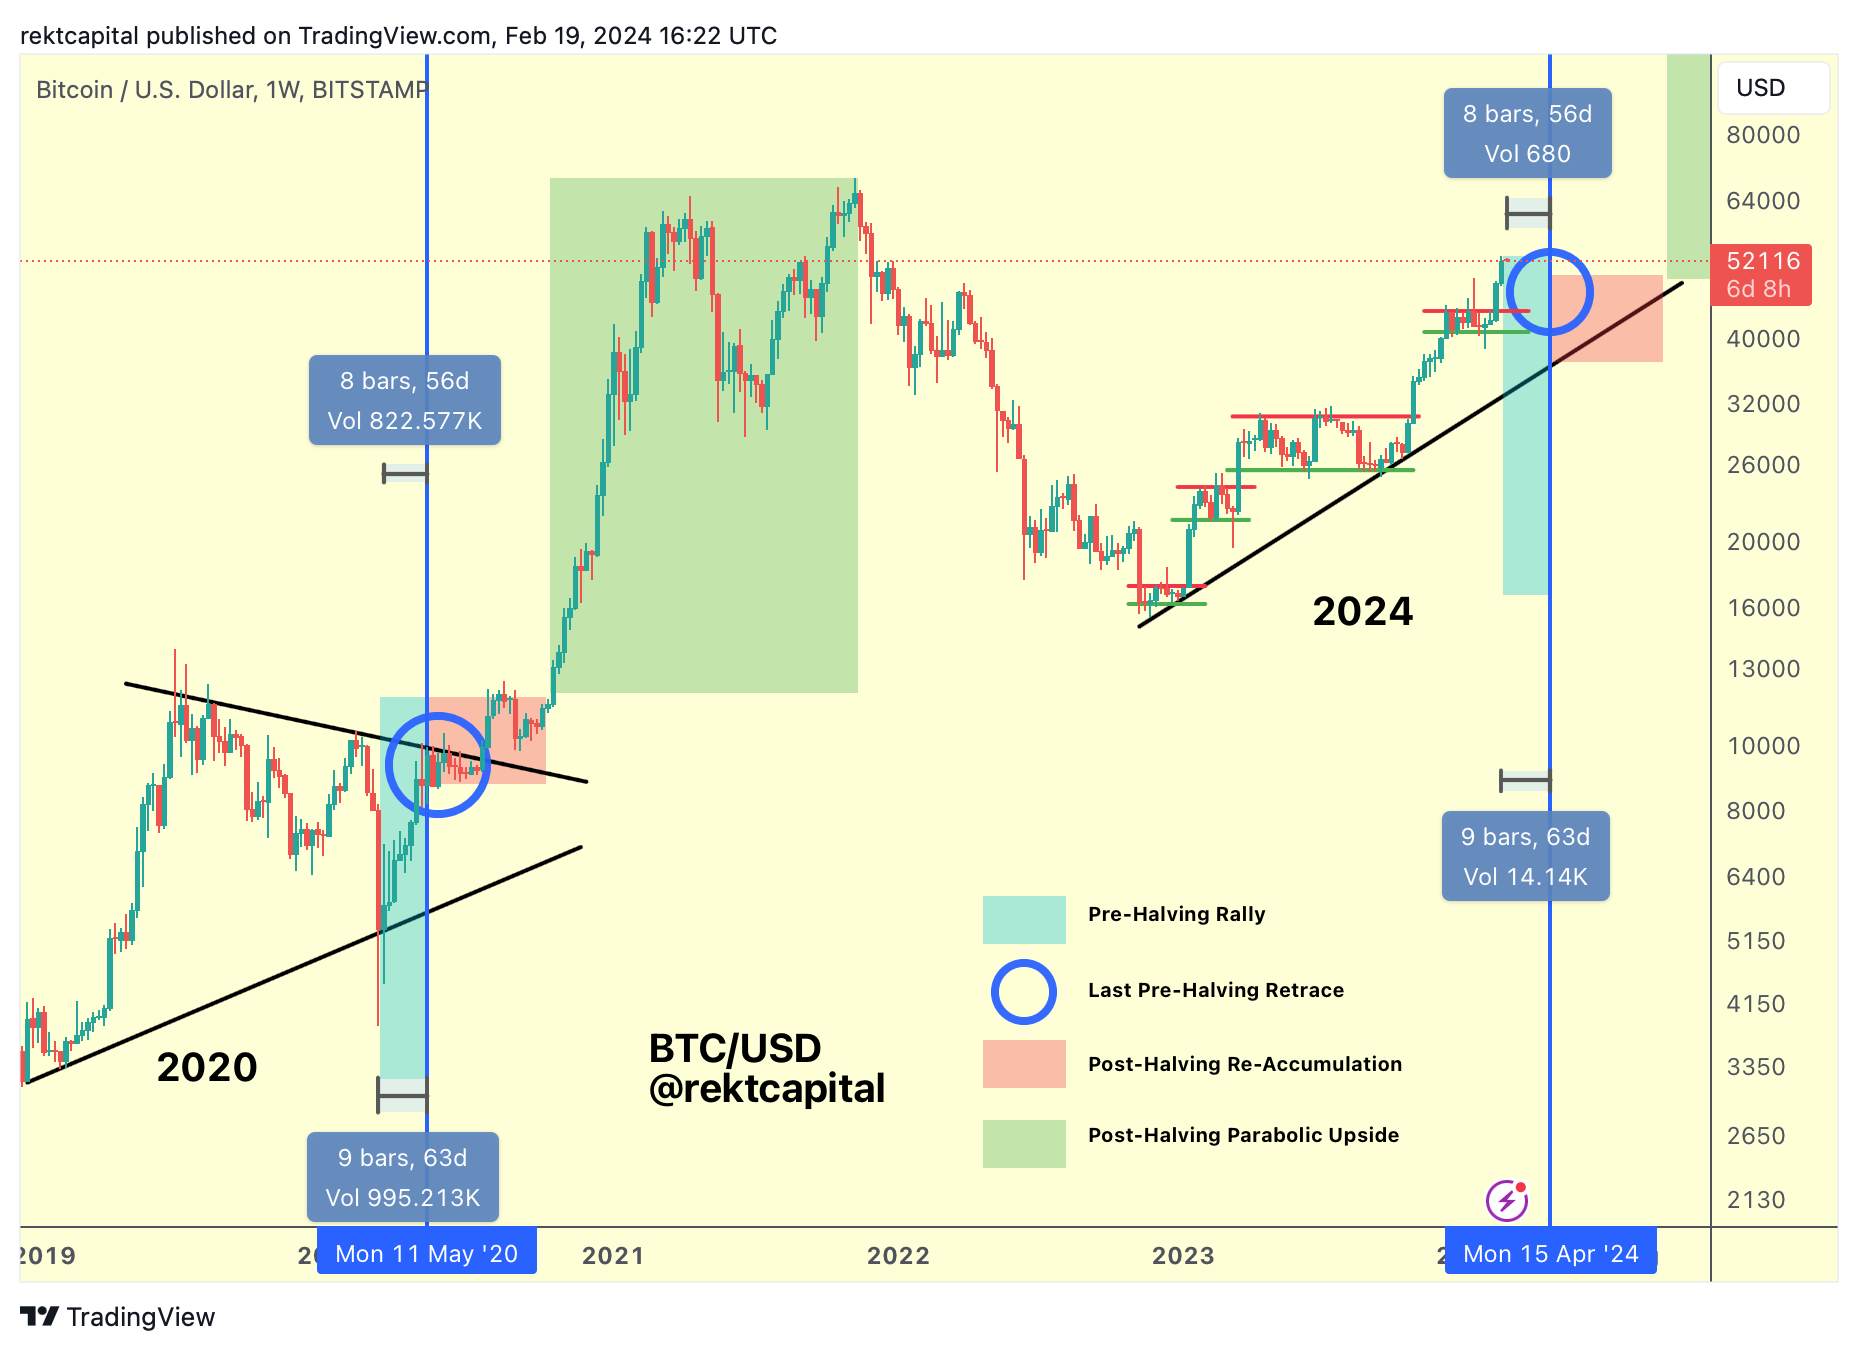
Bitcoin has only just begun its Pre-Halving Rally phase (light blue).
After all, historically BTC tends to begin this phase ~60 days before the Halving and BTC broke out a few days ahead of schedule.
But there's no denying that BTC can offer small dips during its Pre-Halving Rally, but these dips tend to be short-lived and rather shallow.
Generally however, Pre-Halving Rally dips may help capture a confirmed trend but the best bargain-buying opportunity is likely going to be during the Pre-Halving Retrace (dark blue circle).