Bitcoin - The Breakout
Re-Accumulation Range Reclaimed
Welcome to the Rekt Capital newsletter, a resource for investors who want to better navigate the crypto markets with the help of cutting-edge crypto research and unbiased market analysis.
The Re-Accumulation Range
Last week we spoke about the Bitcoin ReAccumulation Range and how price had performed its first Weekly Closed below it, but how this could've become a fake-breakdown if Bitcoin were to reclaim the $60600 level as support.
Here's last week's chart:
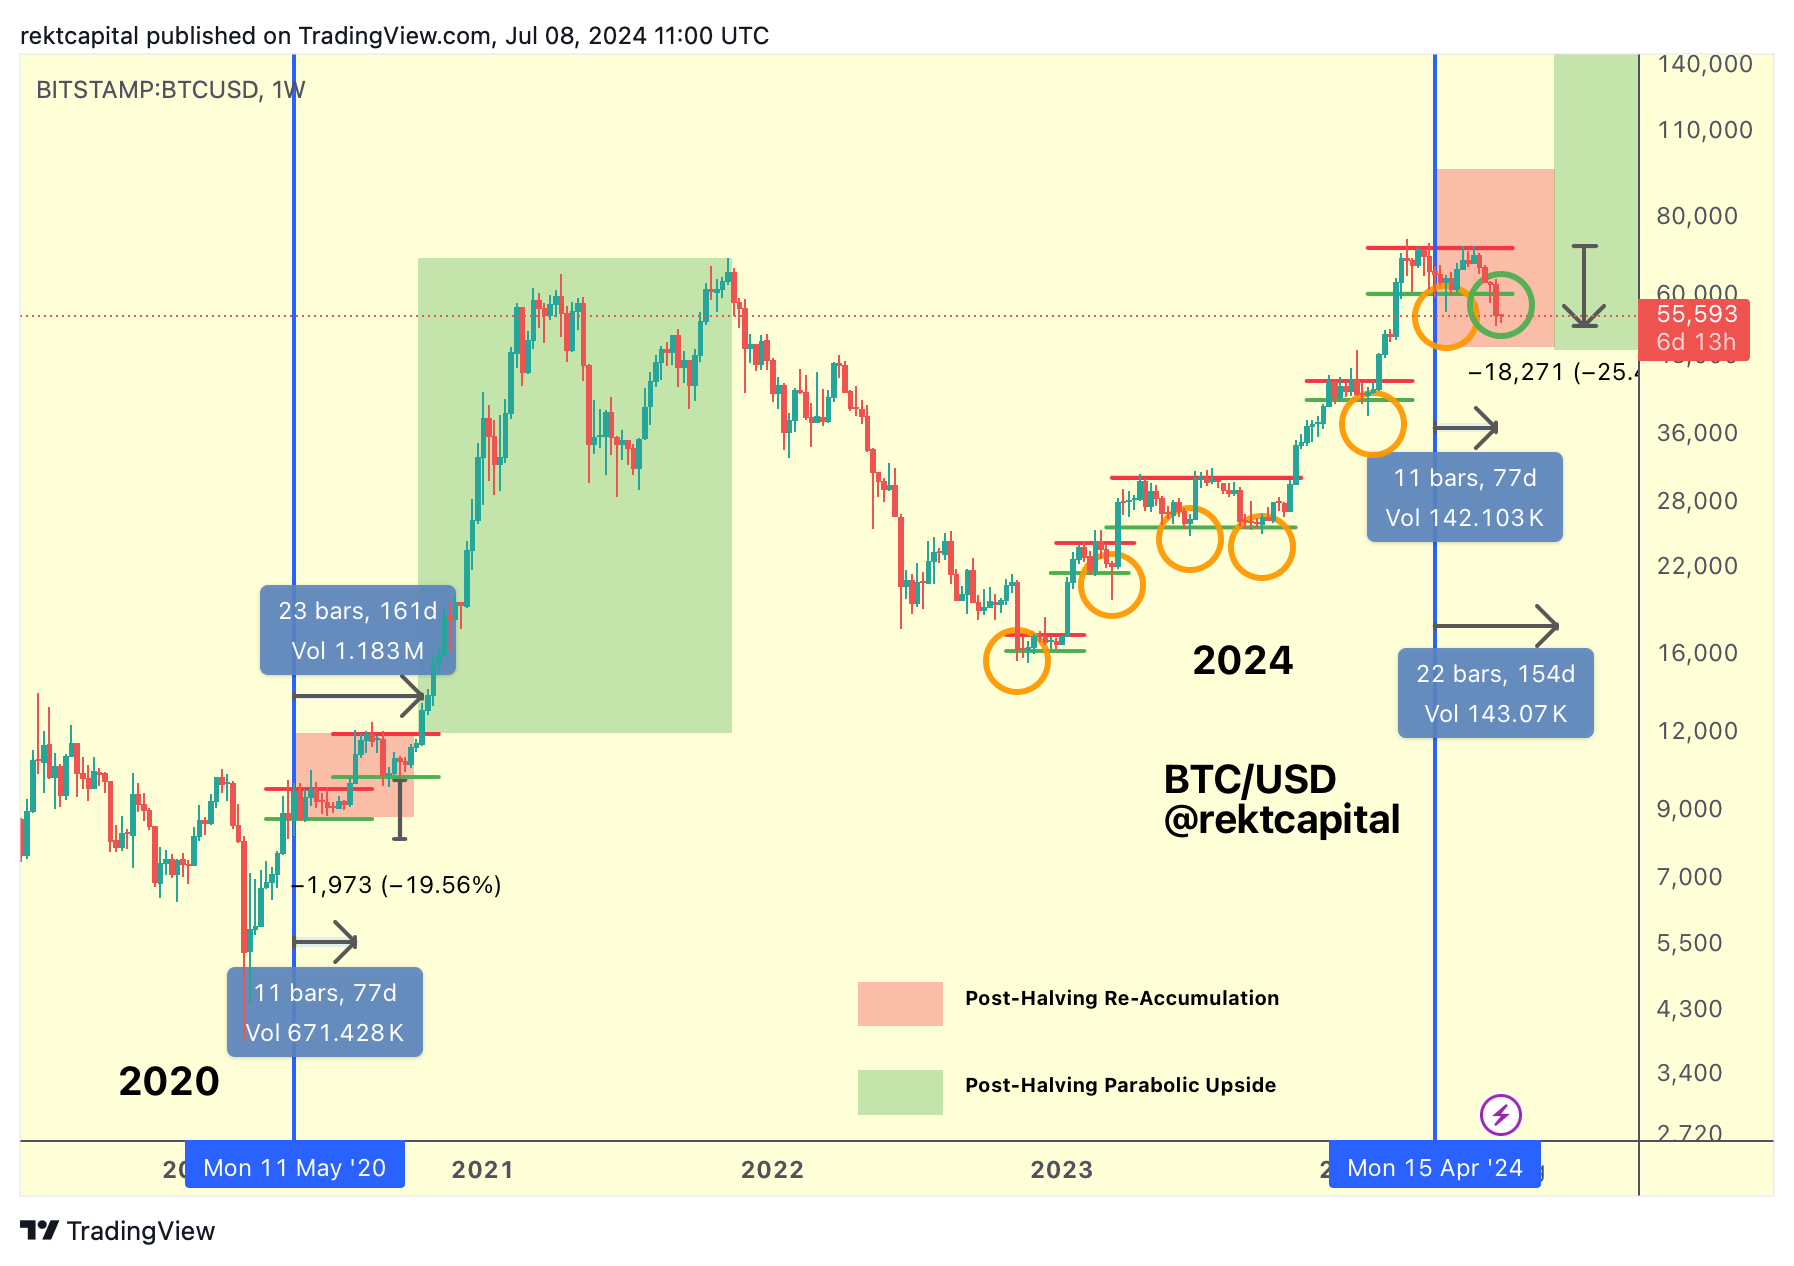
And here is a quote from last week's newsletter:
Technically, this is the beginning of a breakdown, however it's important to emphasise that a confirmed breakdown would only occur if BTC were to now rally to the $60600 level and turn that level into new resistance to reject into downside continuation. Until that second part of the breakdown occurs, this could very well still end up as a fake-breakdown and/or downside deviation below the Re-Accumulation Range.
Here is today's chart:
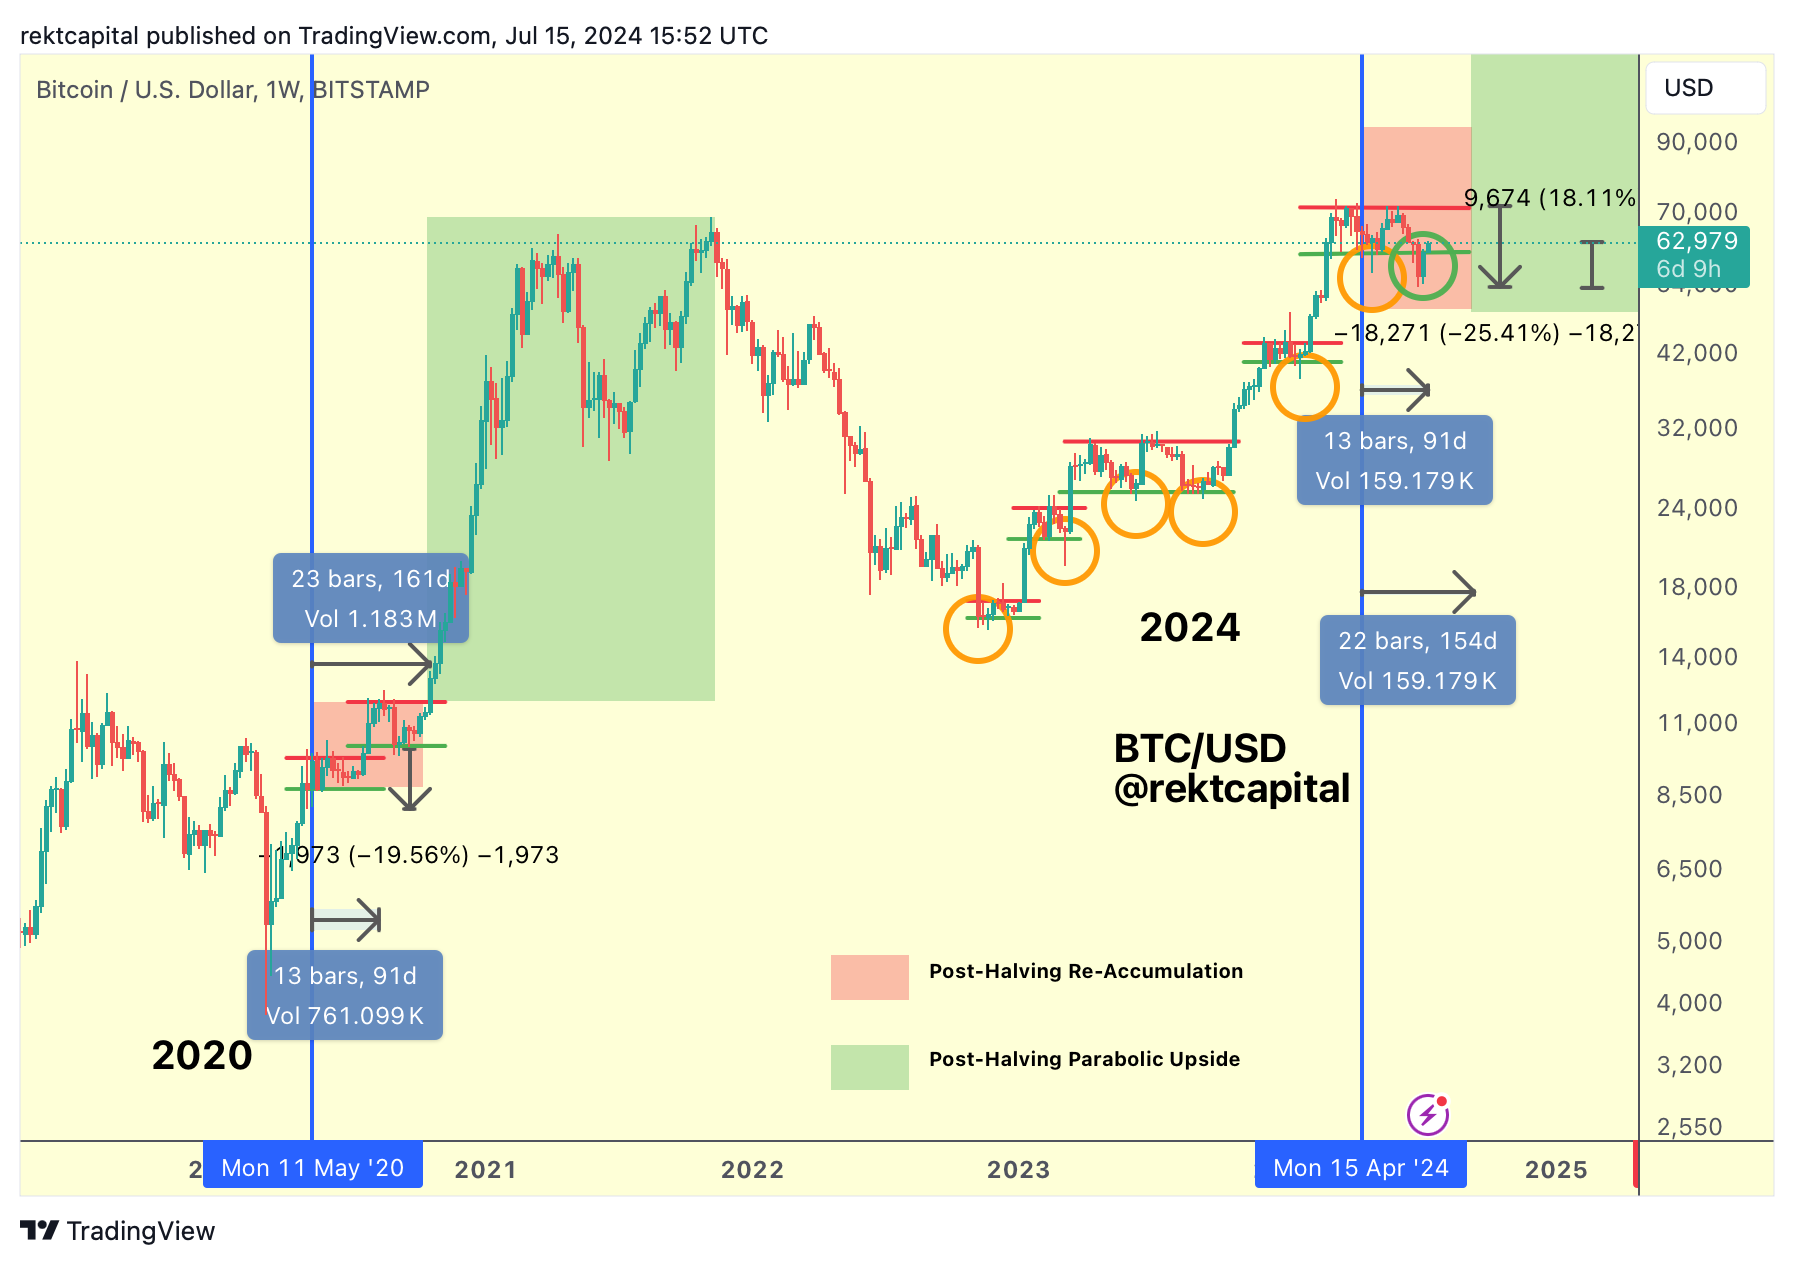
Bitcoin has been able to Weekly Close above the $60600 Range Low of the ReAccumulation, invalidating the breakdown and positioning itself for a reclaim of the Range Low back into support.
Bitcoin has reclaimed the ReAccumulation Range.
Effectively, the price behaviour we'd been seeing below ReAccumulation Range Lows across the cycle (i.e. orange circles) have been downside wicks into bargain-buying territory.
This time was no different in terms of outcome, but the style in which Bitcoin did this is what surely caught many off-guard.
Bitcoin produced its first Weekly Close below the Range Low but in doing so, price never fully confirmed this breakdown, something we'd spoken about last week.
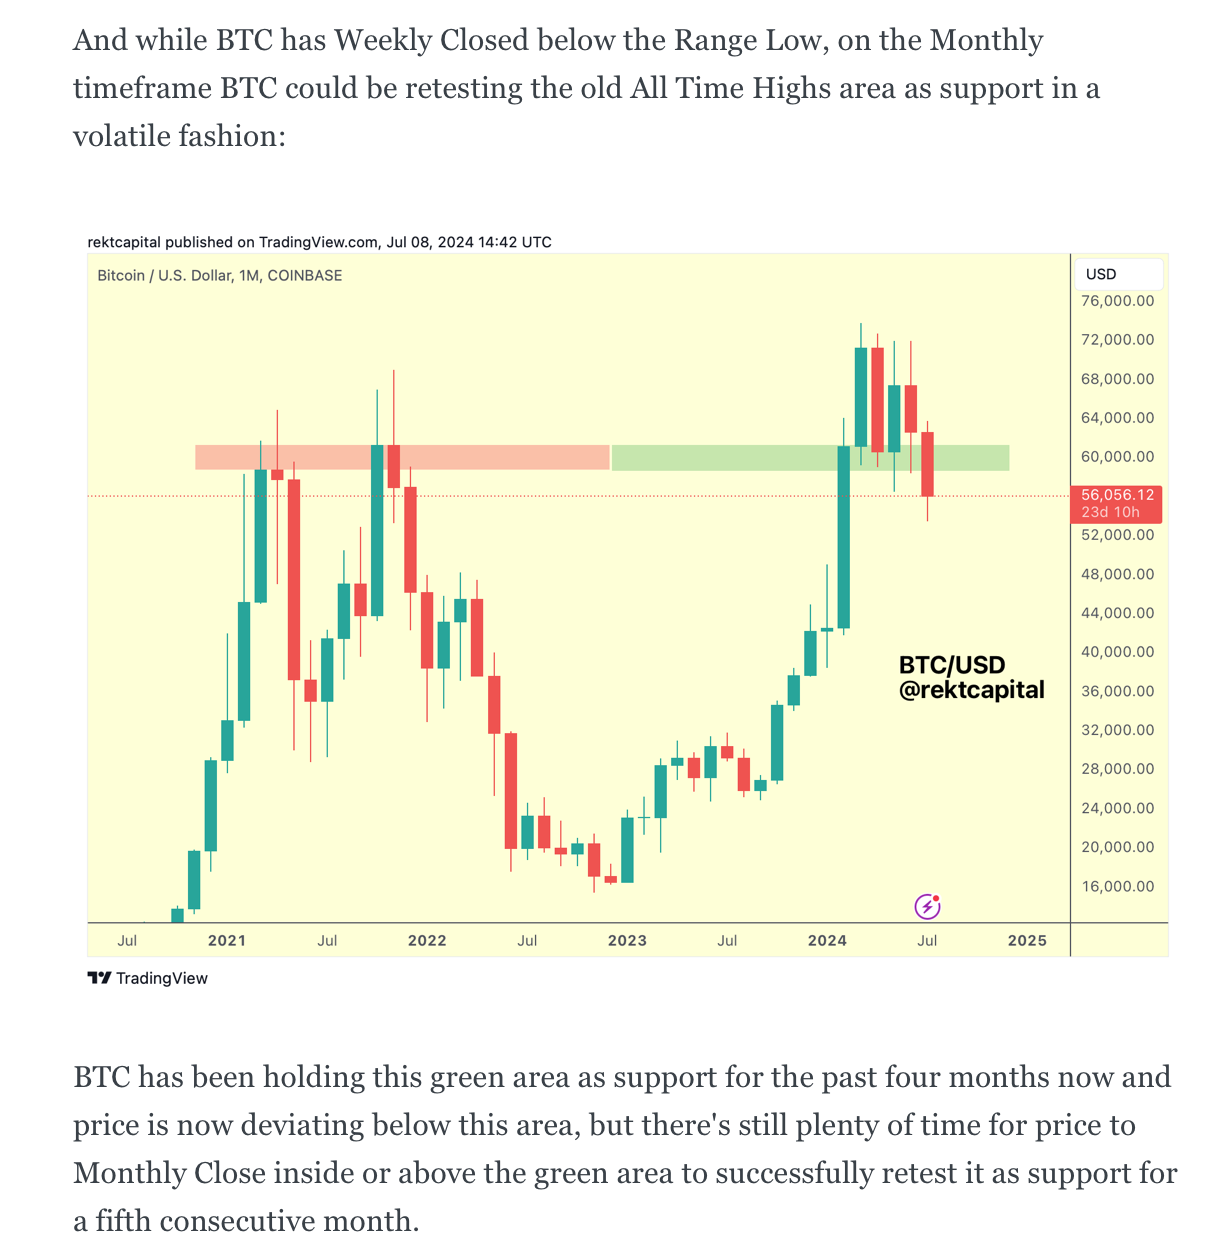
In fact, last week we also touched upon how the Monthly timeframe was showcasing a volatile retest.
Here is last week's analysis:
And here is today's chart:
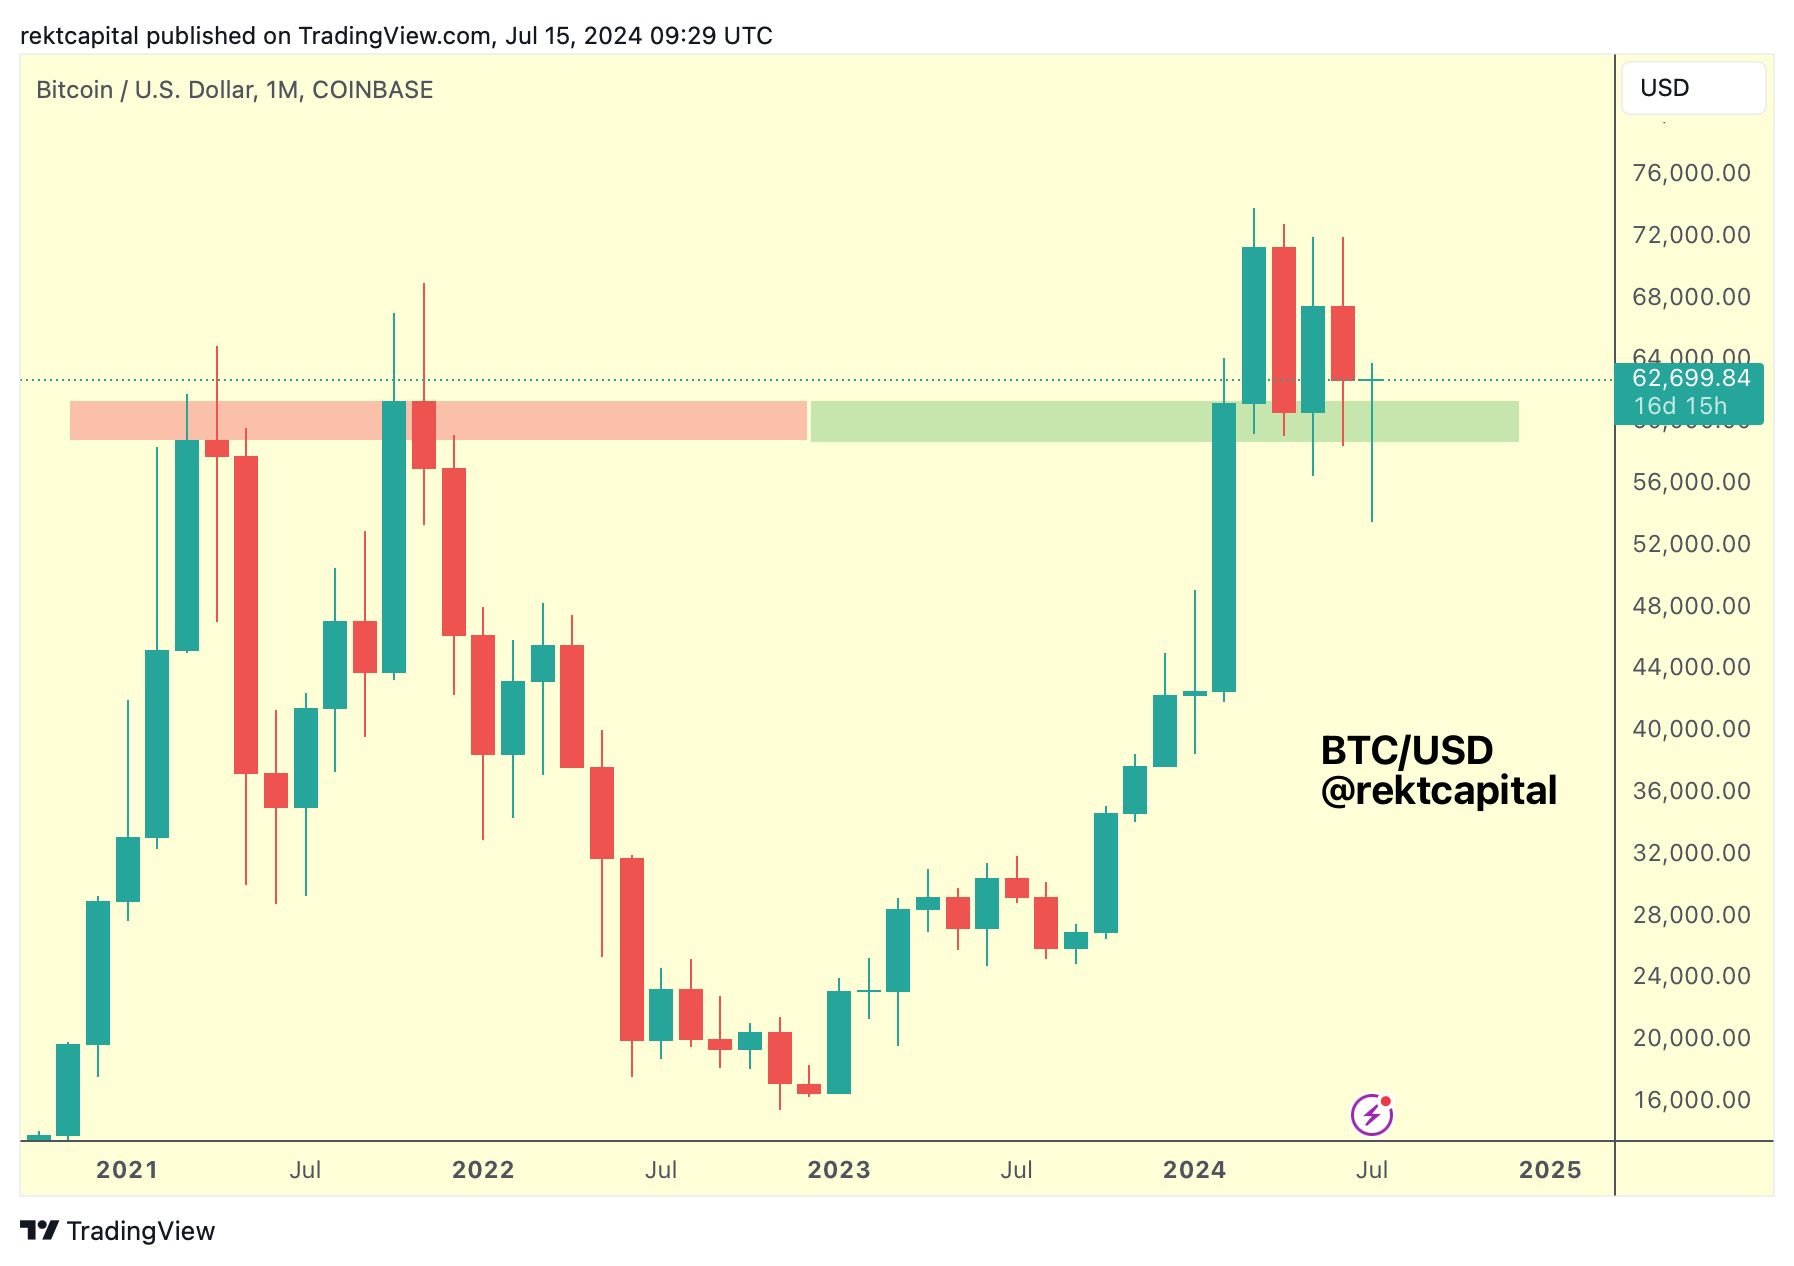
This current month of July is now figuring as a long downside wick because price has returned back above this old All Time High area which has been acting as support for what is now 5 consecutive months.
This is promising because price has managed to grab liquidity at lower levels while still maintaining a higher timeframe demand area as support.
We covered the Quarterly timeframe in the same vein last week as well.
Here is last week's analysis:
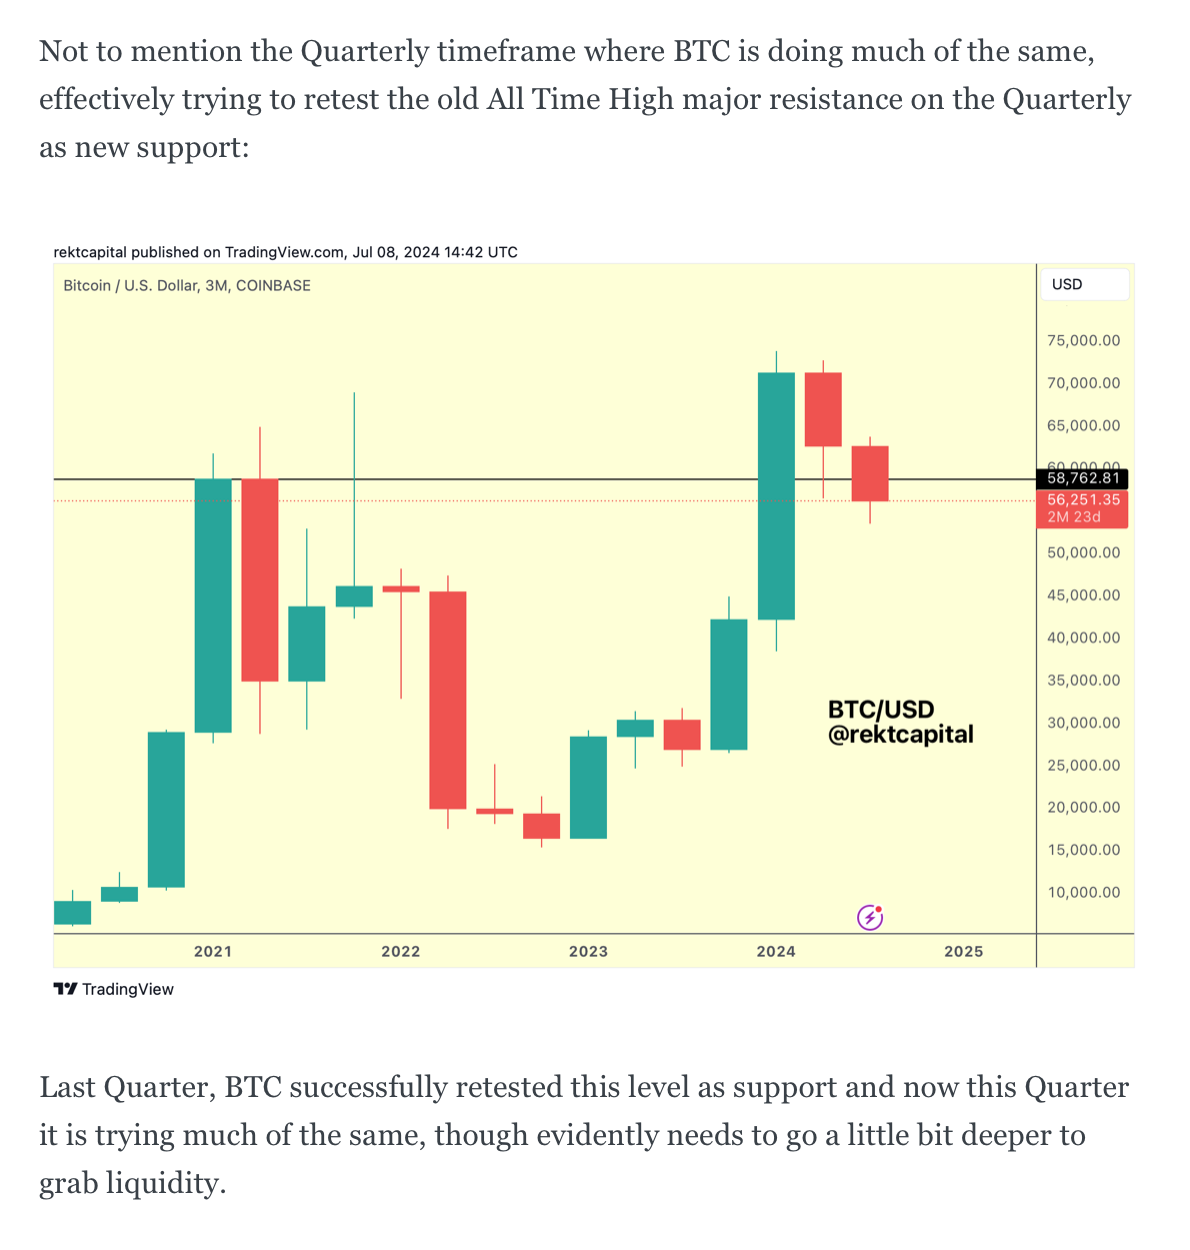
And here is today's chart:
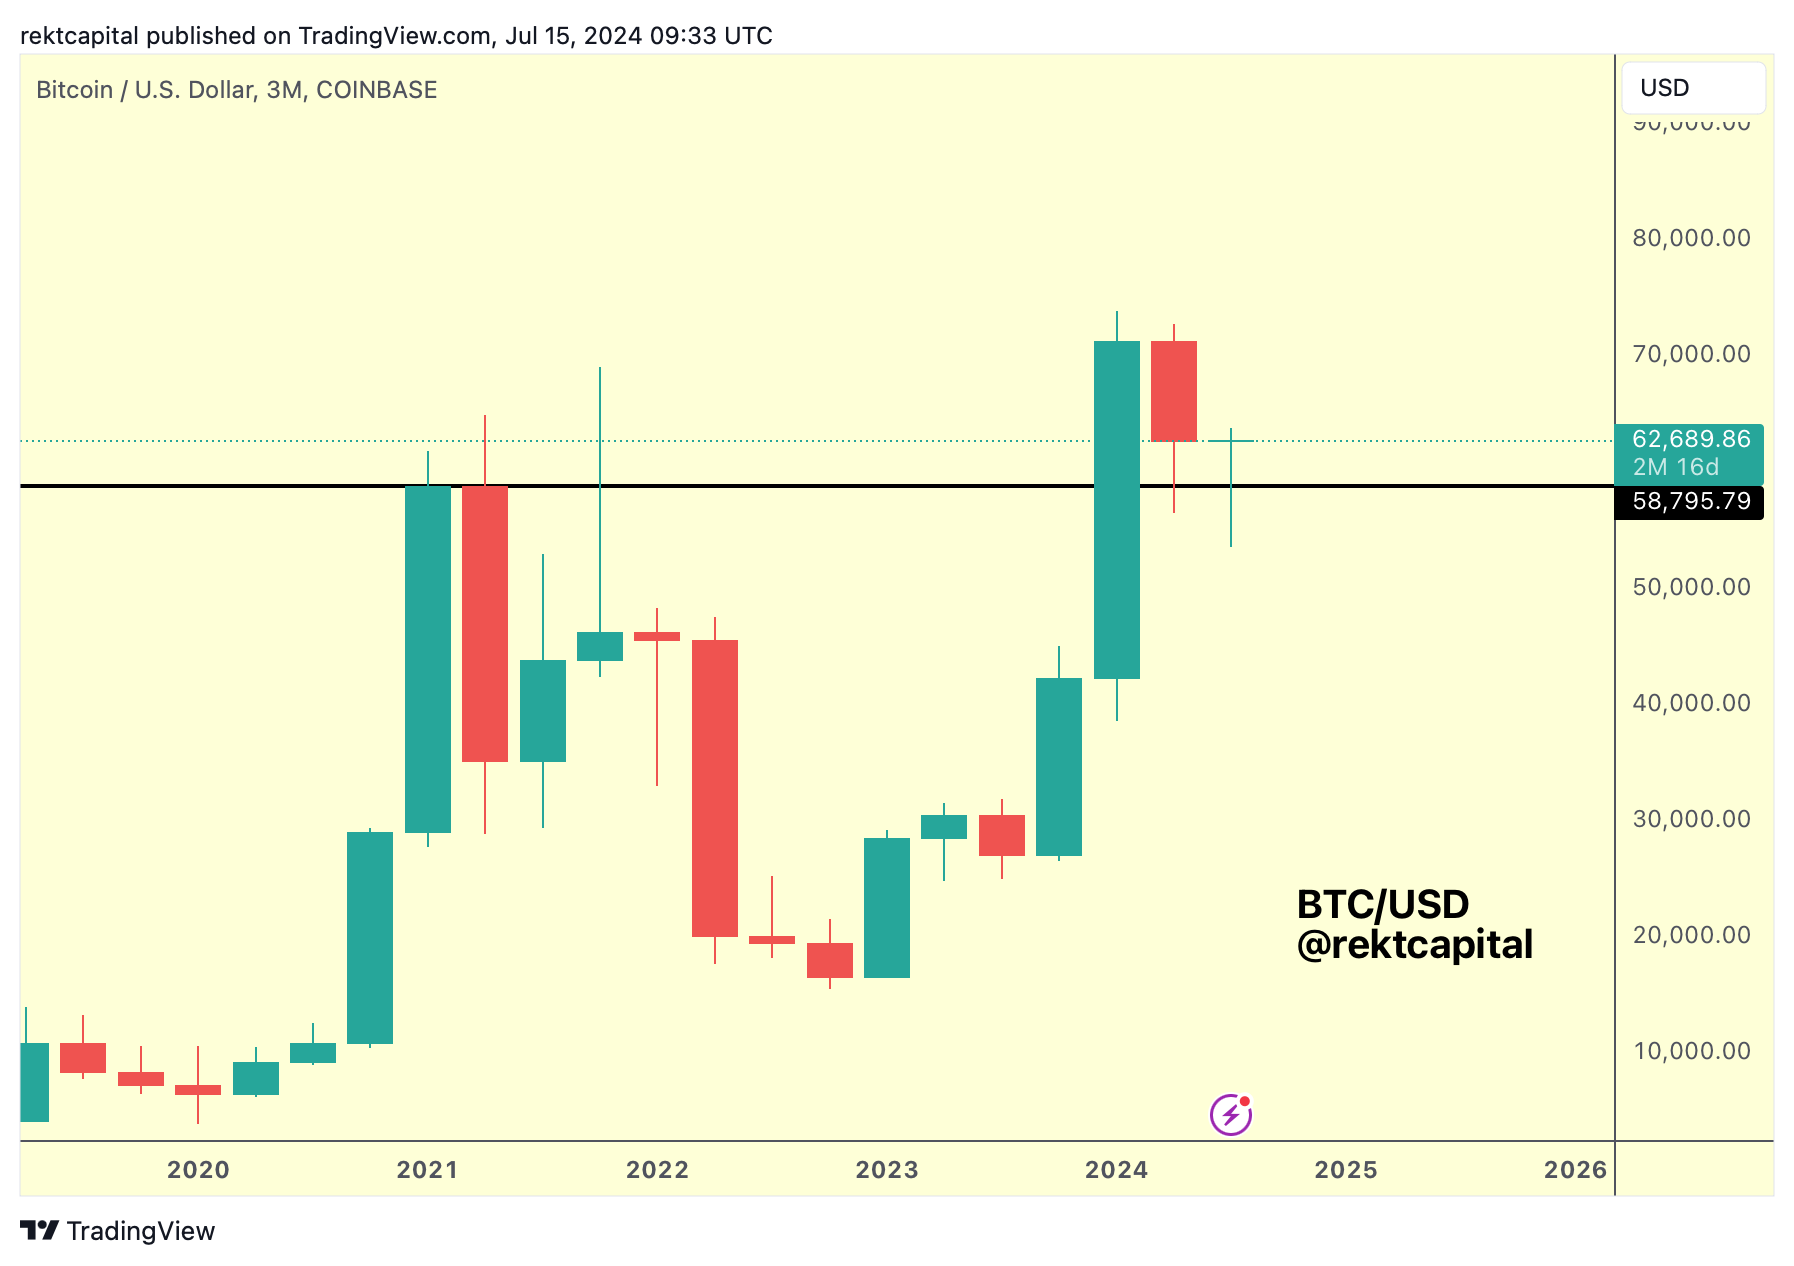
Bitcoin is successfully retesting this old Quarterly resistance as new support and is doing so in back-to-back quarters.
Of course, the Quarterly Close is still far away and it wouldn't be far-fetched to think of a scenario where we could still see another retest attempt into the black level over the next 2.5 months.
But Bitcoin is showcasing positive signs of holding major demand areas as support on higher timeframes which is a technical prerequisite for a future breakout to new All Time Highs to enter the Parabolic Phase of the cycle.