Bitcoin - The Breakdown
Crucial higher timeframe analysis
Welcome to the Rekt Capital newsletter, a resource for investors who want to better navigate the crypto markets with the help of cutting-edge crypto research and unbiased market analysis
The Weekly Channel - Breakdown?
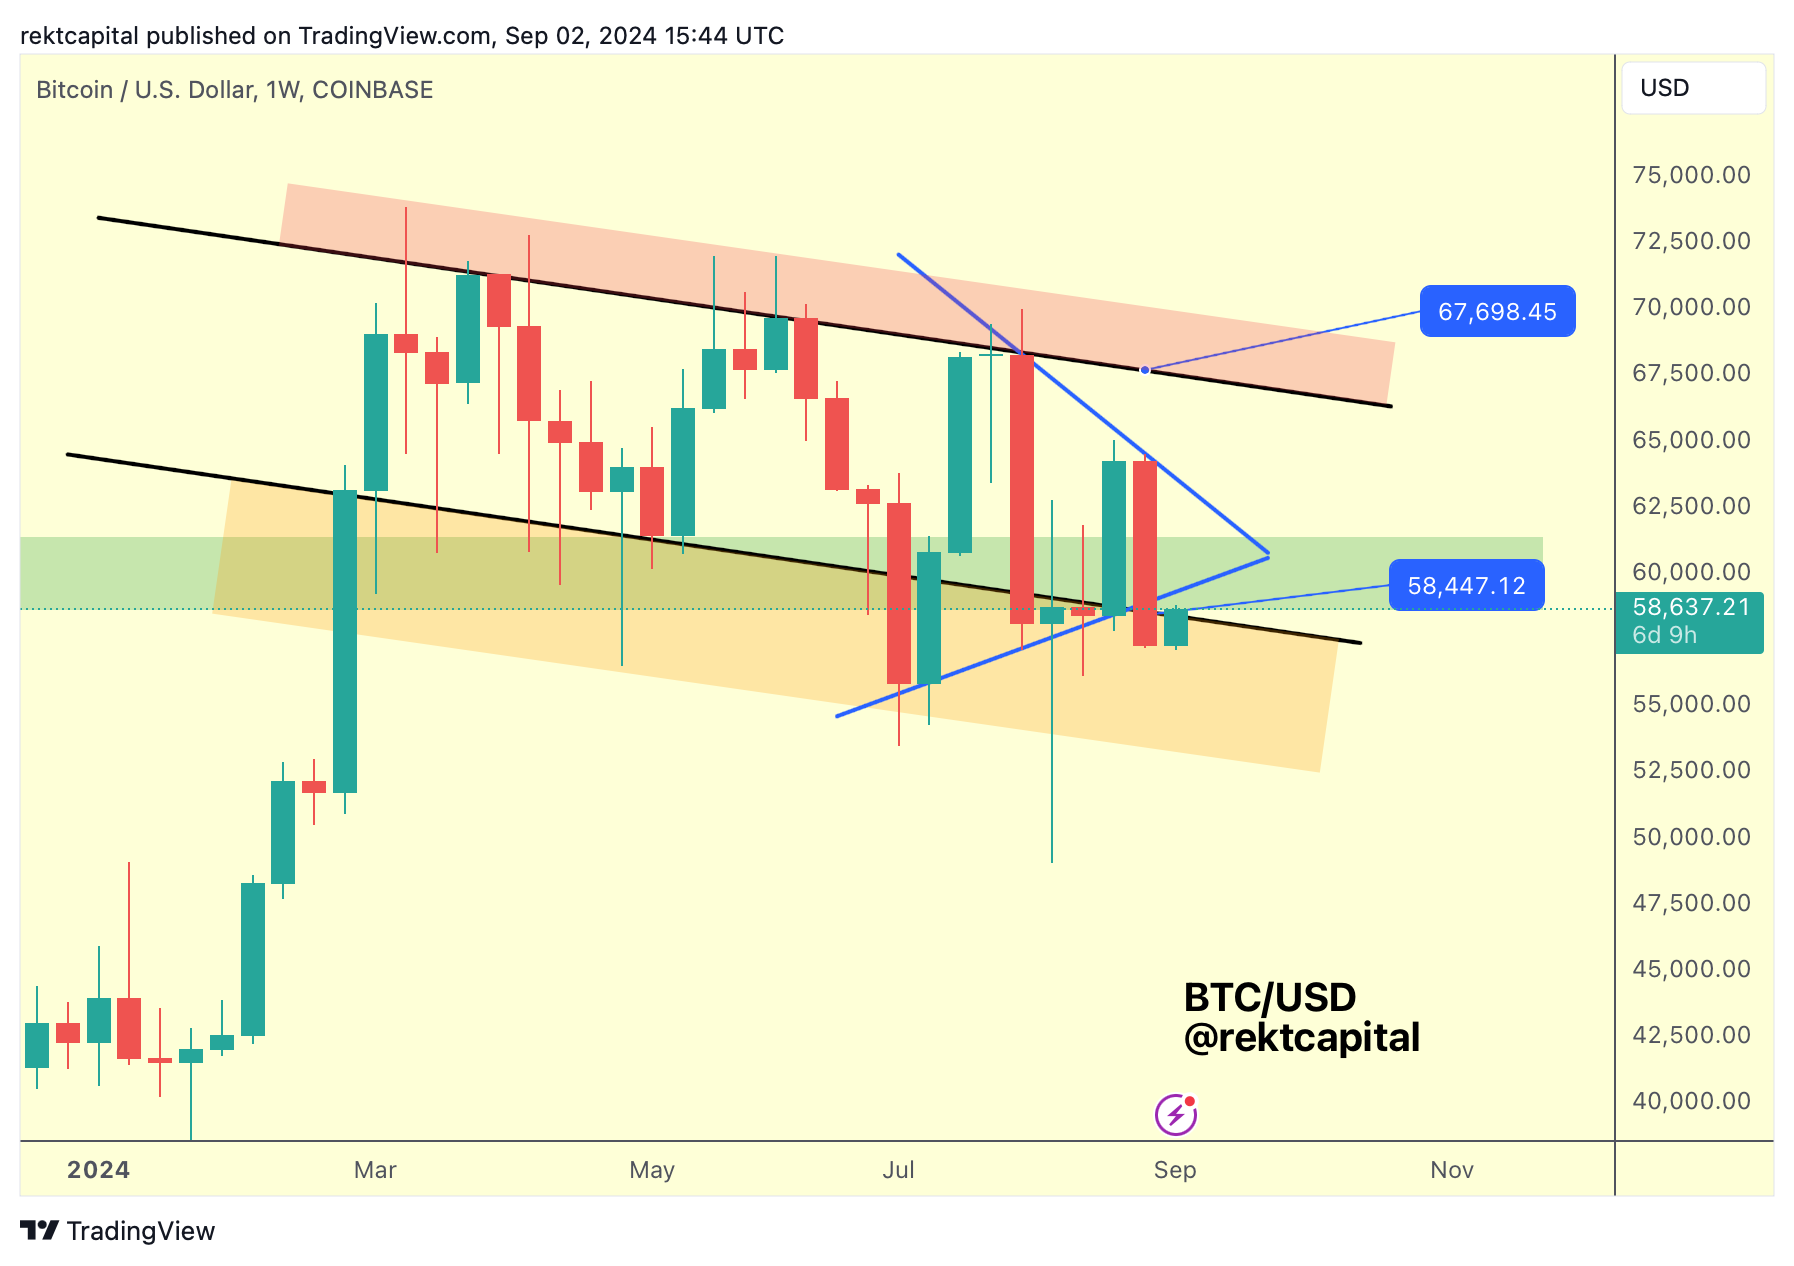
Bitcoin needed to Weekly Candle Close above ~$58450 in order to successfully retest the Channel Bottom (black) as support.
However, unfortunately for BTC, price Weekly Closed below the Channel.
In fact, not only did BTC Weekly Close below the black Downtrending Channel but it also Weekly Closed below the multi-week Higher Low (blue) dating to July.
More, BTC Weekly Closed below the candle-bodied lows set throughout August, potentially setting Bitcoin's first Weekly Lower Low (orange):
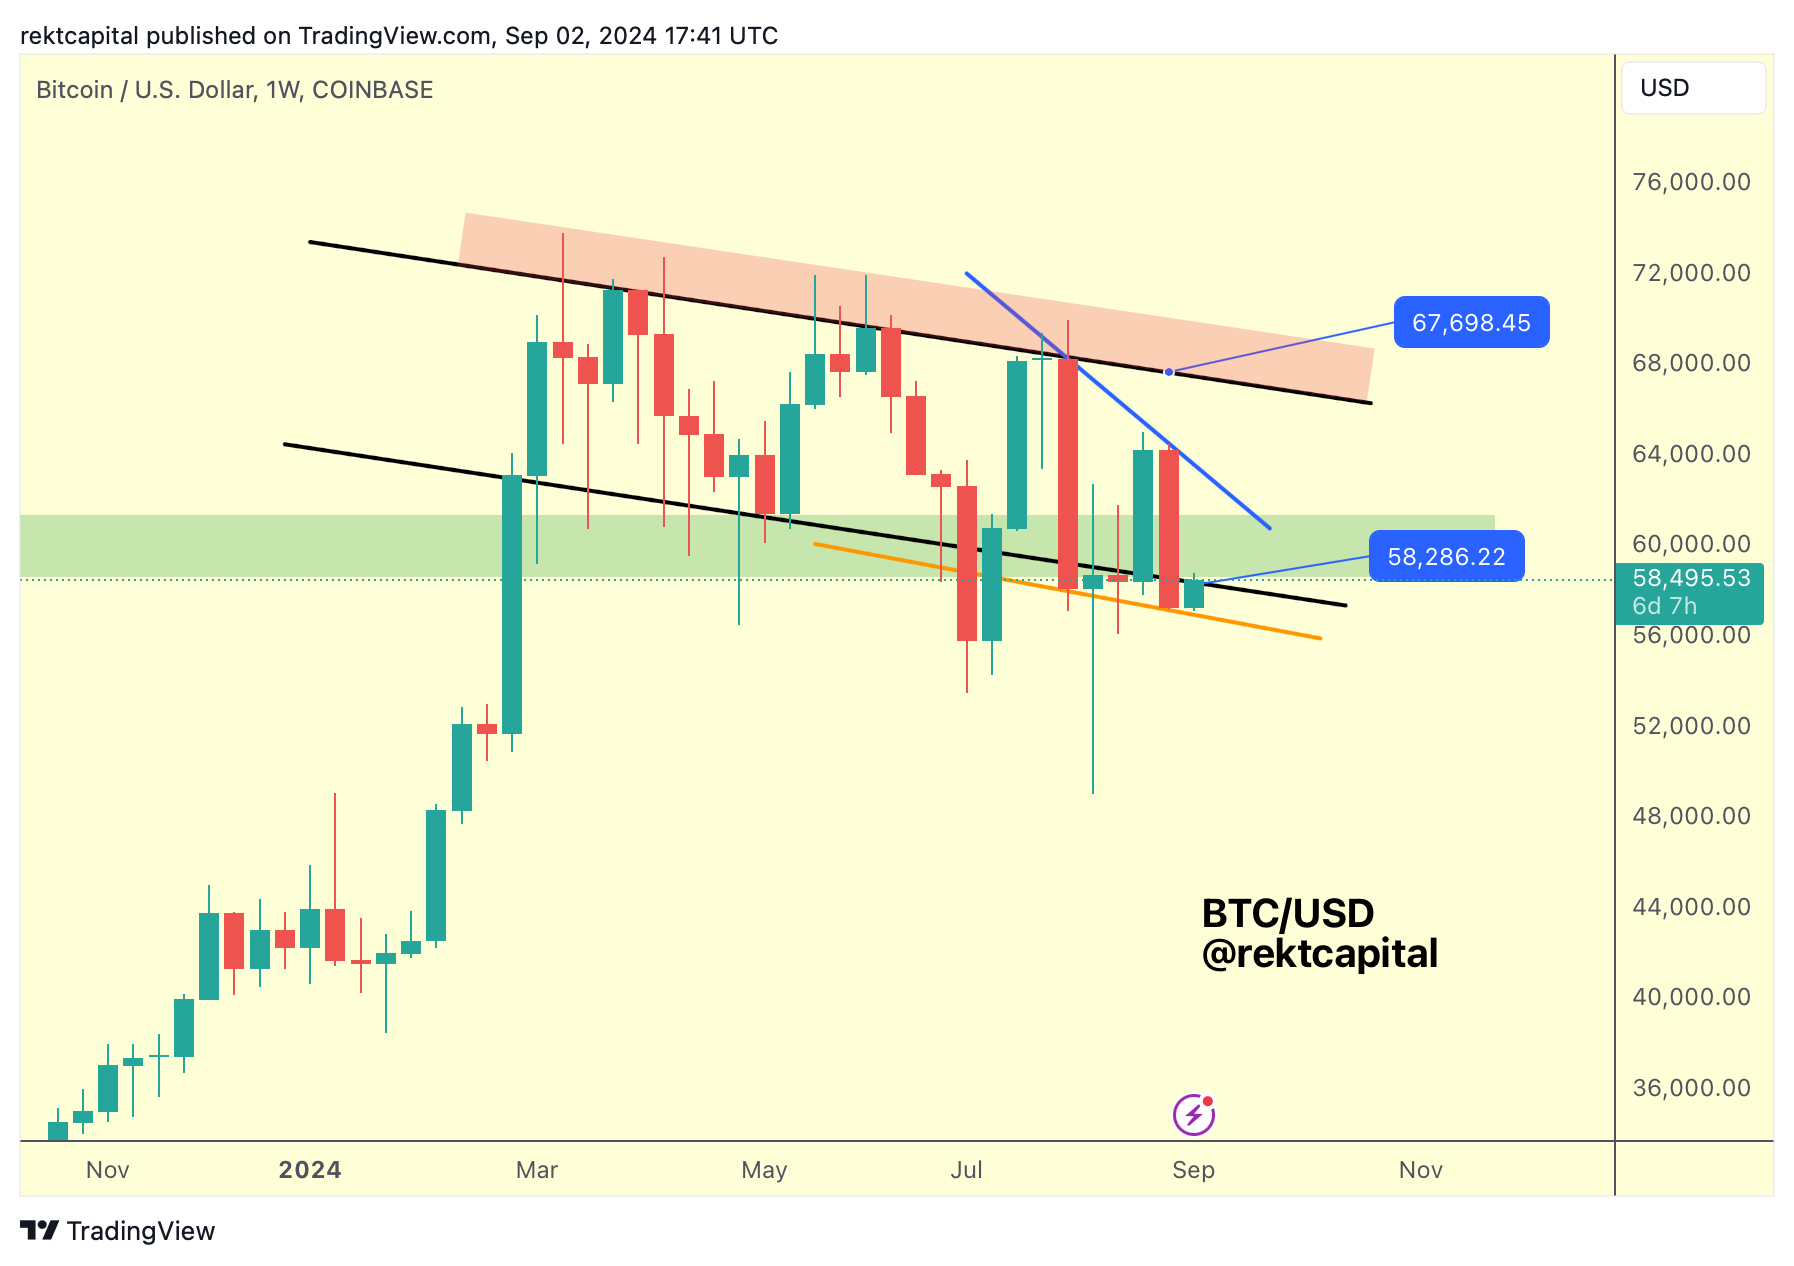
But Bitcoin has been in this position before; losing the black Channel Bottom as support, seemingly turning it into resistance, only to break beyond it.
Bitcoin needs to Weekly Close above ~$58300 this week if it is to reclaim the Channel Bottom as support and/or press above this level and turn it into support during the week:
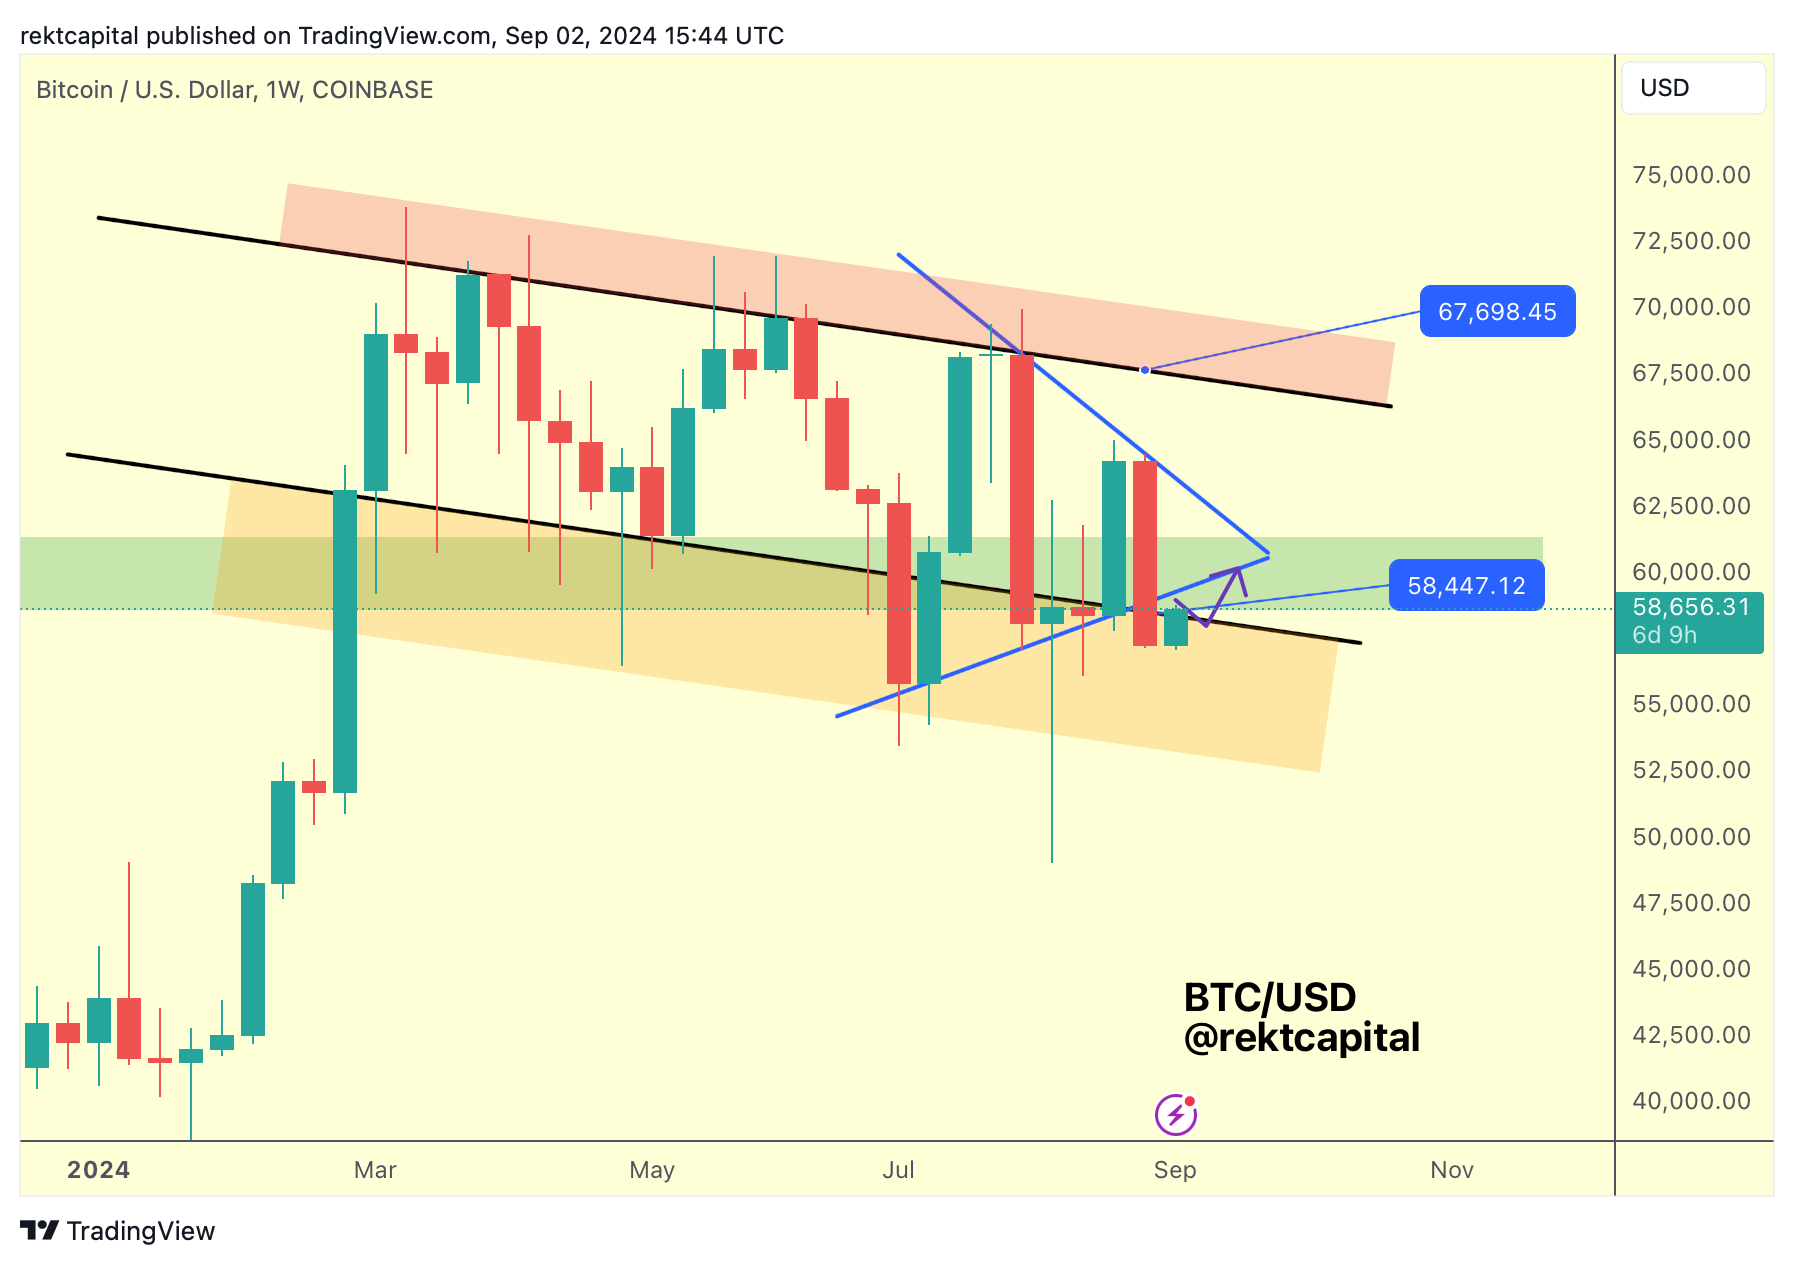
It may seem like things are getting complicated for Bitcoin but price has been repeating itself over the past few weeks with similar Weekly Closes and moves.
This is best evidenced on the Weekly ReAccumulation Range chart:
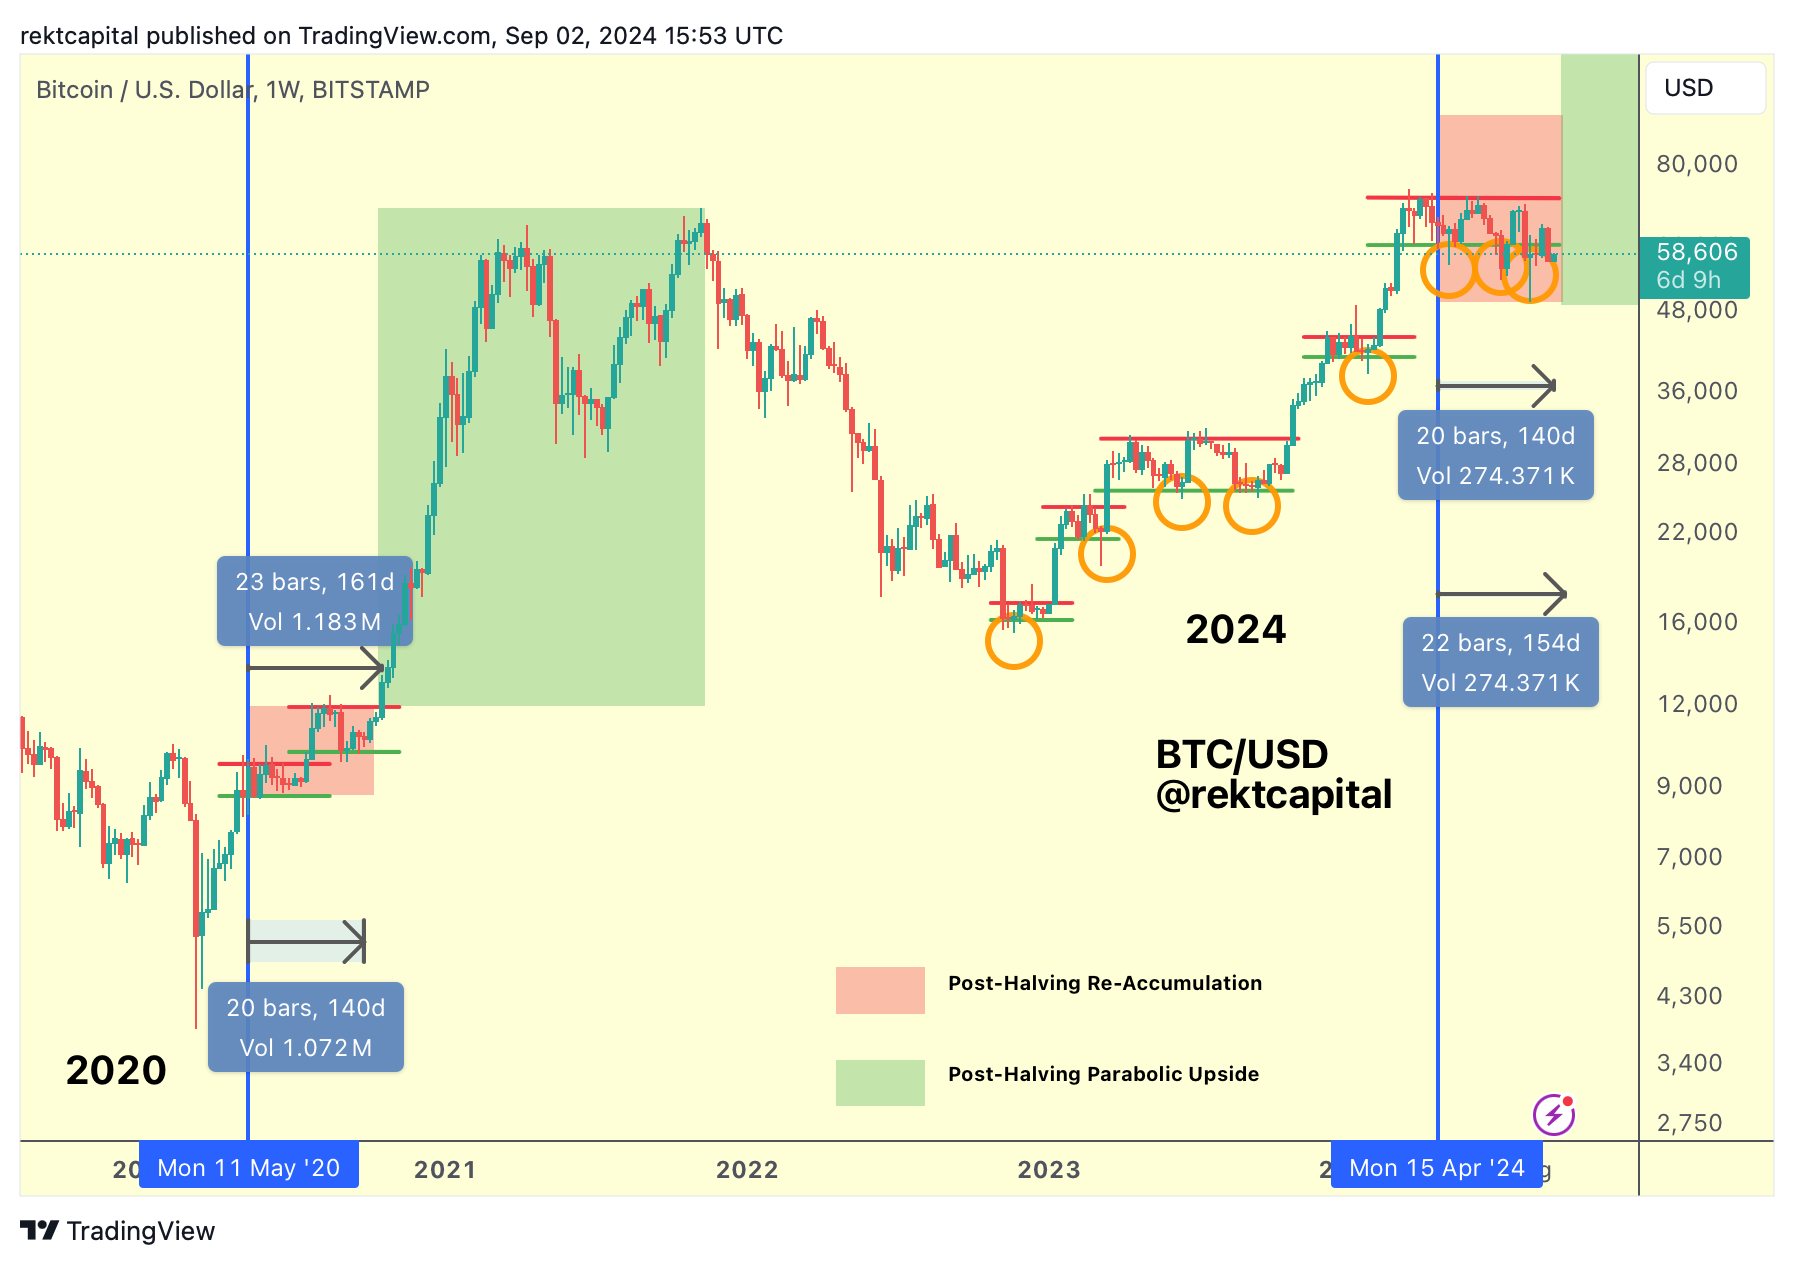
Bitcoin needs to Weekly Close above $60600 to return to normal consolidation within the Weekly ReAccumulation Range but price has continuously struggled to do that and has registered a fair amount of Weekly Closes below the ReAccumulation Range already.
But the point to note is that the Range Low of $60600 isn't acting as a strong resistance.
Purely historically speaking, BTC tends to breakout 150-160 days after the Halving.
Bitcoin is officially some 140 days after the Halving, which suggests that price should be breaking out in the next two or three weeks.
But for BTC to set itself up in the right direction, it would need to reclaim $60600 as support first and then break the series of Lower Highs that are evident on the black Downtrending Channel to revisit the Range Highs of $71500 (red).