Bitcoin - The 6 Week Retest
Can Bitcoin finally break into Price Discovery?
Welcome to the Rekt Capital Newsletter, a resource for investors who want to better navigate the crypto markets with the help of cutting-edge crypto research and unbiased market analysis
The Post-Breakout Retest Is Successful
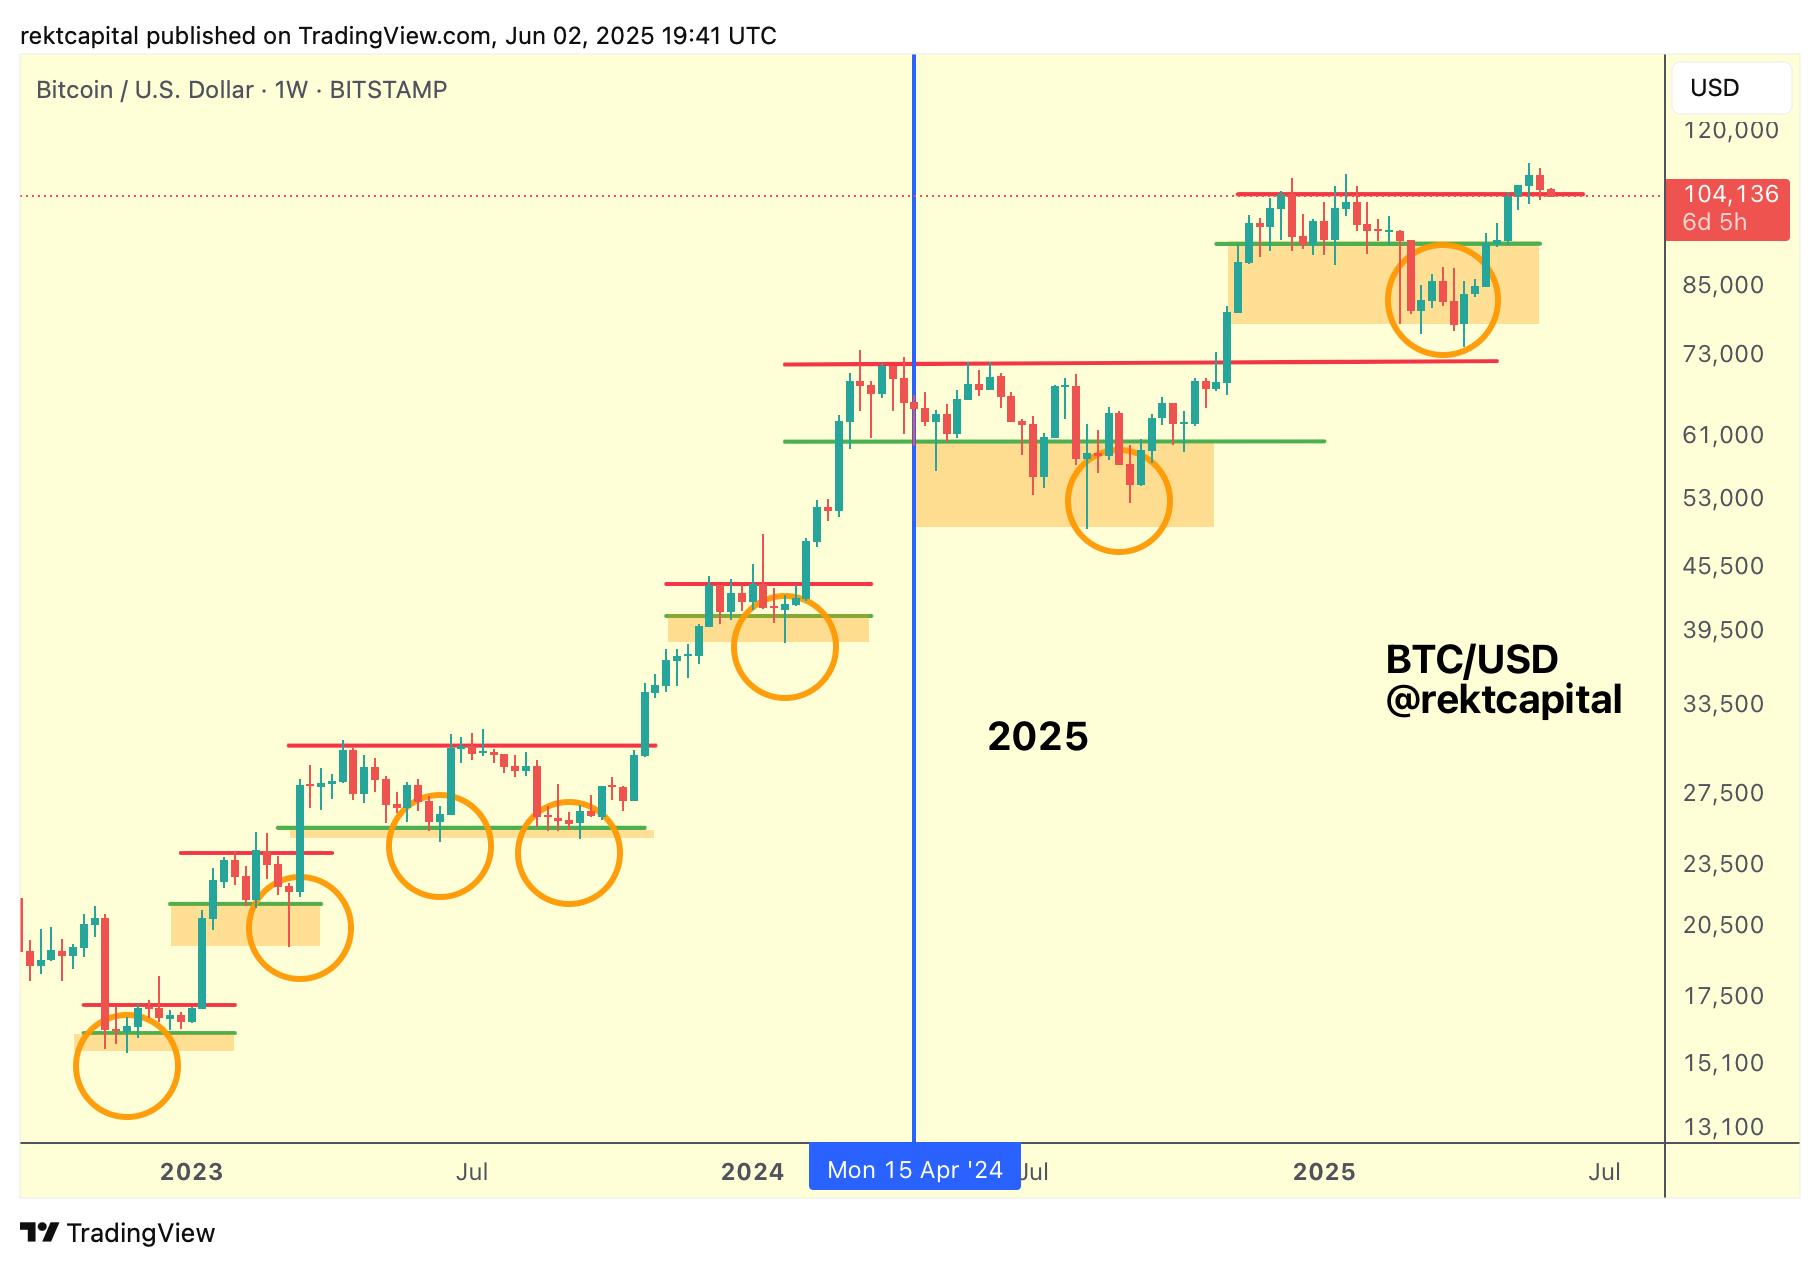
Over the past several weeks now, we've been talking about how Bitcoin has broken out from its ReAccumulation Range and how price has been retesting the old Range High resistance as support for the past 6 weeks now.
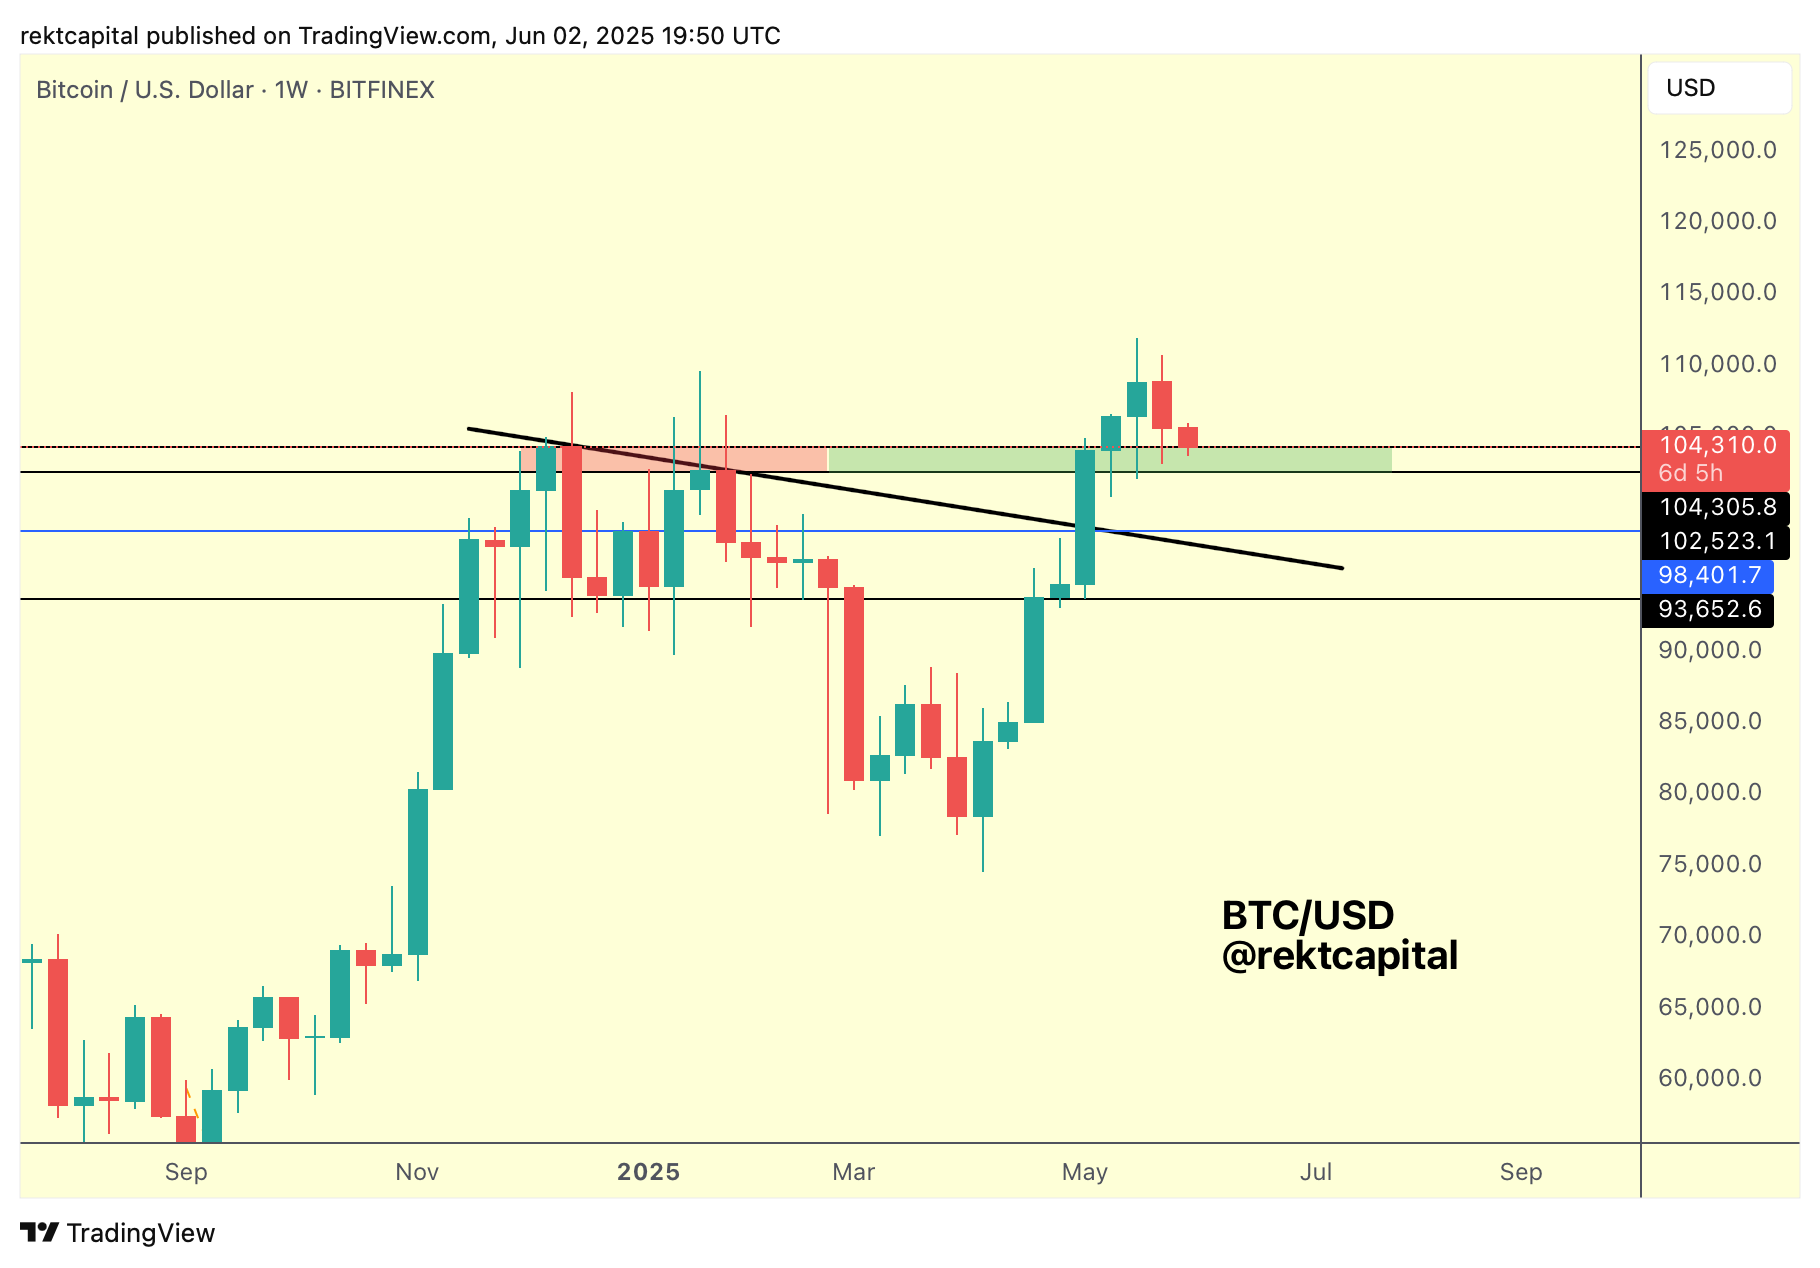
Here's a chart from early June:
And here's today's update:
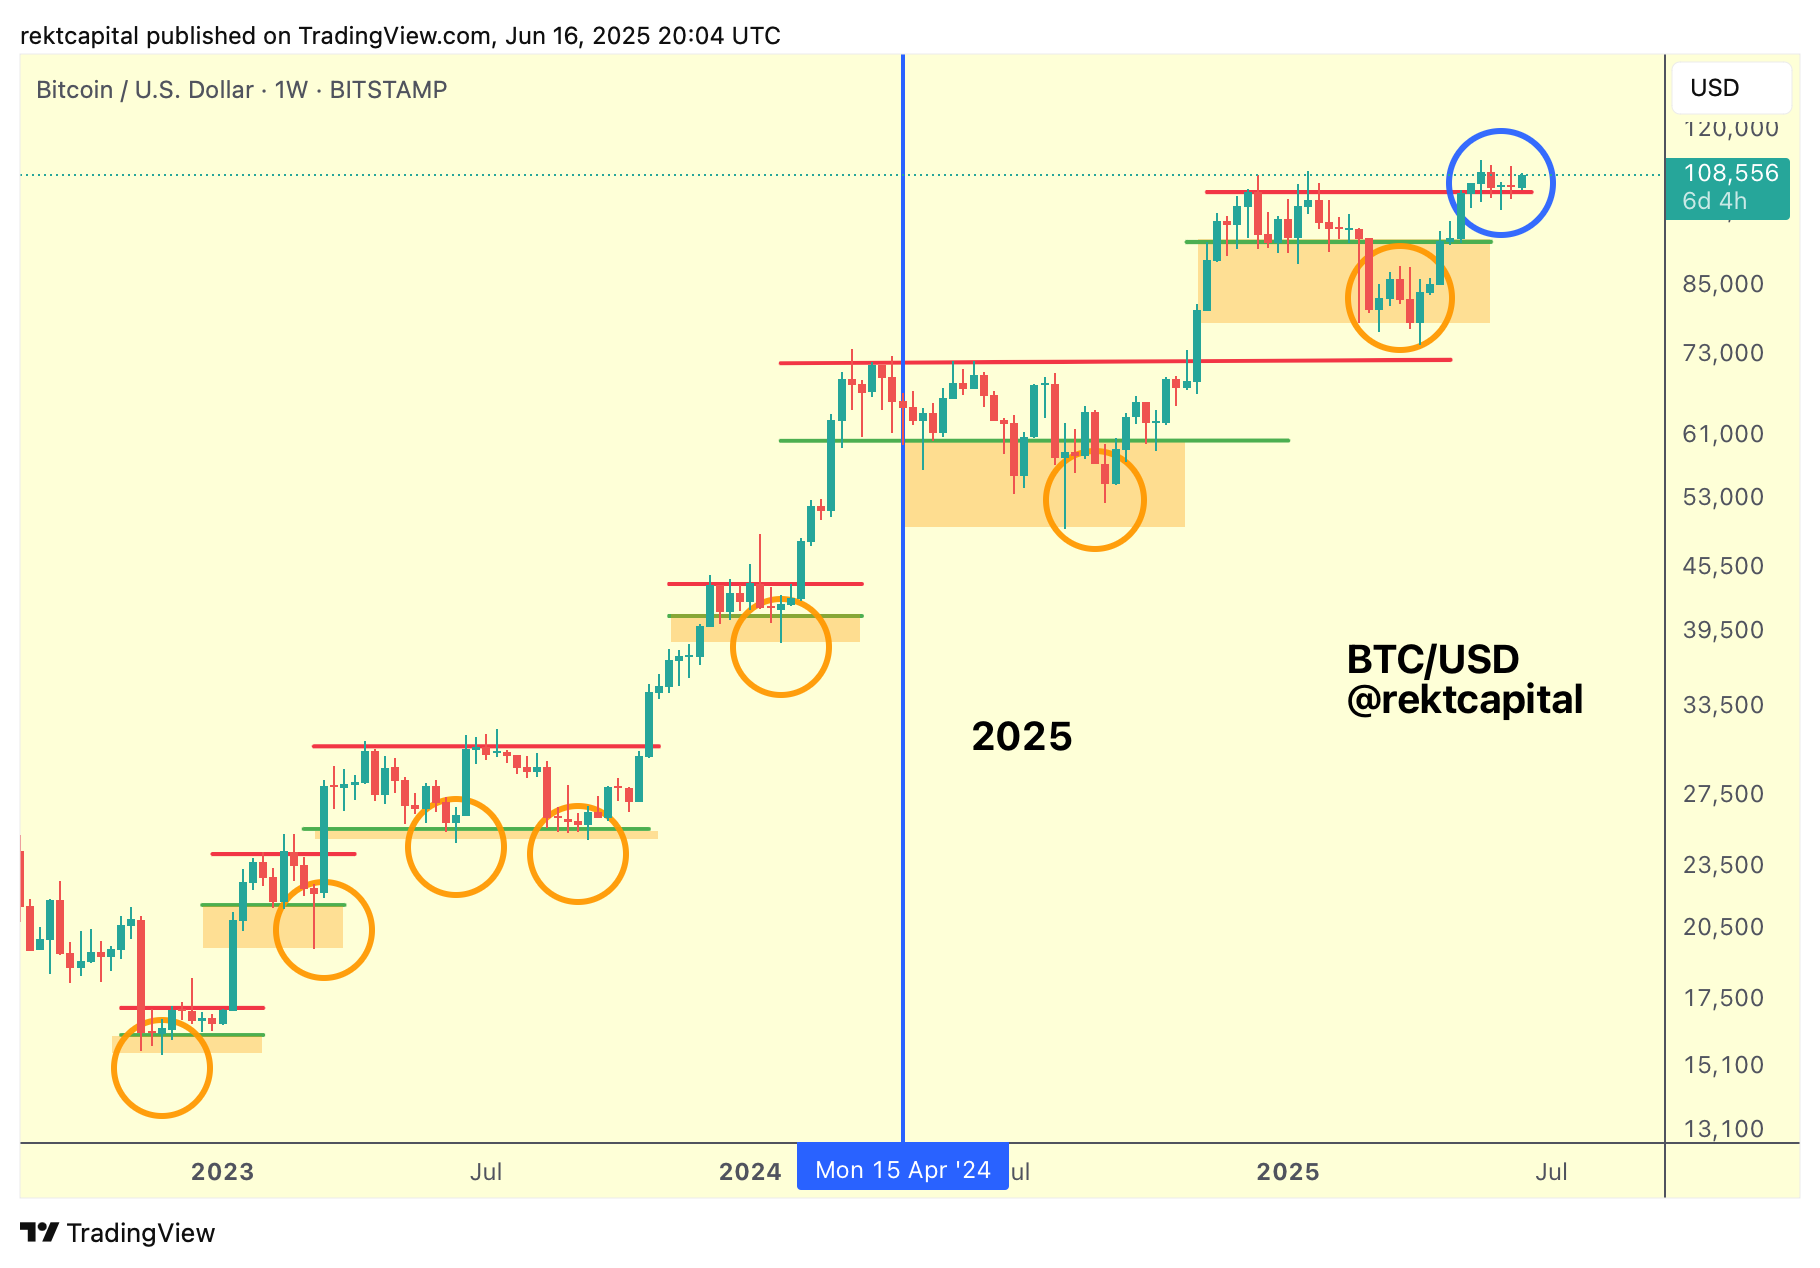
The retest continues and Bitcoin has entered its 6th week of retesting with the dawn of this new week.
The $104400 Range High is firmly acting as support and it has been this way for weeks now.
It's difficult to talk about lower prices until the $104400 level breaks down but we've seen plenty of discourse on CryptoTwitter on lower prices despite prolonged price stability at these highs.
More, it's felt like price can lose the $104400 level at any moment over the past 6 weeks but it really is all about the Weekly Candle Closes; as long as price Weekly Closes above $104400, the wicking is just noise.
Granted, Bitcoin has downside wicked many a time over the past few weeks, but the Weekly Closes have always occurred above $104400.
But one can't help notice how many investors have been exhausted by this Bitcoin pullback/consolidation.
But if we really hone into the details on this current period in the market, Bitcoin has only seen a -10% dip:
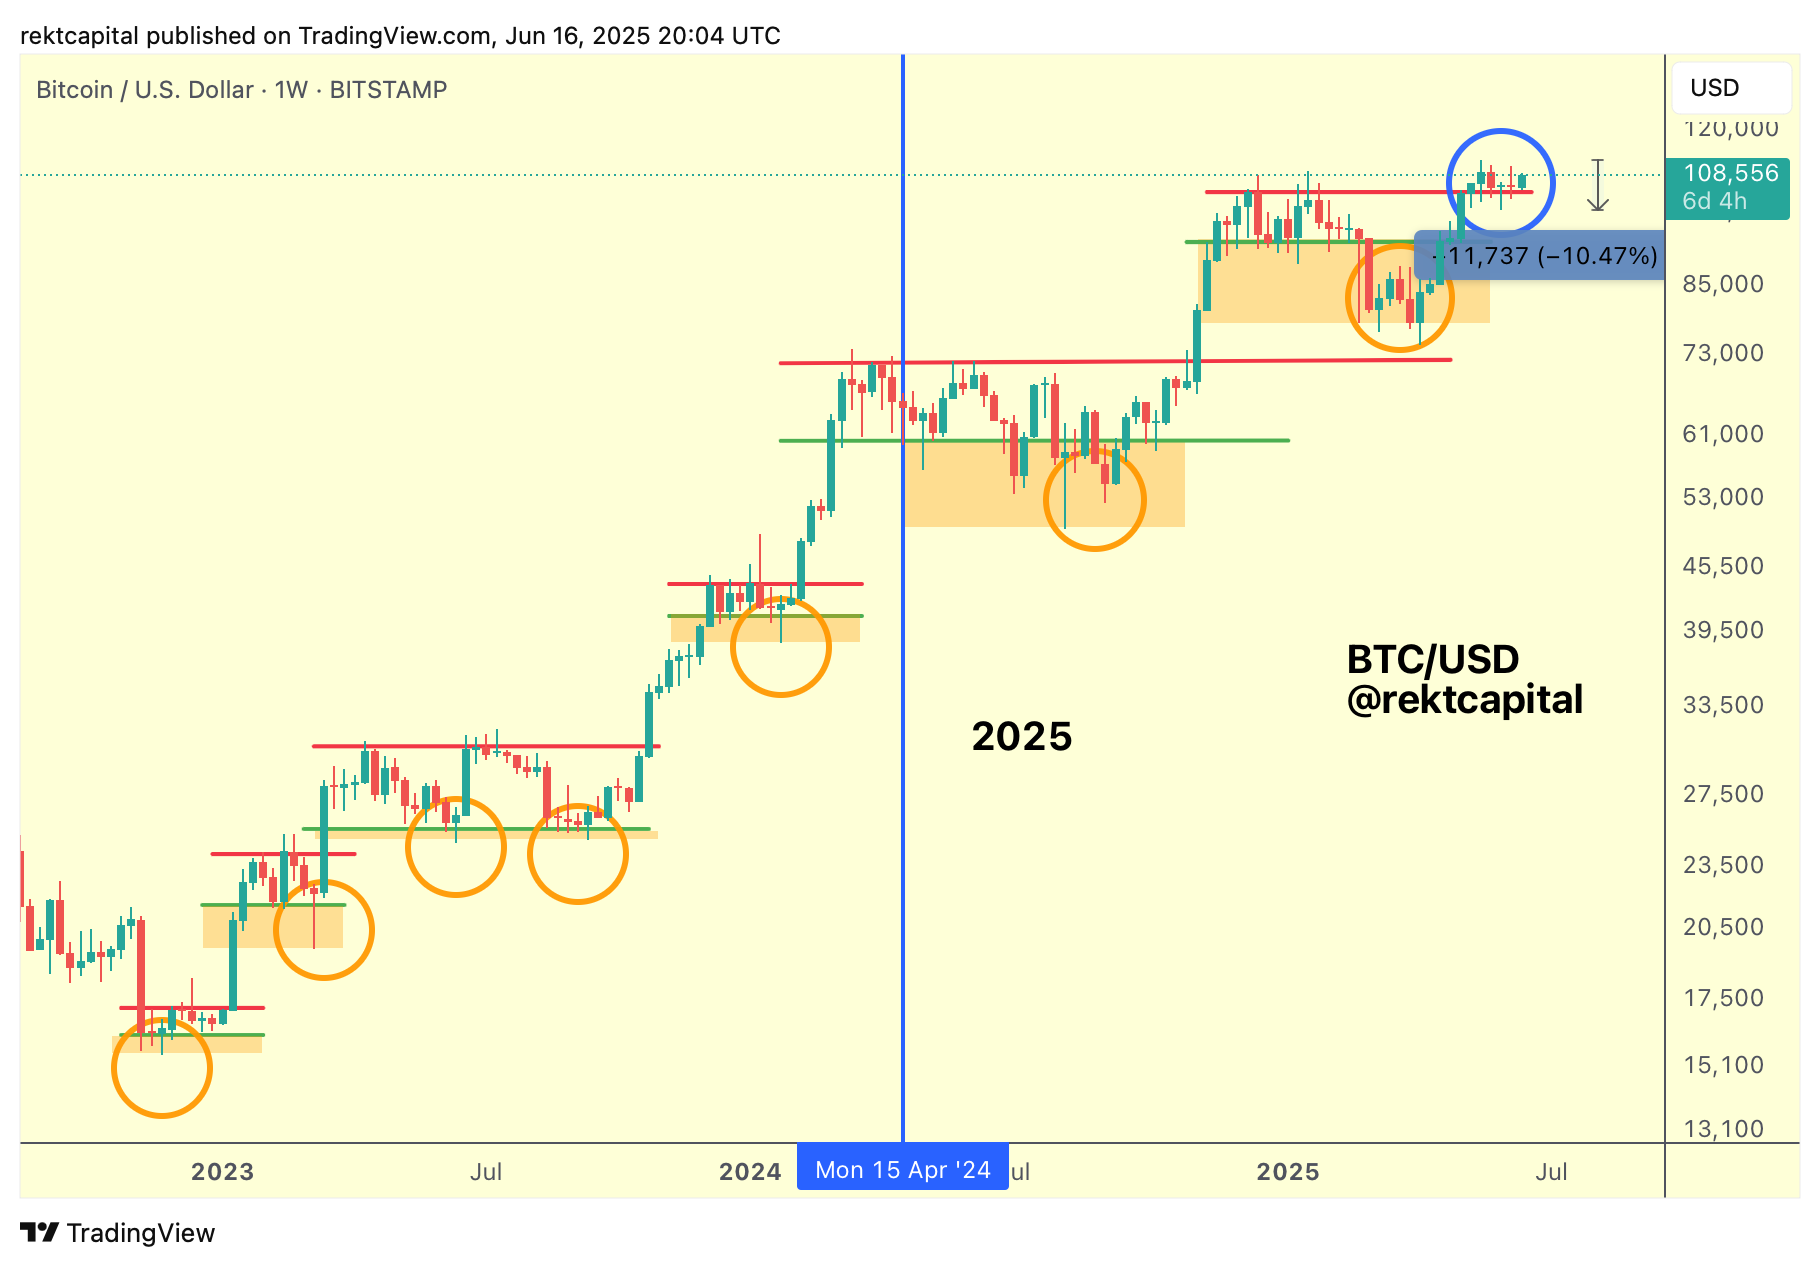
I've had comment under my tweets talk about how brutal this period in the market has been but it's not necessarily been a price-based capitulation, instead rather a time-based capitulation.
But the gist is this: as long as BTC holds $104400, then it is positioned for upside over time.
Bitcoin is trying to transition into Price Discovery Uptrend 2 and it is taking much longer that usual; generally, this cycle has become famous for extended retesting periods, downside deviations, faking out participants in anyway feasible.
Despite the noise, it's all about $104400.
Key Weekly Levels
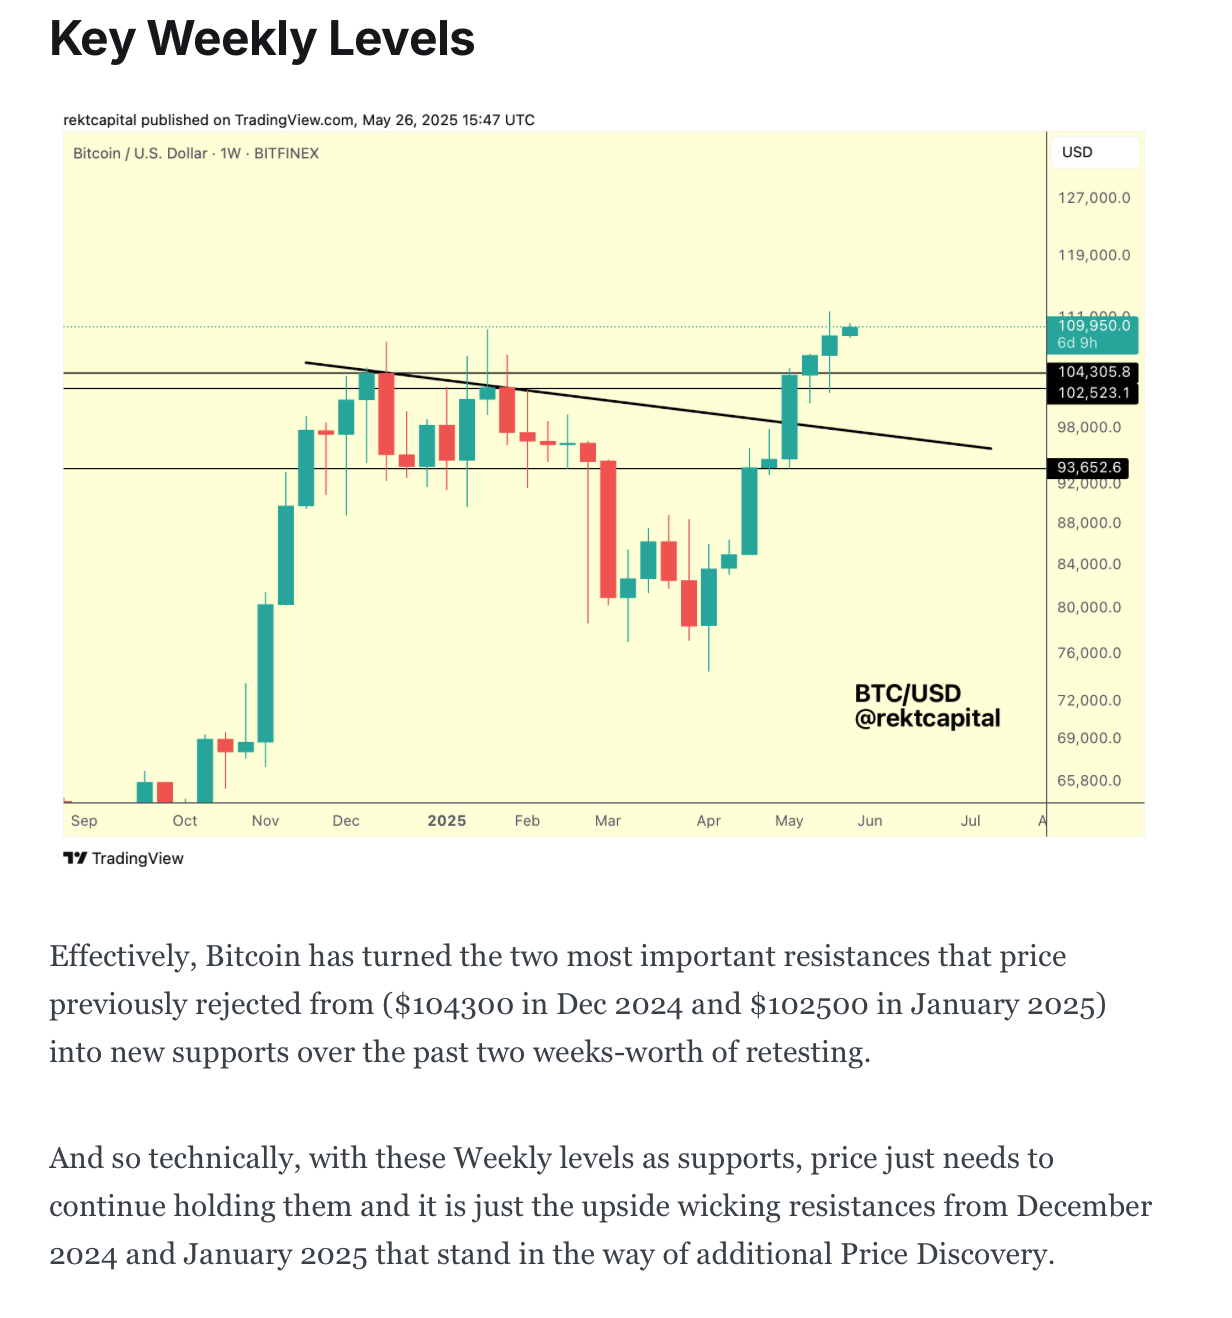
This past May, we spoke about key Weekly levels:
And earlier this June price was indeed retesting this region:
Here's today's update:
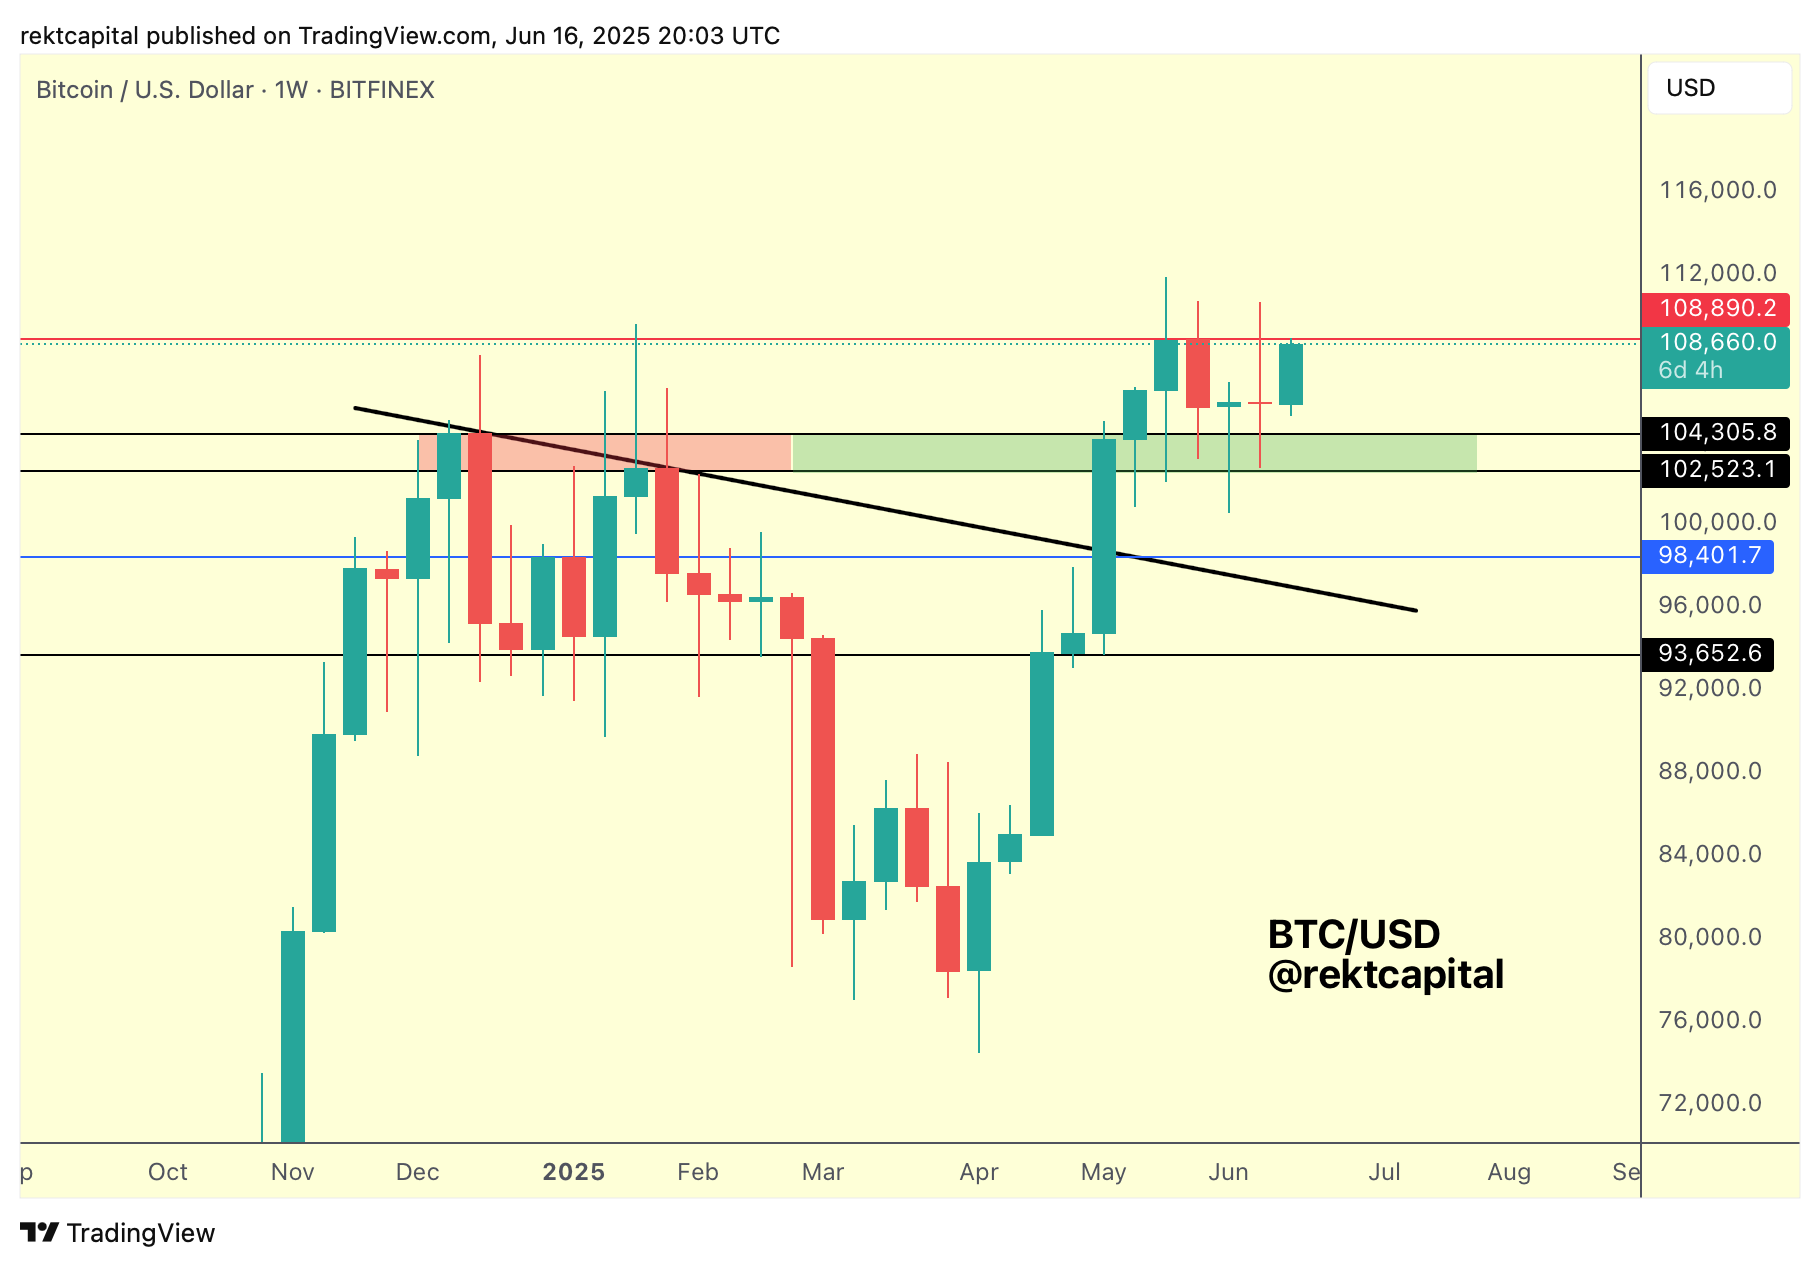
Bitcoin continues to successfully retest the old resistance (red) into new support.
It doesn't get any simpler than that. It's always best to hone in on the foundations of price; too often people get lost in the complexities that have generally been brought about by over-emotionality in response to the noise.
In recent weeks, Bitcoin has developed a Diamond-Shaped candlestick formation against this green area of support.
That is, Lower Lows in the downside wicks that transition into Higher Lows in the downside wicks.
And if we further build out this view, then the green area is a support and the final major resistance of $108890 (red) is the Range High resistance.
And as long as this resistance (red) isn't rejecting price too much, then maybe it's getting weaker over time.
After all, the first rejection was deeper than the second:
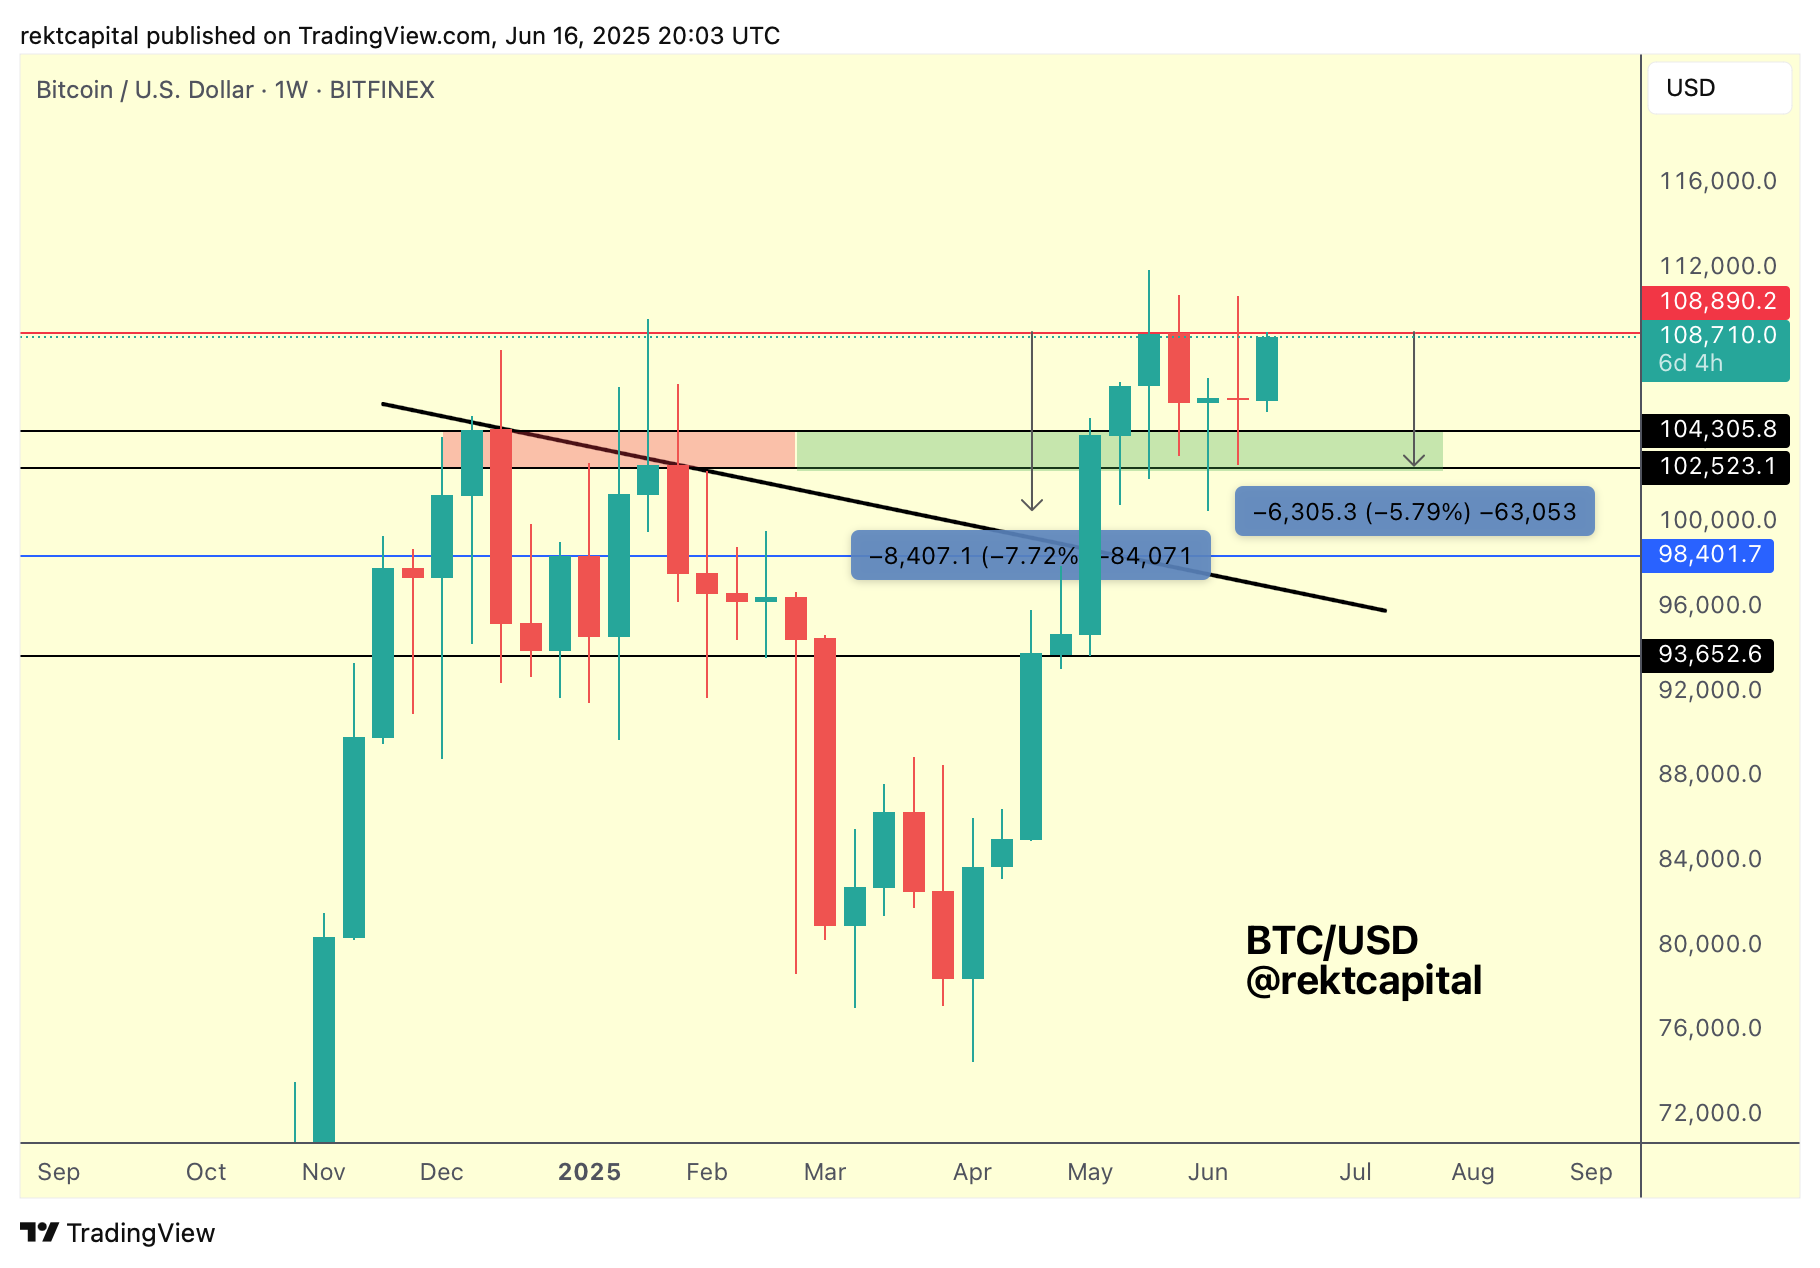
The first rejection produced a -7.72% dip and the second dip was -5.79% deep.
How much more can the final major Weekly resistance resist price before caving in and allowing it to move upwards, full throttle to new All Time Highs?