Bitcoin - Setting the Stage for Price Discovery 3
What to expect going forward
Welcome to the Rekt Capital Newsletter, a resource for investors who want to better navigate the crypto markets with the help of cutting-edge crypto research and unbiased market analysis.
Bitcoin Breaking Down?
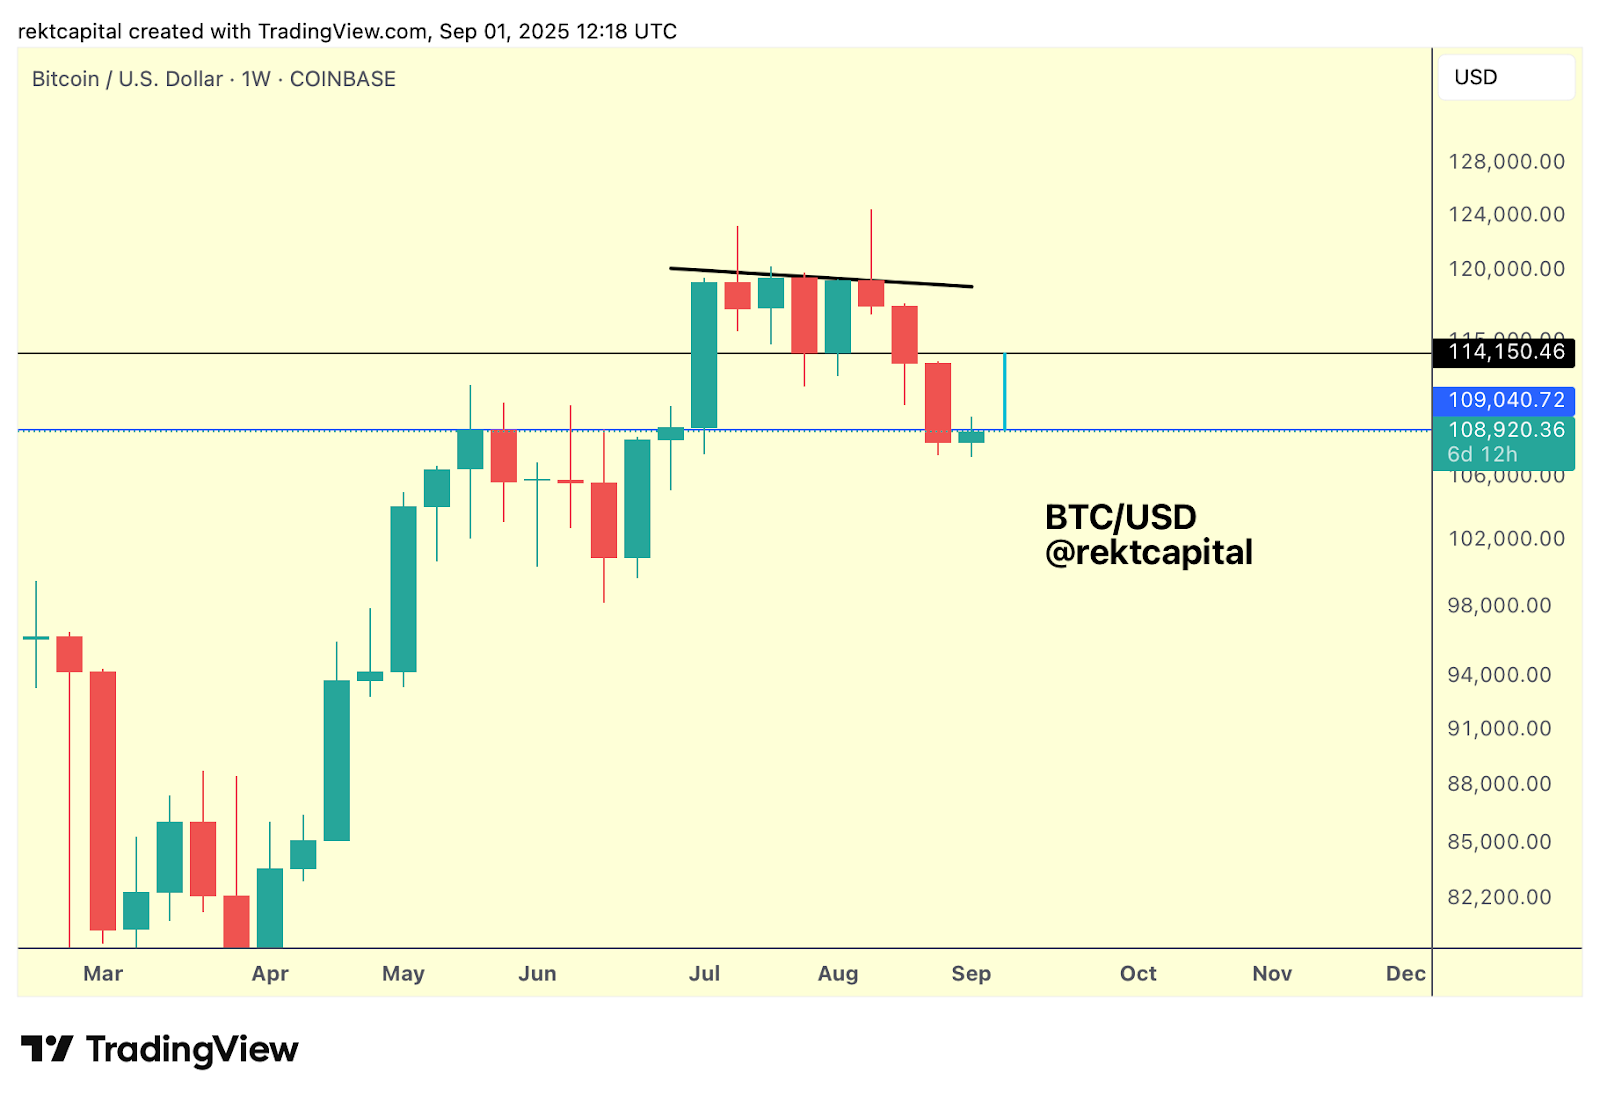
Bitcoin has recently produced a Weekly Close below ~$109,000.
Earlier this year, this level acted as the final Weekly resistance before new All Time Highs, so losing it technically registers as the first step of bearish confirmation.
Bearish confirmation however is a three-step process:
- Step one is a Weekly Close below the level.
- Step two is rejection (bearish retesting), confirming it as new resistance.
- Step three is downside continuation following from that rejection.
So far, only the first step is in.
Continued resistance-checking at ~$109,000 would increase the probability of step two materialising, bringing the market closer to a confirmed breakdown.
But at this stage, that scenario remains incomplete and unconfirmed.
At the same time, this is still the very beginning of the Weekly Candle.
Price has already upside-wicked beyond $109,000, which keeps the possibility alive that the level could still be reclaimed as support this week.
So the picture is not yet resolved.
One step is complete.
But the remaining two steps have not been completed and the market now has to decide:
Reclaim $109k? Or reject into a confirmed breakdown sequence.
The Monthly Perspective
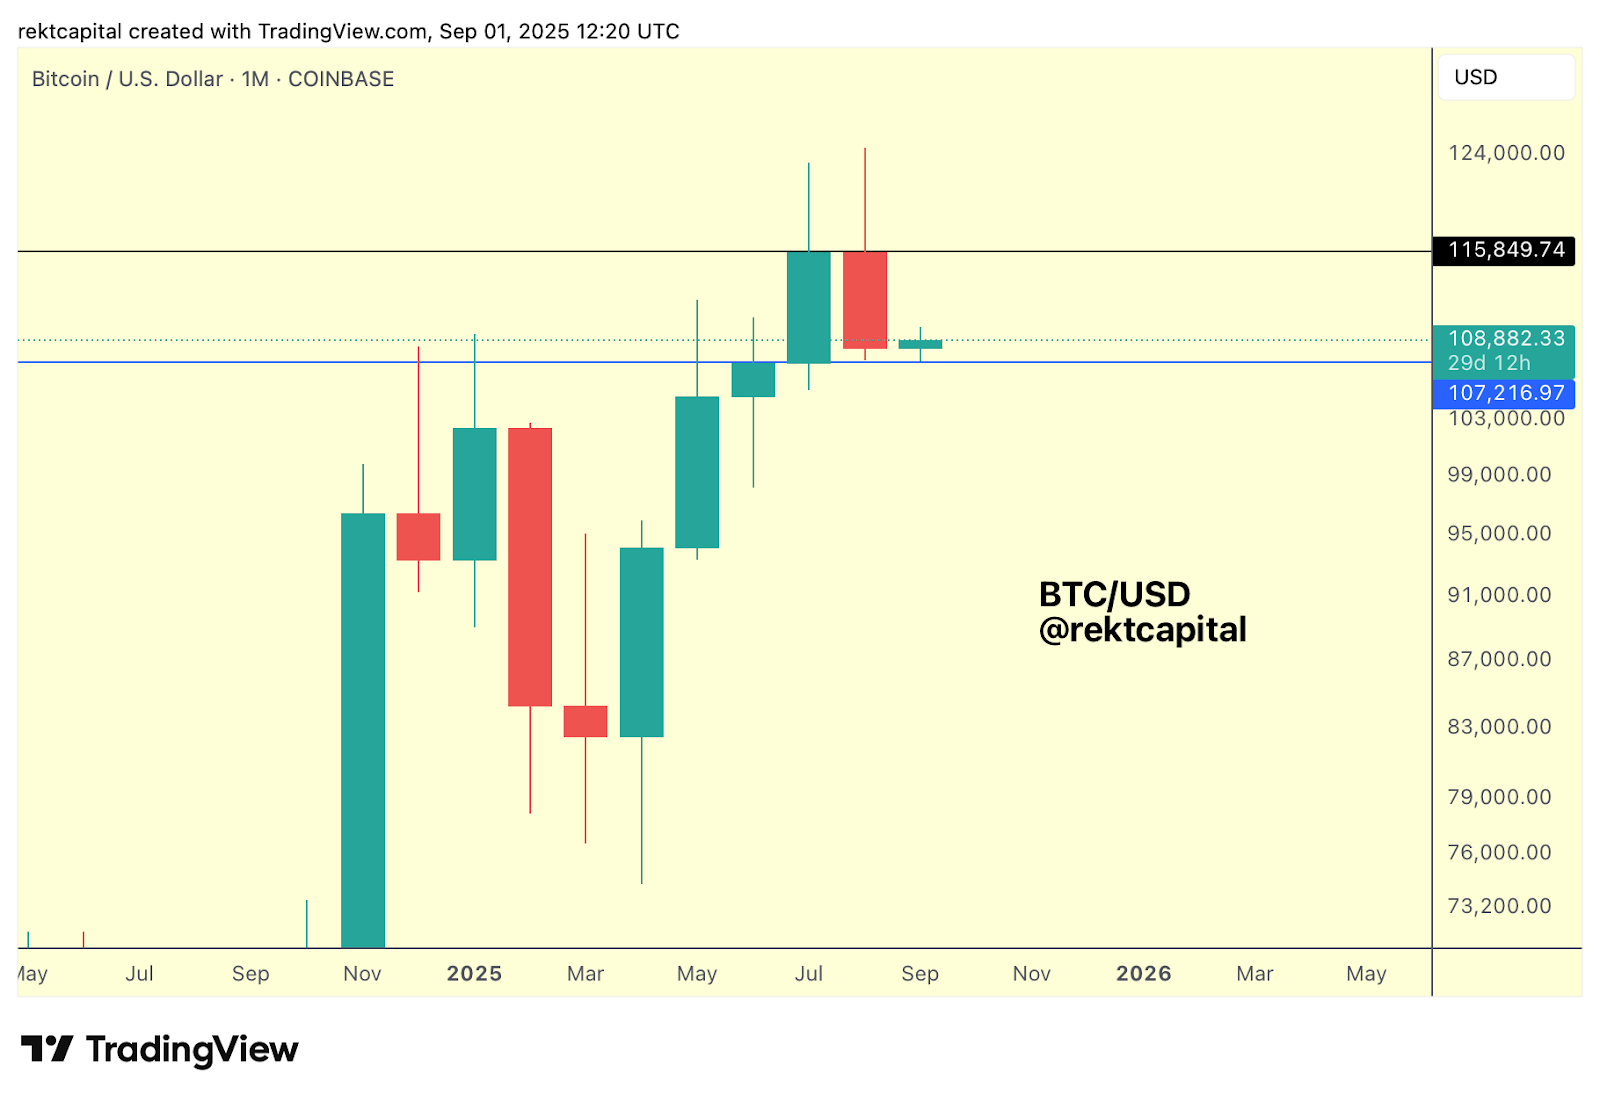
While the Weekly timeframe is showing early signs of weakness, the Monthly chart tells a different story.
Here, the new Monthly Close has kept Bitcoin firmly inside its Macro Range of $107.2k-116k (blue-black).
And Monthly candles in this cycle have often produced long downside wicks.
That volatility is part and parcel of the cycle, with deep retests frequently occurring before trend continuation.
In fact, the most recent Monthly Candle stands out for how little it had downside wicked, one of the few non-volatile examples over the past several months. That makes the current period unusually calm by standards of recent history.
Even so, the Monthly Close has been secured above $107k, which marks the lower boundary of the Macro Range.
So despite Weekly pressure, the broader macro structure here is still intact.
But in the event of a volatile retest of the Monthly Range Low (and there have been many long downside wicks on the Monthly timeframe over the past several months), Bitcoin could easily contend with a cluster of higher timeframe demand levels which rest just below:
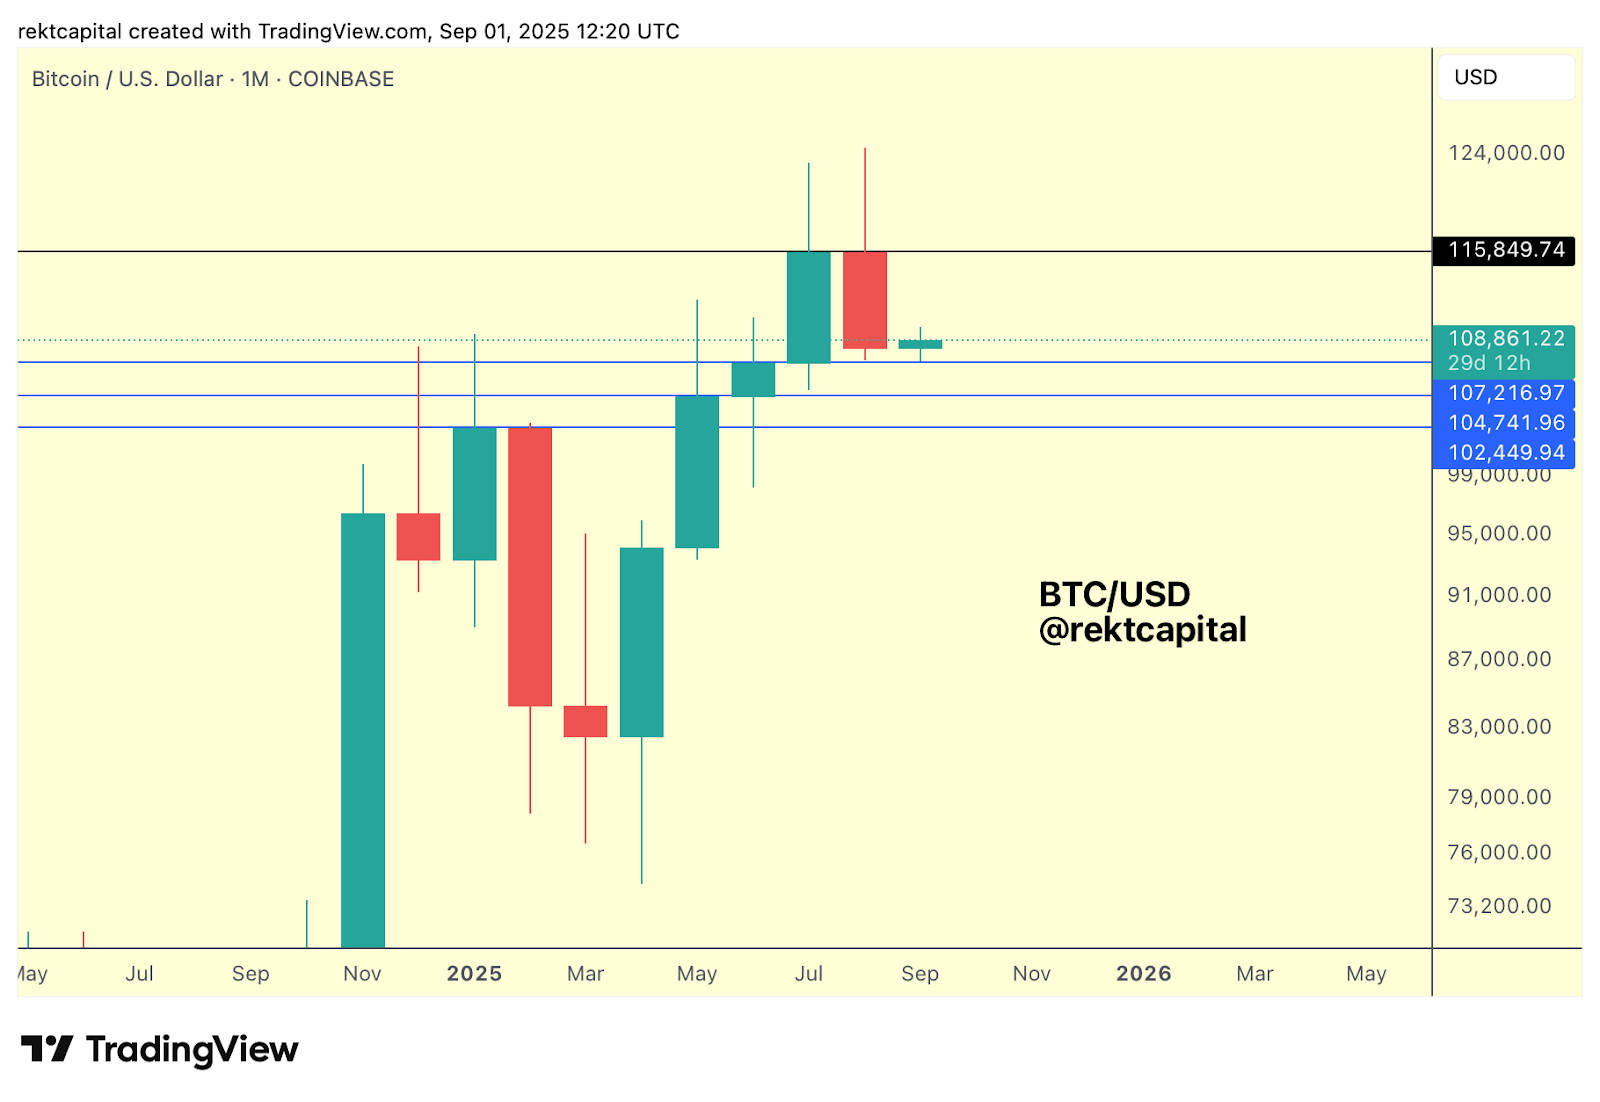
These include:
- $102.000
- $104.740,
- And of course the aforementioned current Range Low of $107,216.
All three of these levels have in recent months been retested as support.
In the event of heightened volatility, ~$104k could still be tagged on a wick. Deeper downside into $102,000 however would require a far more emotional market response to occur.
History shows however that wicks are inherently difficult to measure.
Sometimes they extend further than expected, even reaching psychological milestones such as $100k as was the case with prior hammer-shaped candles (e.g. June 2025).
Which raises the question: what sort of wick will form this time?
Volatile but standard retests could easily reach into the lower 100ks while still maintaining the broader Monthly Range structure.
And so if the Weekly timeframe confirms rejection from $107k and progresses bearish confirmation, that development could be the trigger for such a Monthly wick, and then the goal for price would be to then resynchronise with the Monthly; Range before the Monthly Close is in.