Bitcoin Roadmap For The Rest Of September
Here's what BTC needs to do to maintain bullish bias going forward
Welcome to the Rekt Capital newsletter, a resource for investors who want to better navigate the crypto markets with the help of cutting-edge crypto research and unbiased market analysis.
This edition of the Rekt Capital newsletter is brought to you by… Phemex

Crypto is a fast-paced market. Which is why you need a fast, responsive exchange to make the most of the volatility.
Phemex is a fast and secure derivatives trading platform which is three times faster than other margin/leverage exchanges.
Other noteworthy features? Spot trading with 0 fees on plenty of pairs. A trailing stop-loss feature. And 20% APY on USDT deposits.
But perhaps best of all - Phemex offers an exclusive $1100 bonus upon signup.
Get started with Phemex and claim your free $1100 bonus today:
Bitcoin - Macro Flagging Structure Update
Over the past several weeks in the Rekt Capital Newsletter, we’ve been looking into a wide-variety of perspectives on Bitcoin.
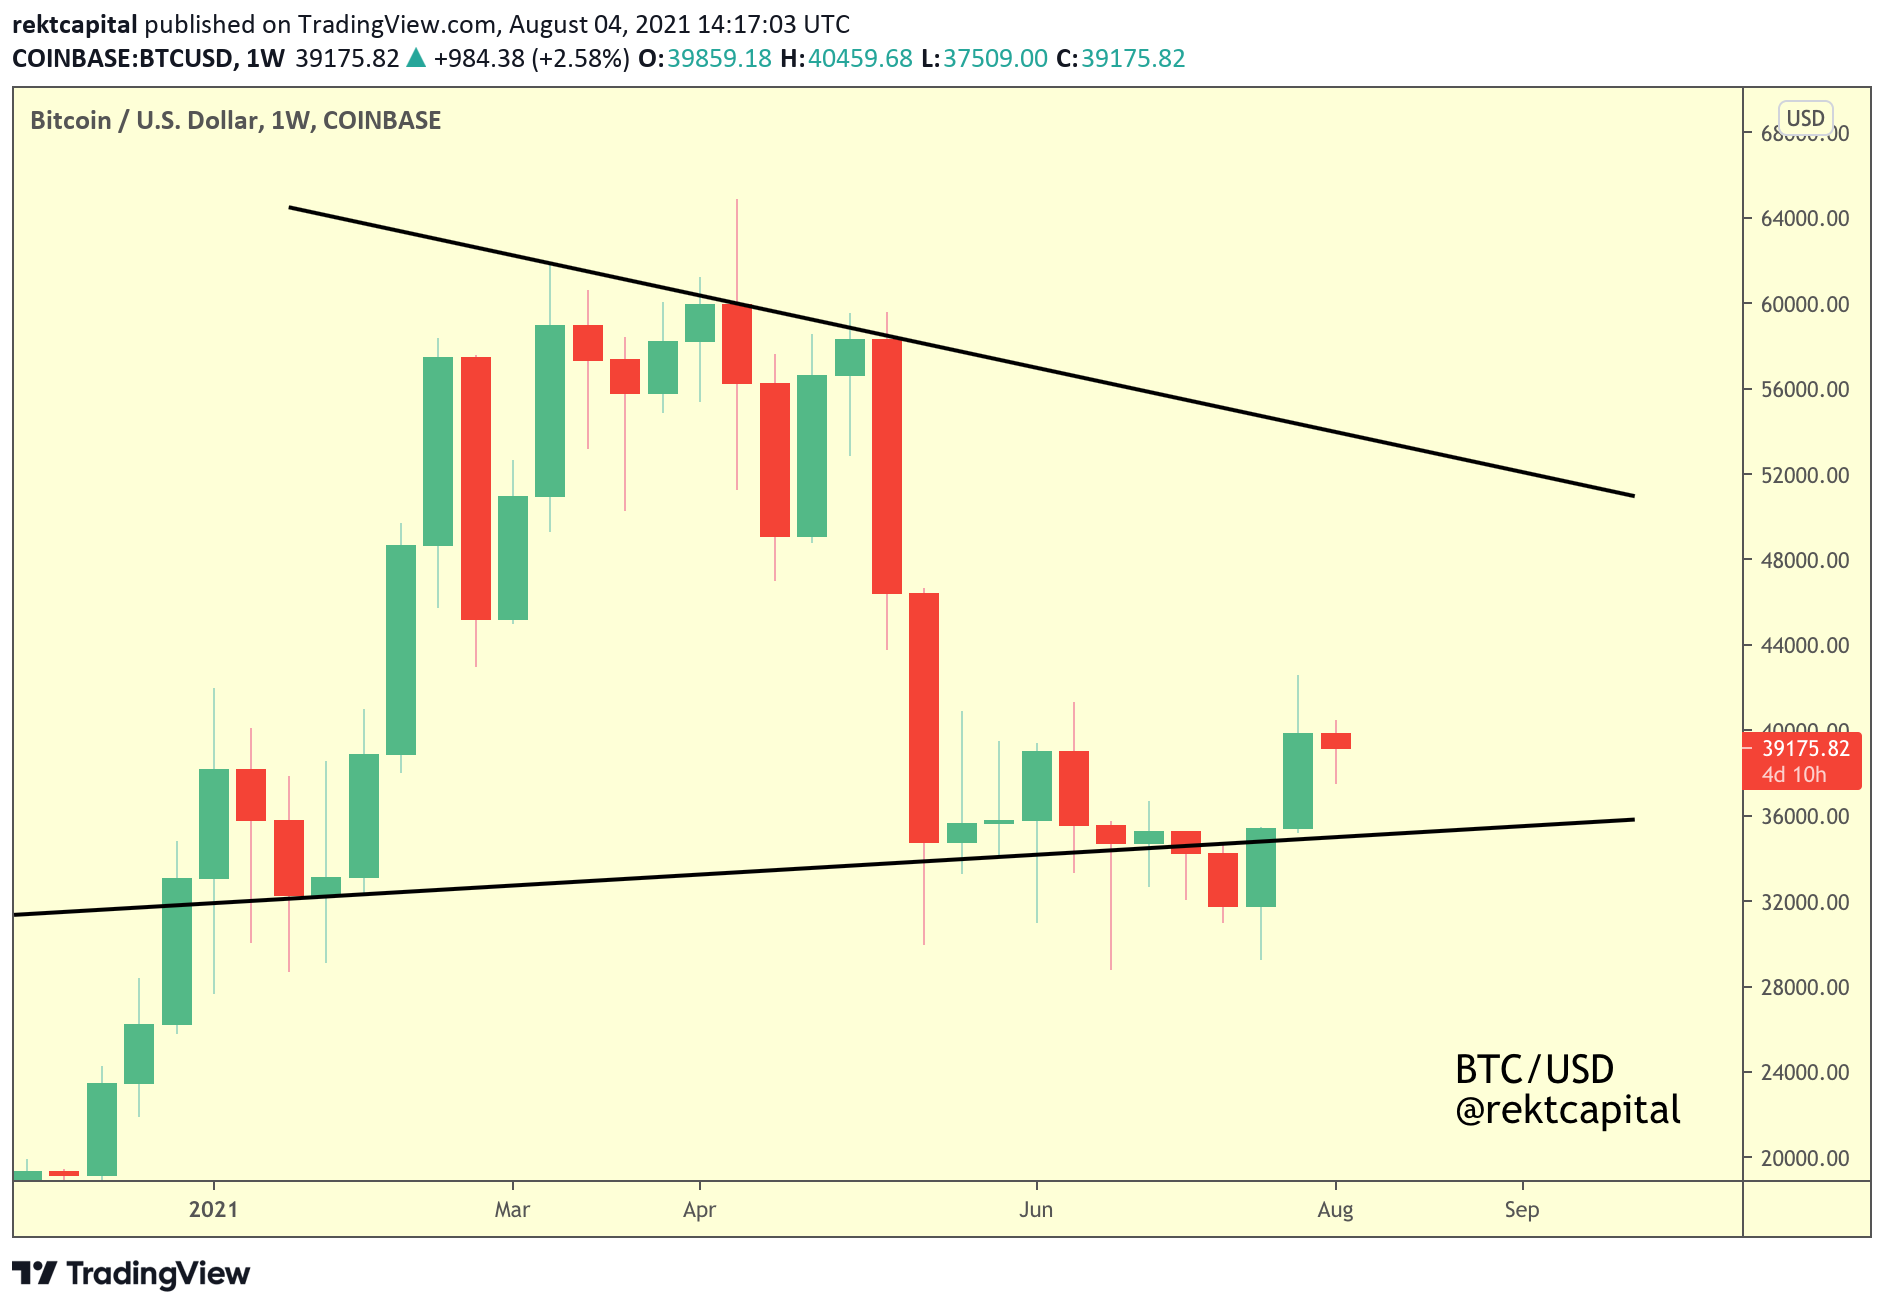
One of those views was the Macro Flagging Structure, first introduced back in early August:
Of course, since then Bitcoin has traversed the entirety of the Macro Flag:
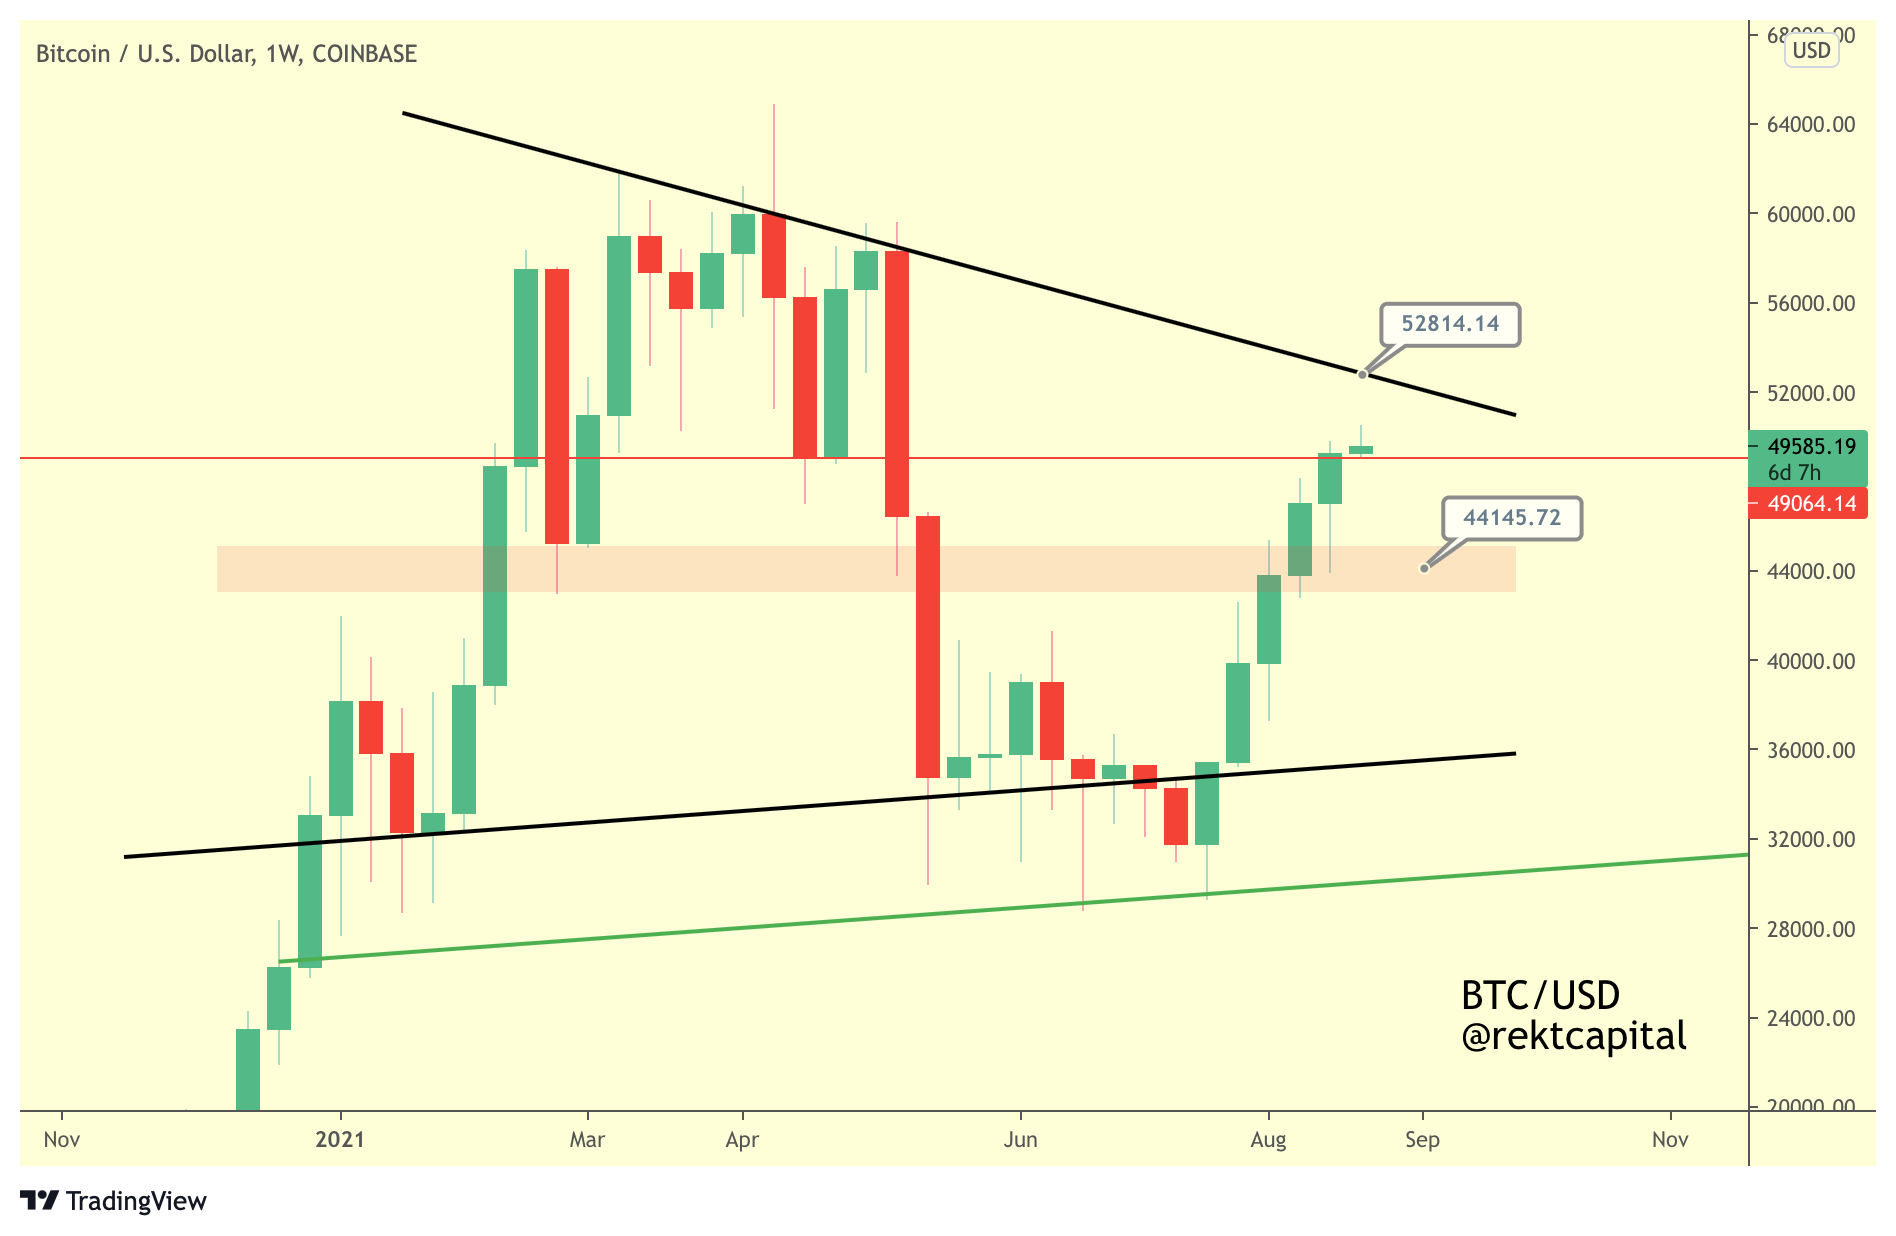
Before ultimately reaching the very top of said Flag, experiencing a picture-perfect rejection from ~$52800:
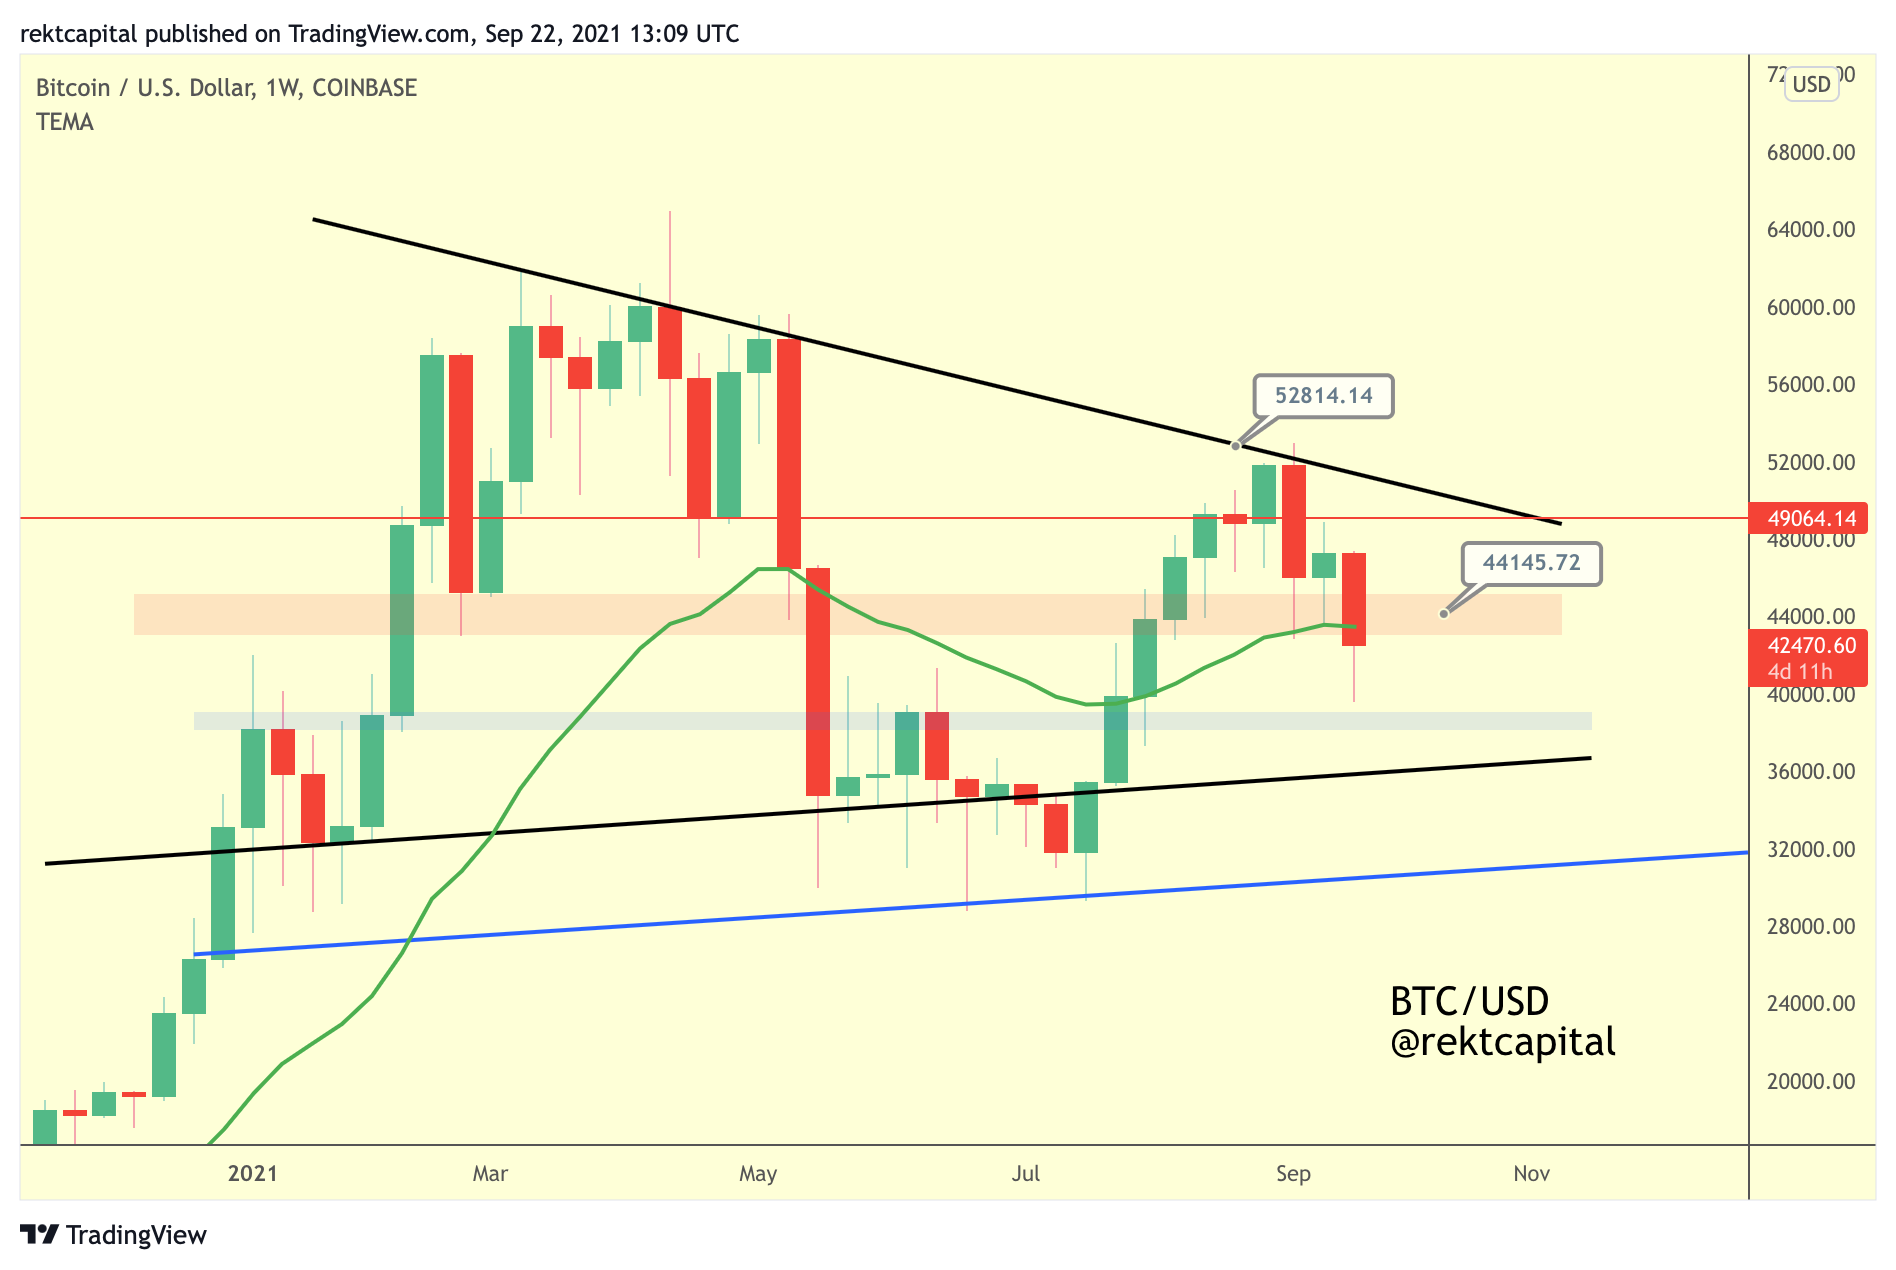
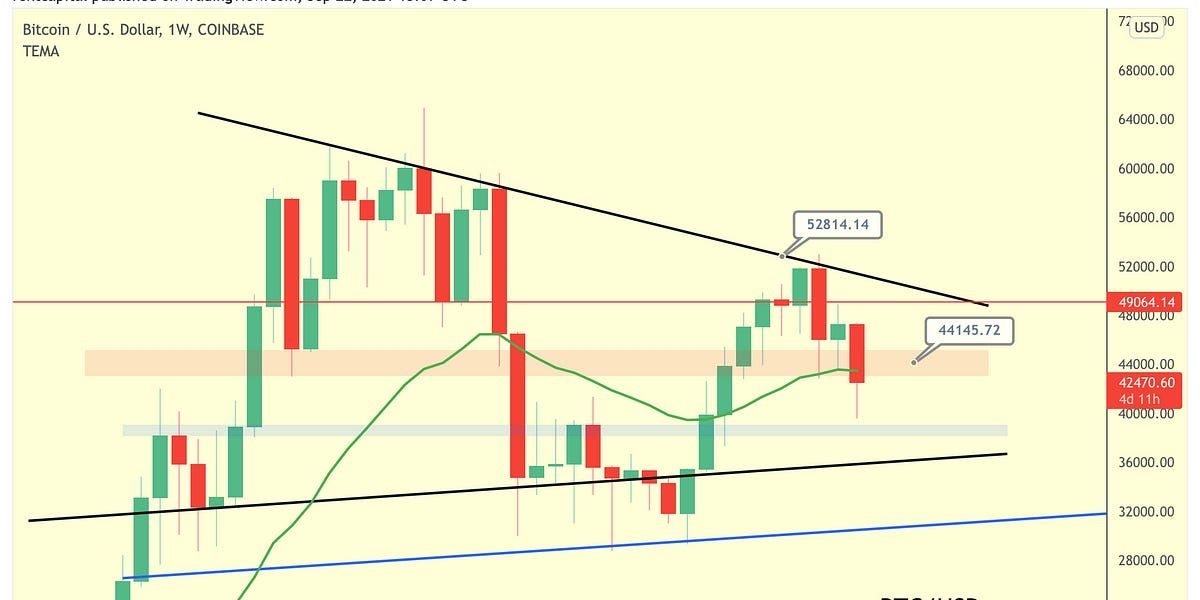
Right now, Bitcoin is trying to maintain itself in the red area, a demand area that is also confluent with the green 21-week EMA (a time-tested Bull Market indicator for BTC).
This confluent support area is essentially the mid-point of this entire Macro Flagging Structure.
Hold support there and BTC will maintain the upper half of the Flag (i.e. ~$43000-$50000)
Confirm a breakdown from this confluent support region and BTC will breakdown to the lower half of the Macro Flag (i.e. ~$36000-$43000).
But here’s the most important to take note of:
Bitcoin needs to Monthly Close above ~$42000 for Bitcoin’s historical mid-cycle price tendencies to continue repeating, as they have been for several months since May 2021.
How does this potentially tie in with this Macro Flag perspective?
Bitcoin needs to somehow maintain itself above the 21-week EMA, ideally even reclaim the red area as support until the end of September.
It’s certainly doable, especially since BTC is teetering around that area, undecided on which direction to confirm its next move, though having performed a volatile downside wick into the low $40000s already.
What could support Bitcoin’s price stability above ~$42000 is the Pi Cycle Top 111-day Moving Average:
Because Bitcoin is currently in the process of a mid-term retest of the orange Pi Cycle Top 111-day MA:
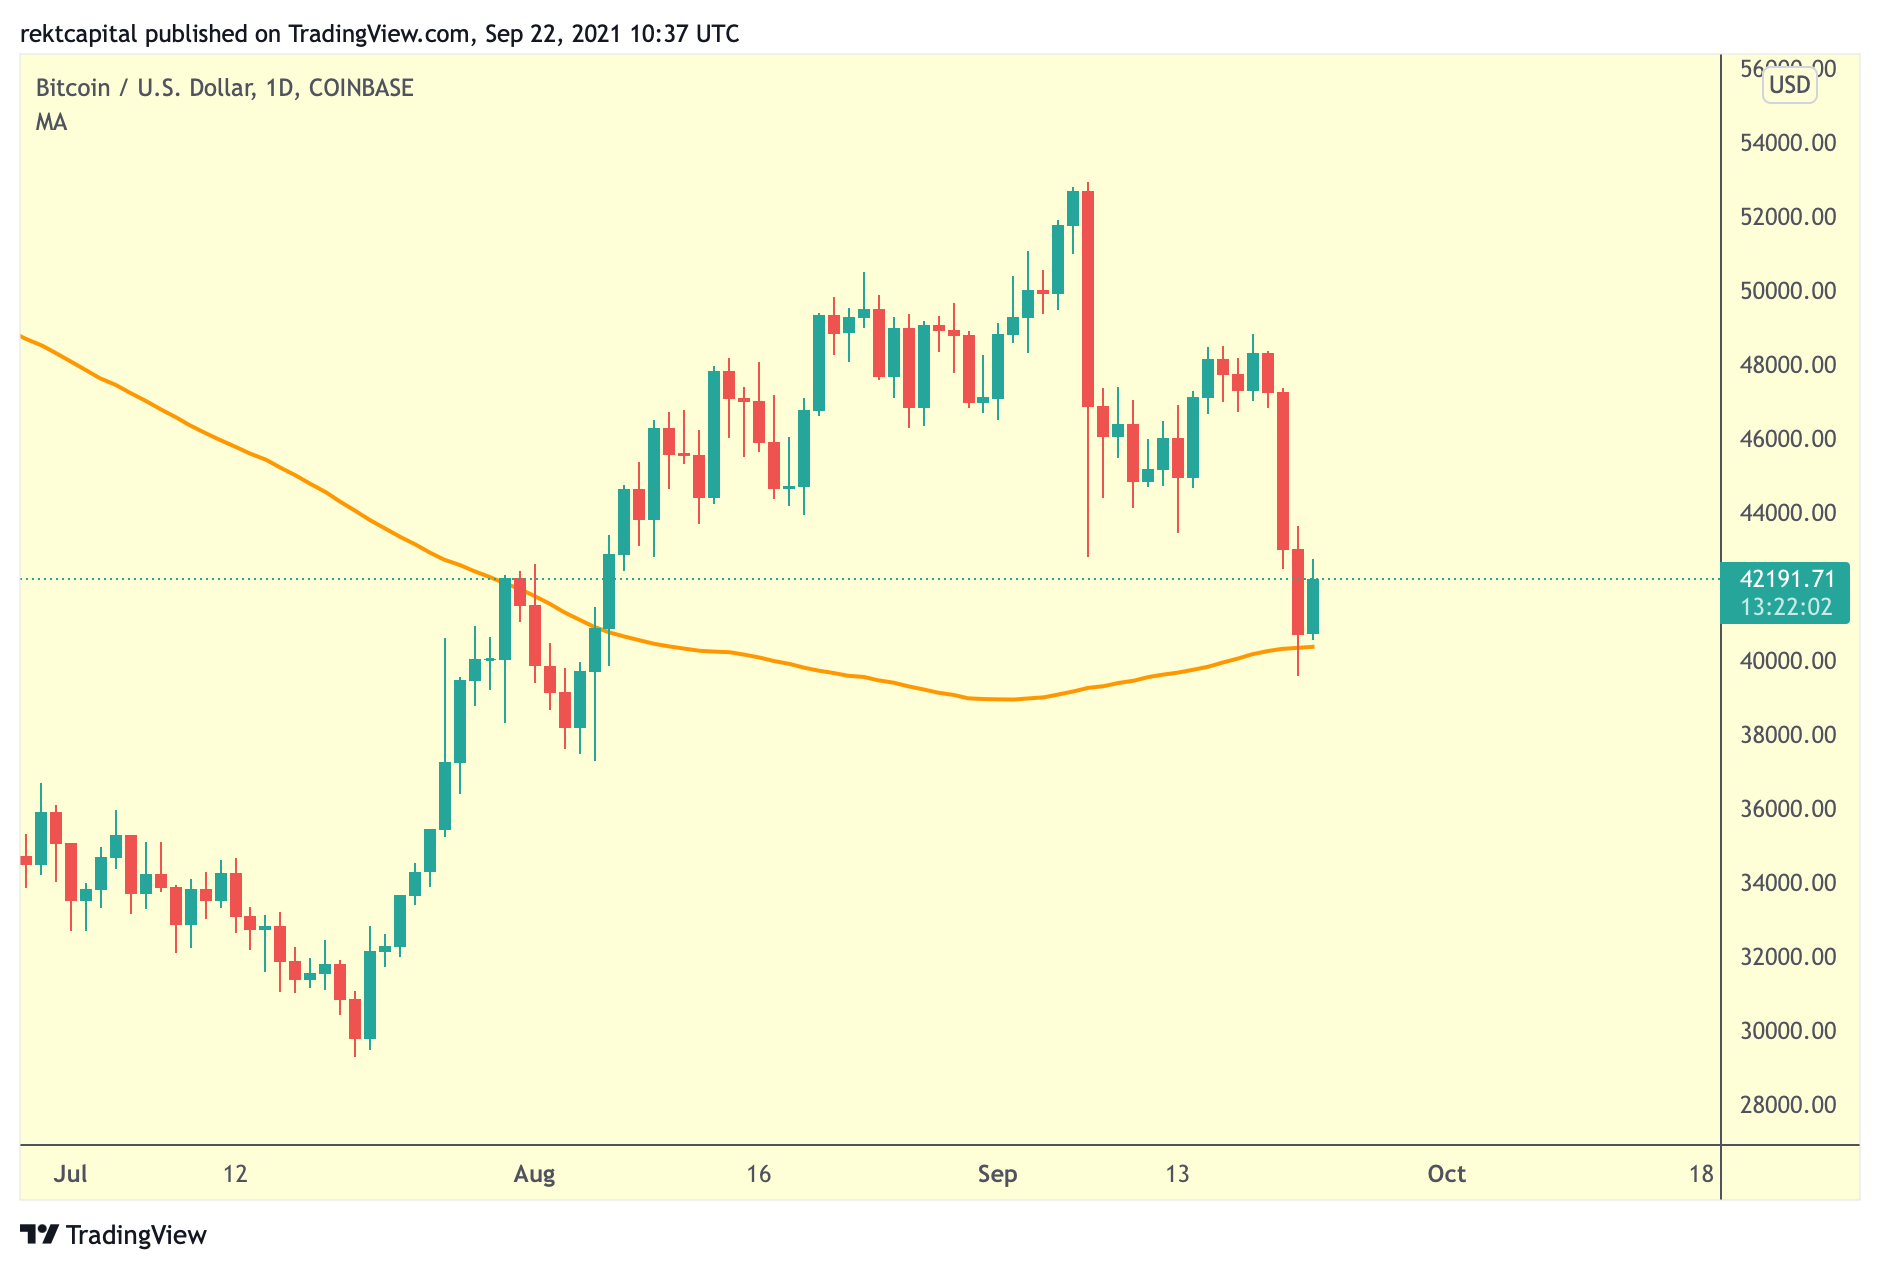
So how could the Pi Cycle Top 111-DMA support Bitcoin’s price stability above ~$42000?
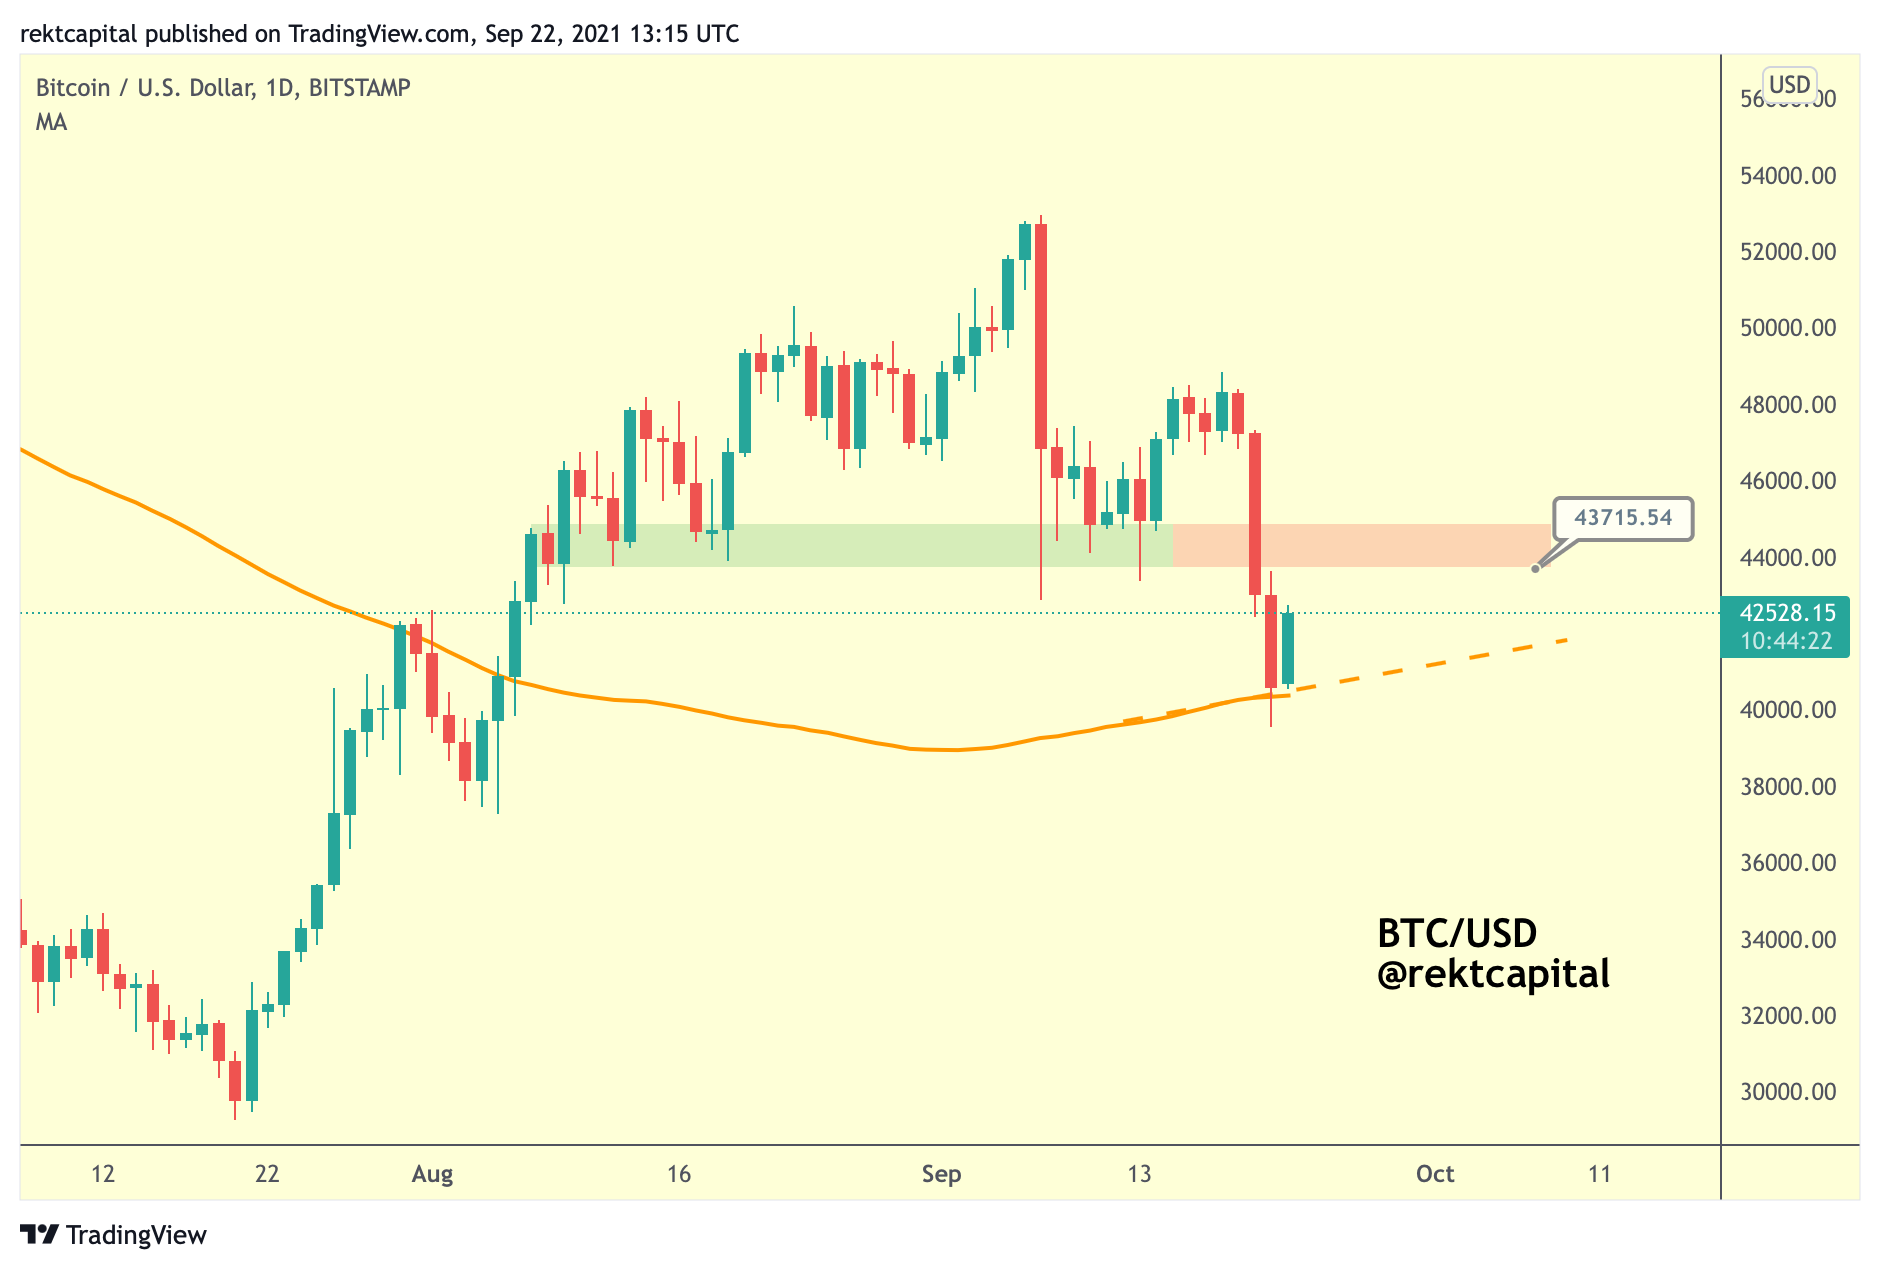
It simply needs to continue figuring as support.
In doing so, the Pi Cycle Top MA would sandwich price against the red box. This red box may figure as new resistance, since BTC lost this area as support a few days ago.
But this red box is at ~$43700 which is a higher price level than ~$42000 above which BTC needs to register a Monthly Close above.
Simply consolidating between the Pi Cycle Top MA and the red boxed area for the next few weeks would be sufficient for Bitcoin to perform a Monthly Close above ~$42000 later this month.
How does this all play into the Monthly Candle Close perspective for Bitcoin?
Upcoming September Monthly Candle Close
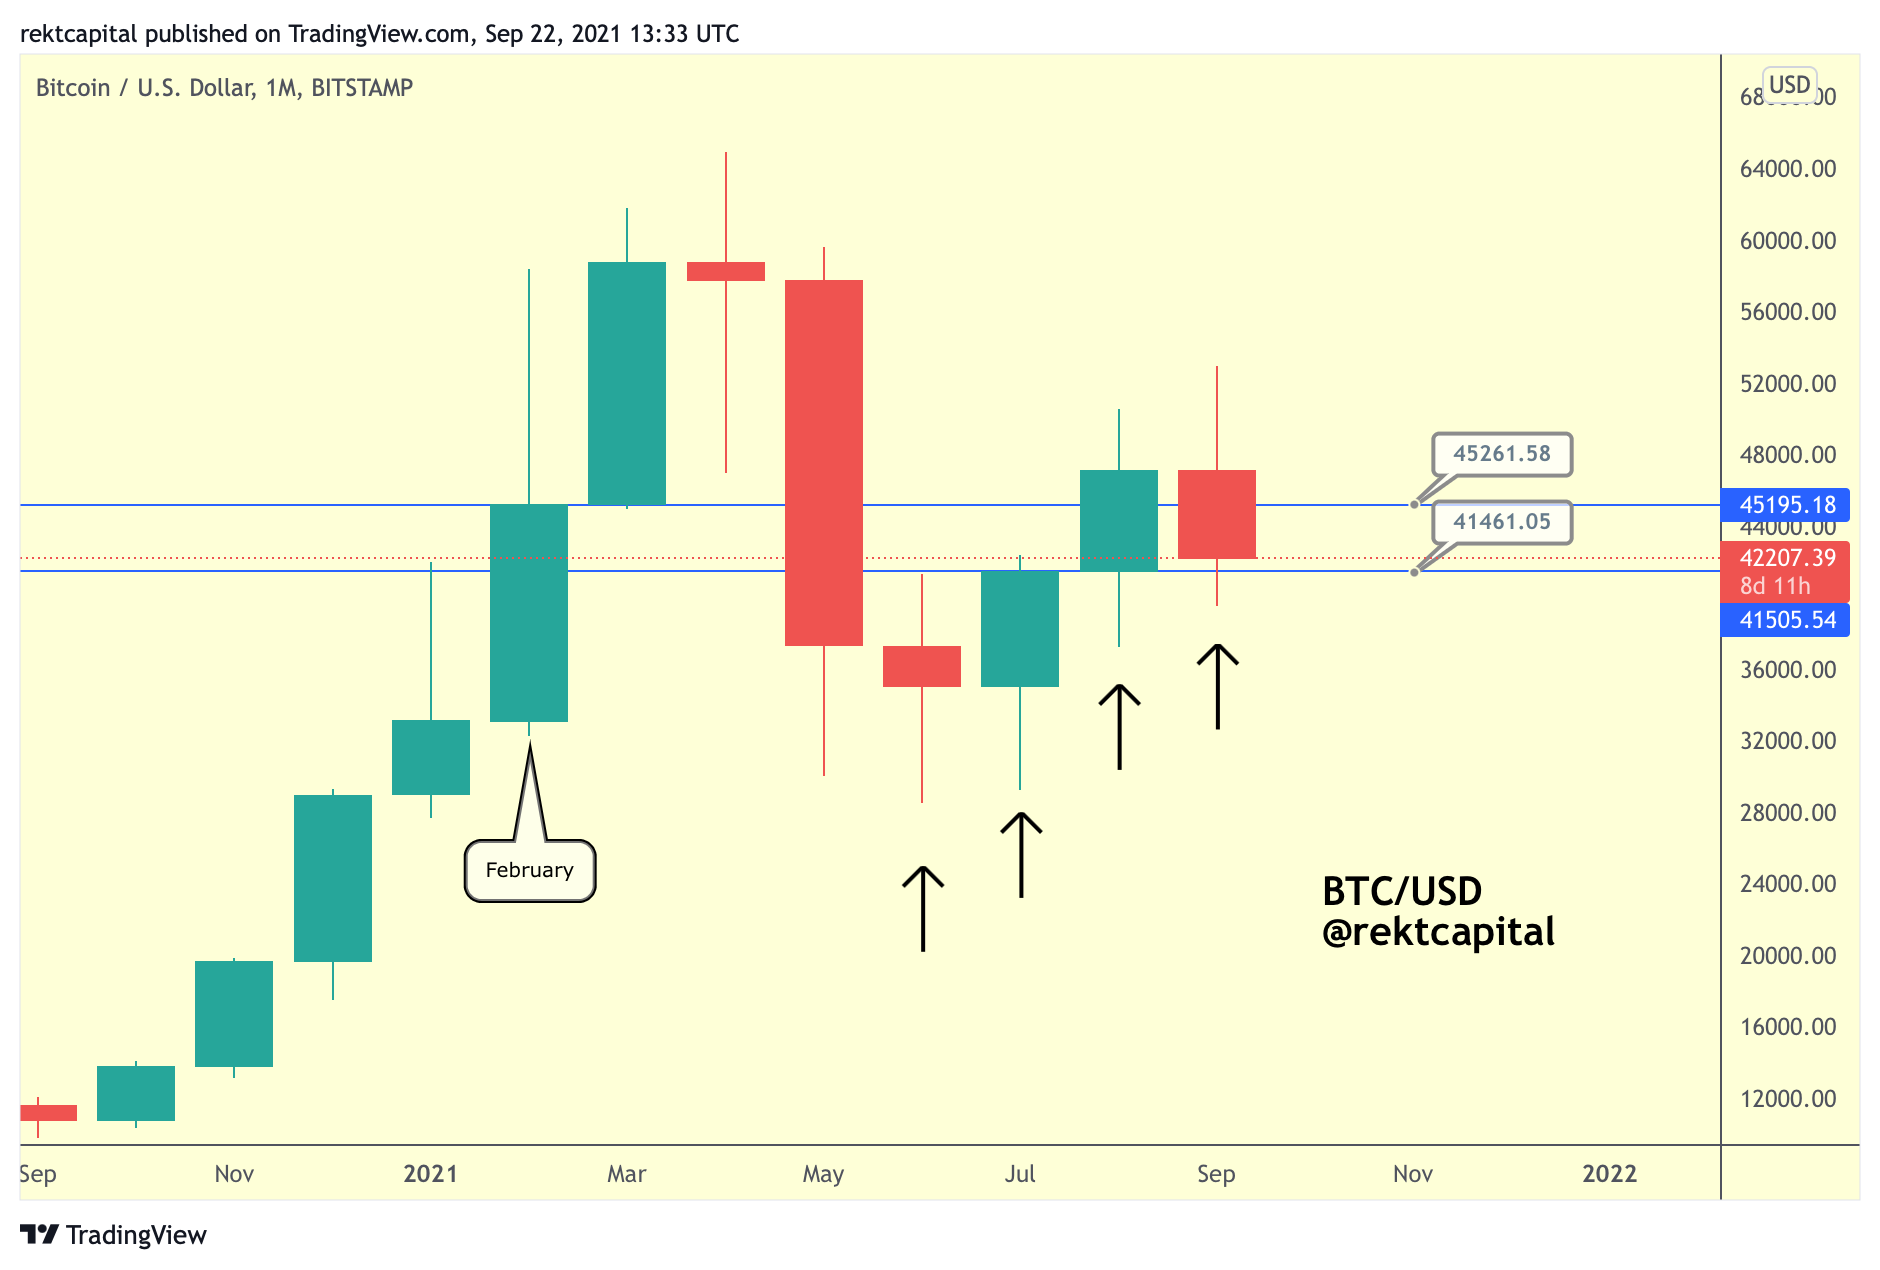
First and foremost, it’s worth mentioning that Bitcoin has been forming consistent Higher Lows for four months straight now.
Secondly, Bitcoin has broken beyond the blue horizontal resistance of ~$45200 this past August (by comparison, BTC couldn’t do this back in February).
Bitcoin is now technically enjoying a retest month following the break beyond ~$45200 last month.
And while BTC has failed to retest ~$45200 into support (i.e. February resistance), it is certainly retesting the ~$41200 level as support successfully thus far (i.e. June and July resistance), forming that fourth monthly Higher Low in the process.
A Monthly Close above ~$45200 would be phenomenal, but a Monthly Close above ~$41200 would also constitute a sufficient retest.
Ethereum Monthly Candle Close
Ethereum’s price predicament heading into its September Monthly Close looks much cleaner than Bitcoin’s:
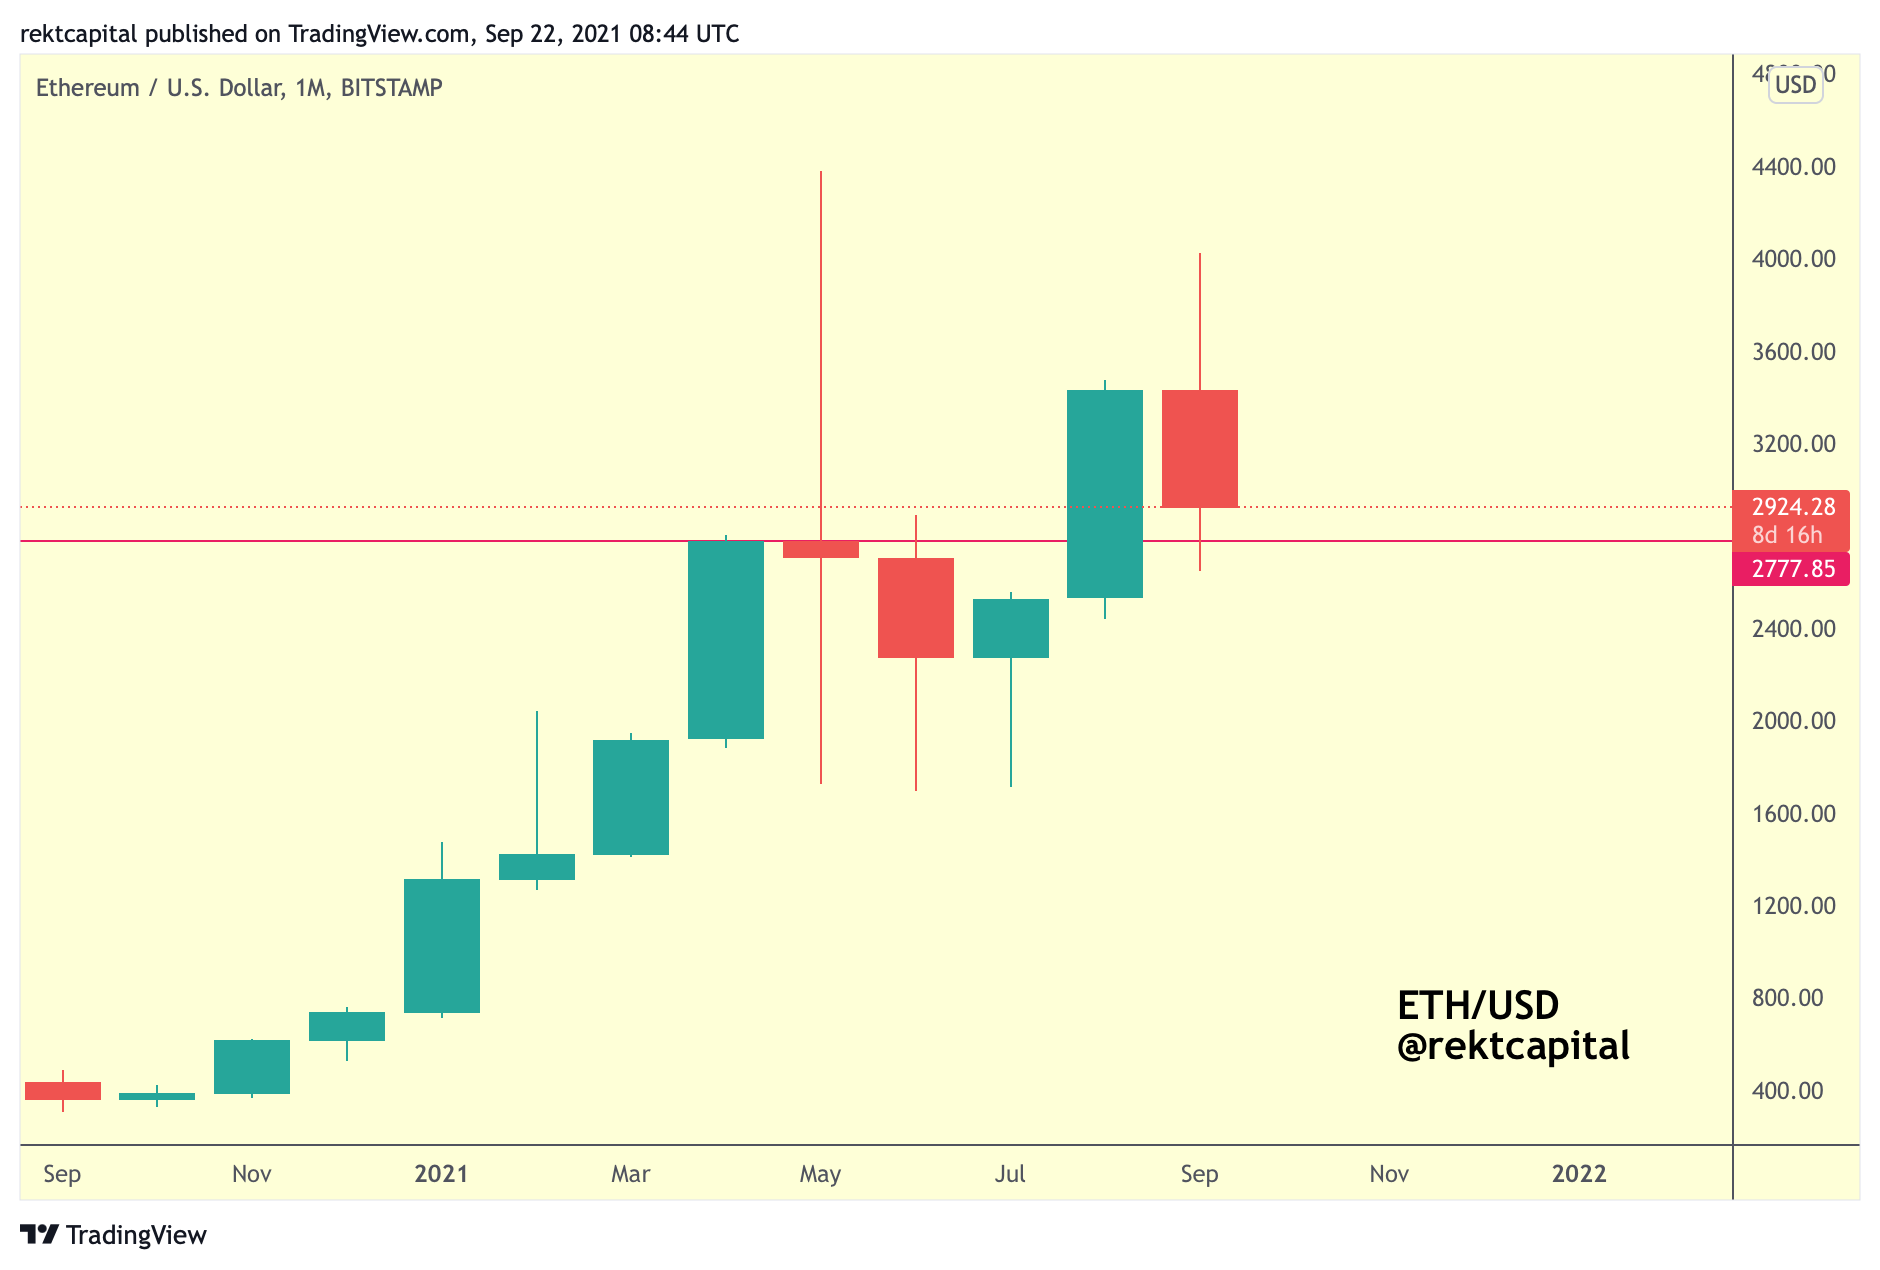
Last month, ETH/USD broke beyond its final major Monthly resistance (i.e. ~$2777).
After all, ETH couldn’t get past red in April, briefly overextended but nonetheless got rejected in May, and convincingly rejected in June.
Now ETH is in the process of turning this same level into support.
Successful retest here and Ethereum will be able to enjoy a green October.
Get ready for the next Ethereum move on Phemex.
Thank you for reading.
P.S. This Friday, I’ll chart your Altcoin picks in a private TA session and will cover approximately 10 Altcoins. So if you’d like to have an Altcoin charted, feel free to share max. two TA requests each in the comments below.
I’ll chart the Altcoins that get mentioned and ‘Liked’ the most. Let’s dive straight into today’s market analysis.