Bitcoin - Navigating September
Understanding how we can navigate the emerging trends in Bitcoin's price action
Welcome to the Rekt Capital newsletter, a place for people who want to better navigate the crypto markets with the help of cutting-edge crypto research and unbiased market analysis.
Bitcoin's Accumulation Area Formed By the BTC Death Cross
In May 2022, I shared the following thread on Twitter:
20.
— Rekt Capital (@rektcapital) May 26, 2022
Overall however, having analysed the many historical price tendencies relating to the #BTC Death Cross...
Tremendous confluence points to the ~$19700-$23500 region, with scope to go as low as the ~$15500 level due to downside wicking below the 200MA$BTC #Crypto #Bitcoin pic.twitter.com/wPIylXlmEE
And here is an updated chart to that analysis:
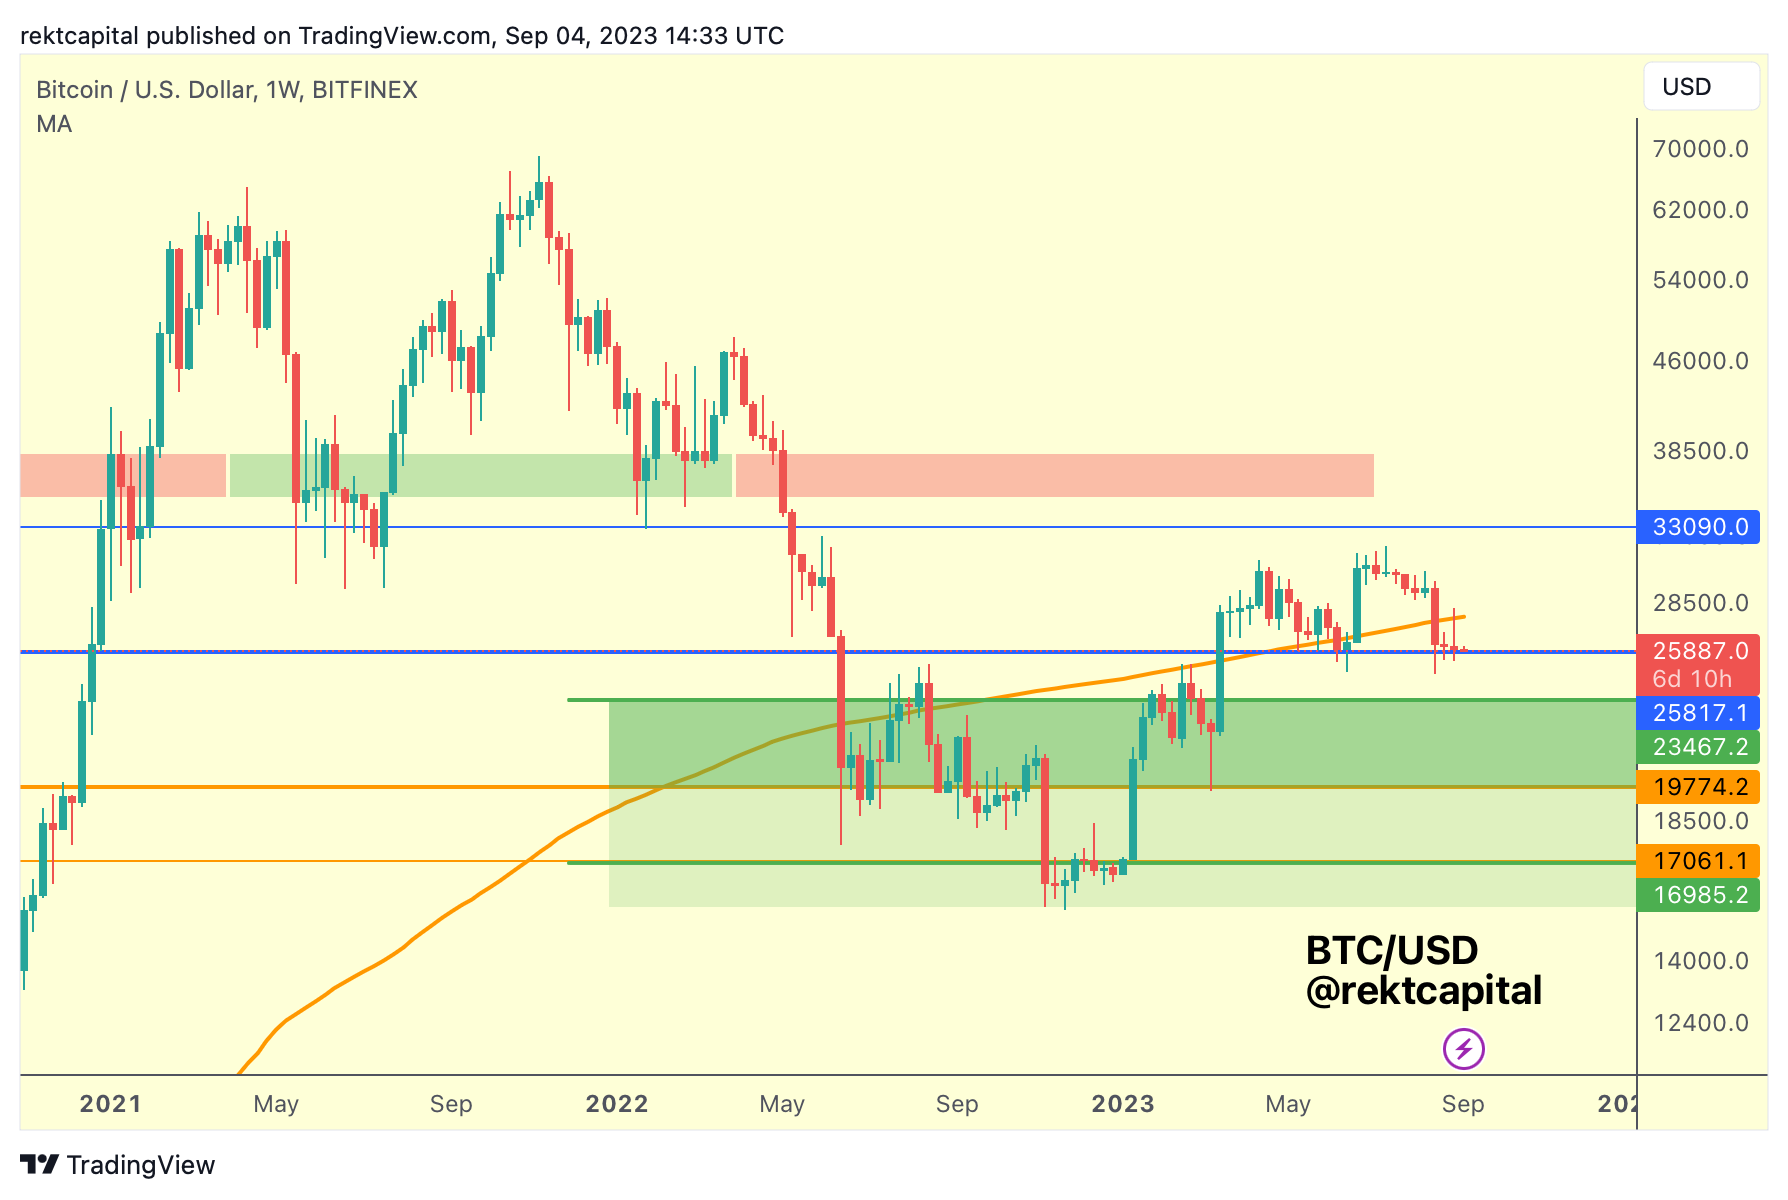
Bitcoin was able to find its Bear Market bottom at the very bottom of this Accumulation Area (green) which was devised by historical drawdown that we've seen in Bitcoin Death Crosses.
Months ago, the 200-week MA (orange) also played a role in developing this Accumulation Range; the MA acted as the reference point for a Bitcoin breakout from the Accumulation Area.
Of course now, time has passed and the 200-week MA represents a higher price point but it's worth noting the same principle that was apparent even back in late 2022:
Bargain buyers who buy Bitcoin below the 200-week MA will likely generate a high Return on Investment.
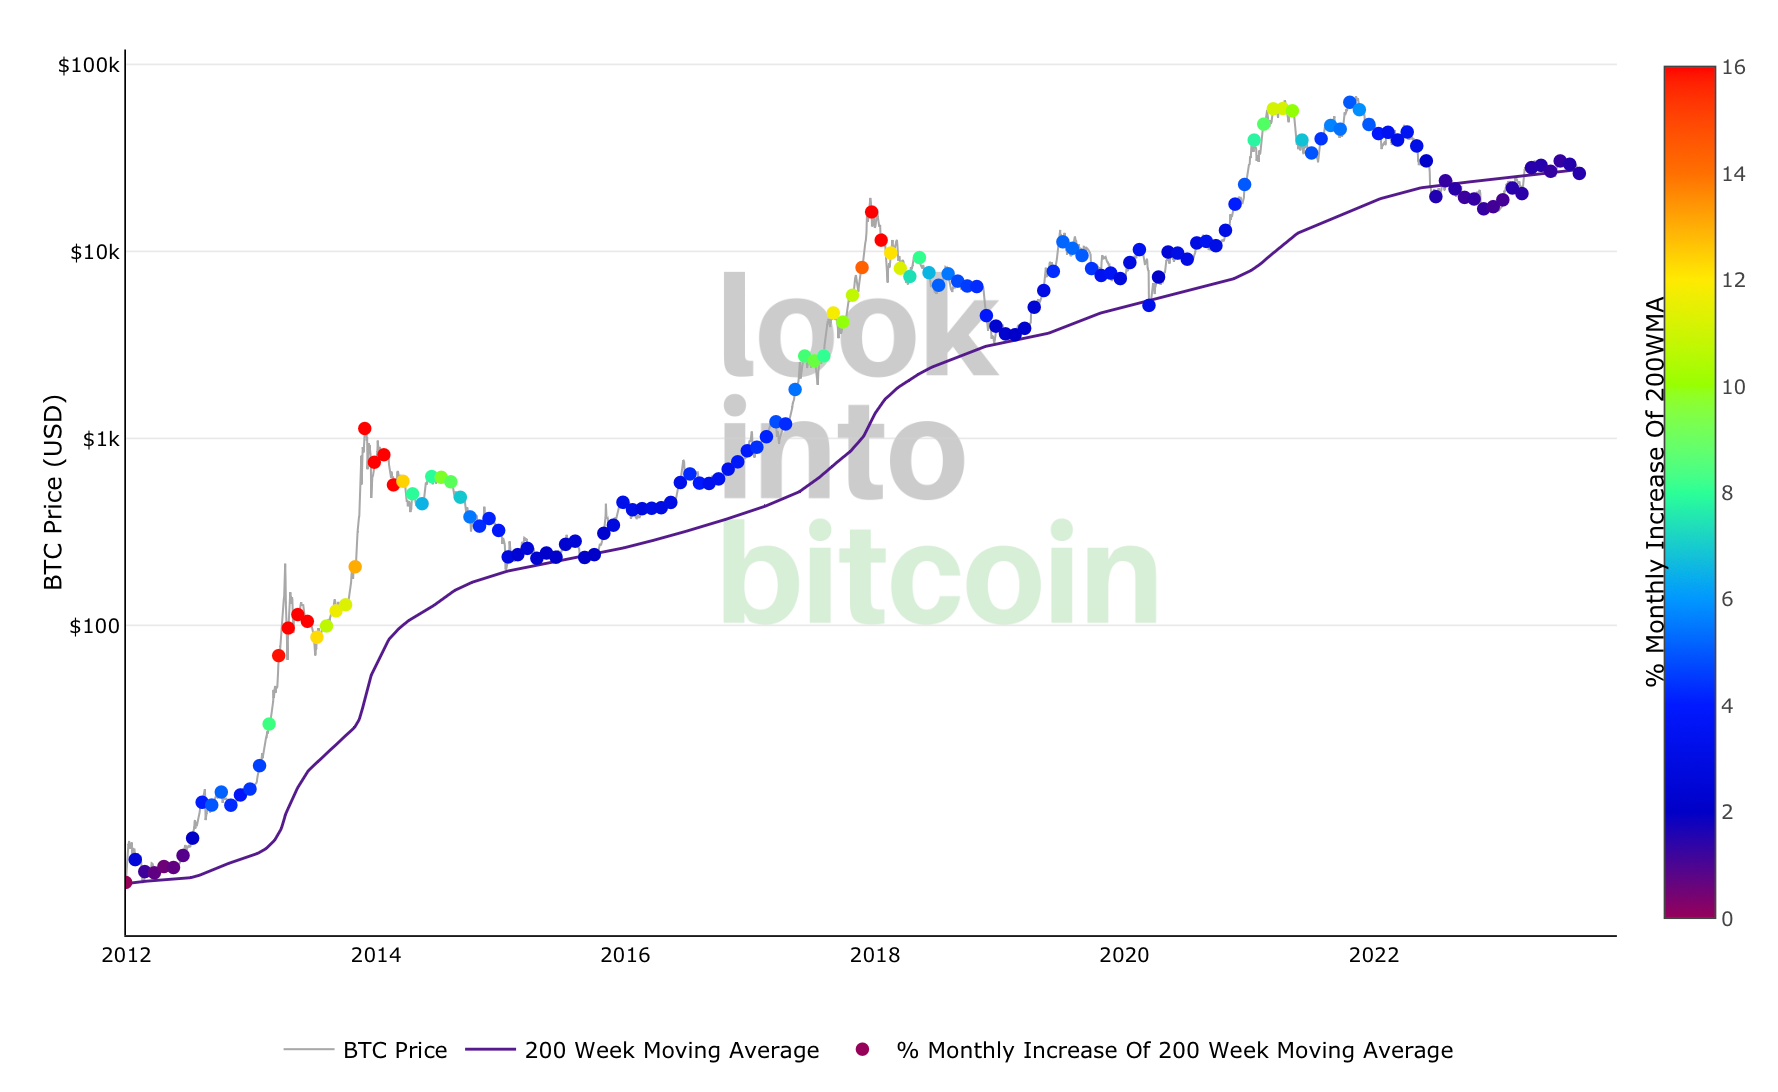
For most of Bitcoin's history, the 200-week MA (blue in the above chart) has acted as a generational bottoming out region.
In March 2020, BTC experienced downside wicking below the 200-week MA but still maintaing the 200-week MA as support.
In this cycle however things have been different: BTC formed an Accumulation Area below the 200-week MA.
And even though BTC recently flipped the 200-week MA into new resistance, as if suggesting that price could stay below this key MA in the coming weeks, the principle remains the same that this MA will represent bargain-buying opportunities for those investing in BTC for the long run.