Bitcoin: Pre-Halving Analysis (Part 2)
A comprehensive look at Pre-Halving years
Welcome to the Rekt Capital newsletter, a place for people who want to better navigate the crypto markets with the help of cutting-edge crypto research and unbiased market analysis.
Monthly Timeframe
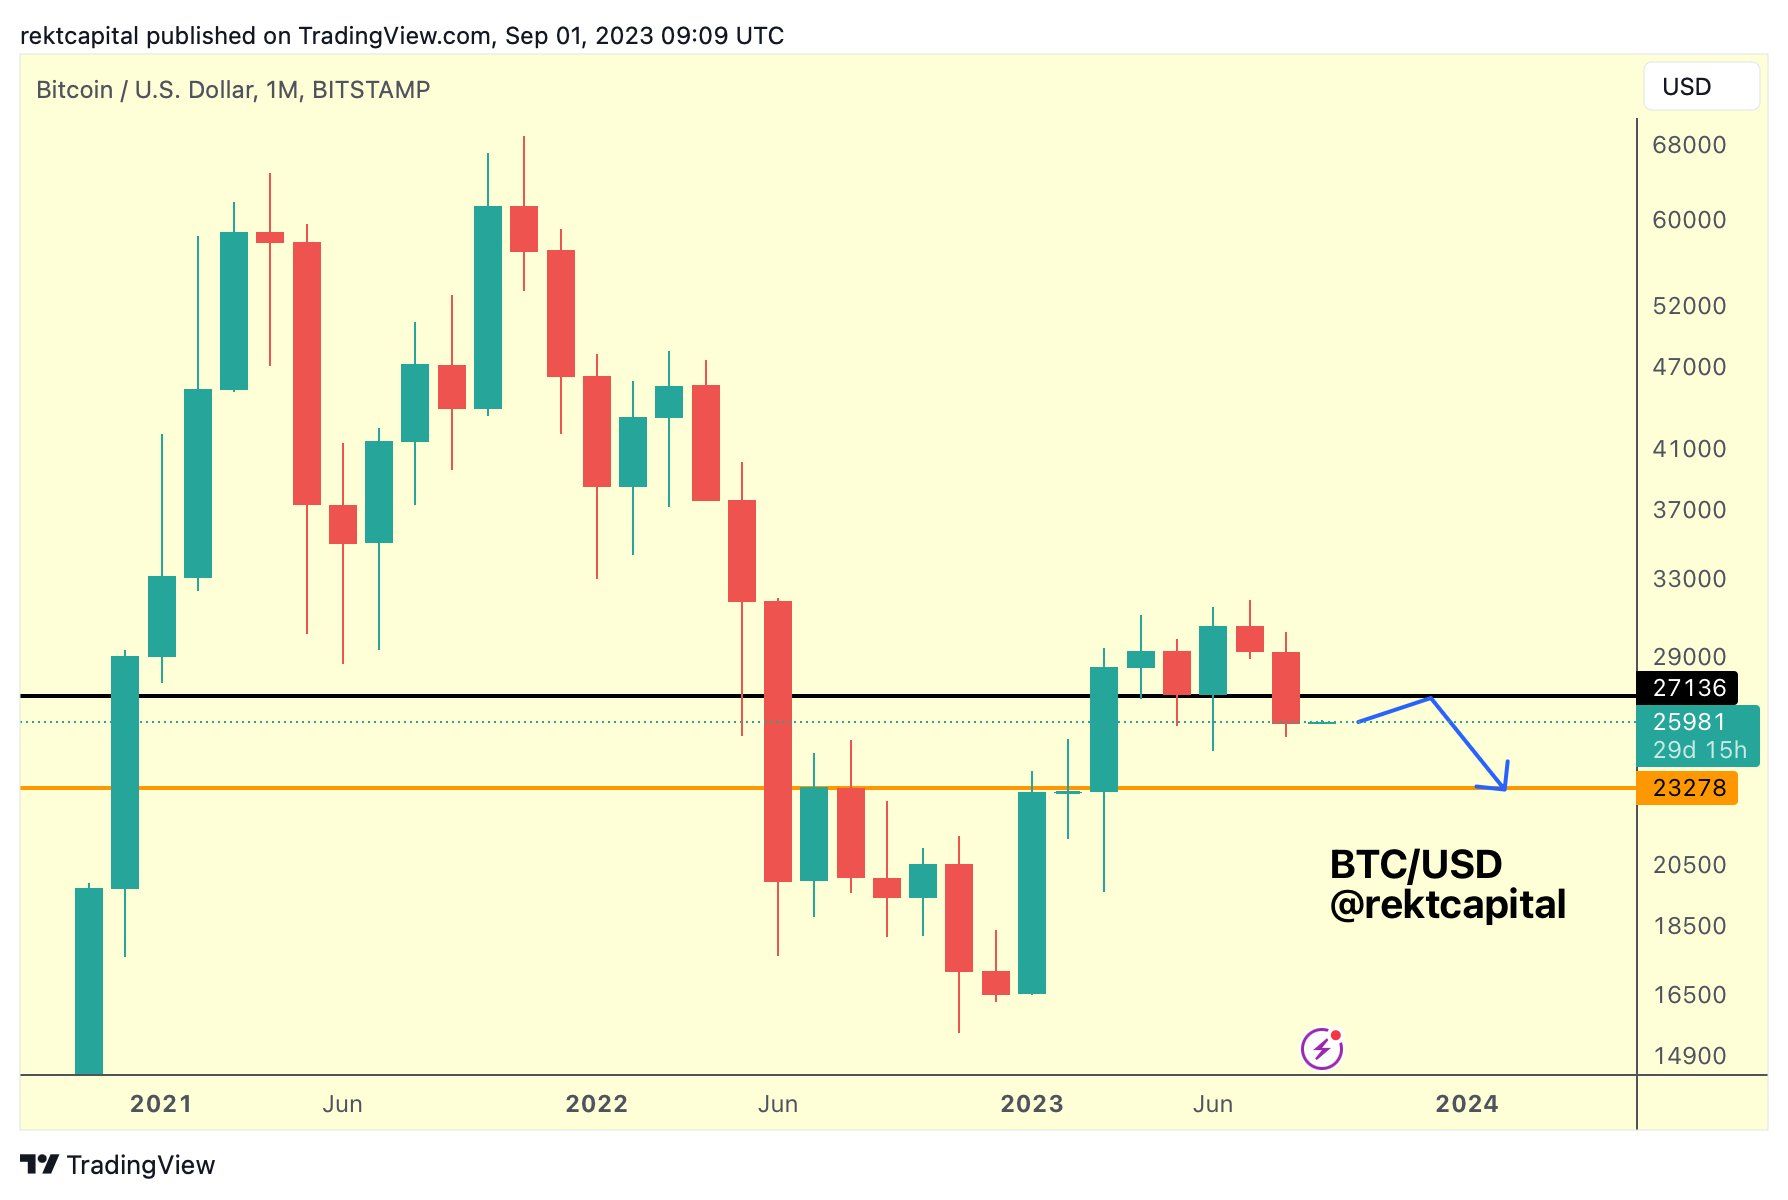
On September 1st, I shared this analysis:
And here is an update:
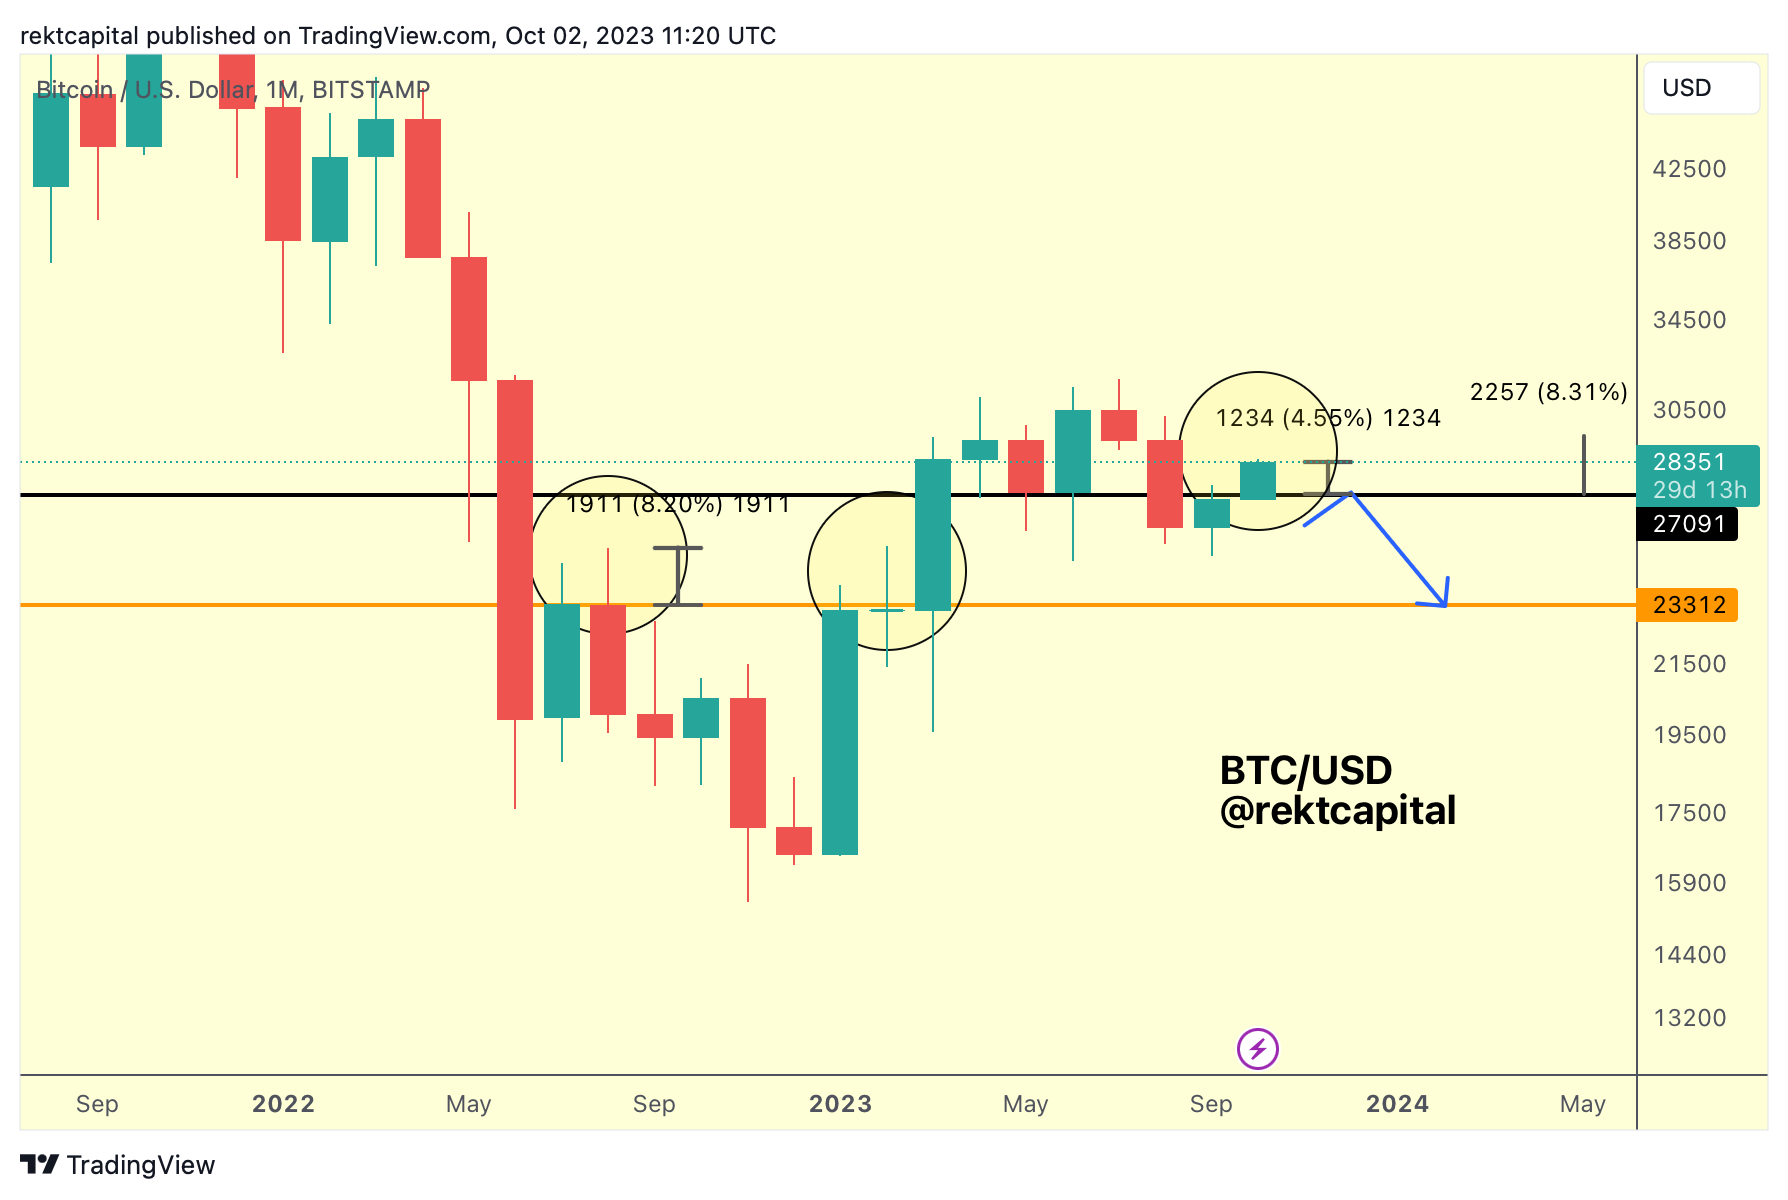
Though BTC Monthly Closed below the blakc ~$27100 level, Bitcoin has already broken out this October, up +4.5% on the month thus far.
And if Bitcoin reclaims the black level as support, then September's downside deviation below black would've been just a fake-breakdown.
A reclaim of black as support is crucial to solidifying this current move as sustainable.
Because over the past year or so, BTC has produced long upside wicks beyond key Monthly resistance, as mentioned in this tweet a few weeks ago.
Upside wicks have been even as long as +8%.
So for Bitcoin to invalidate an upside wicking scenario, it would need to:
- Reclaim black ~$27100 as support
- And Monthly Candle Close above black
Bearish Bitcoin Fractal Still Technically Intact
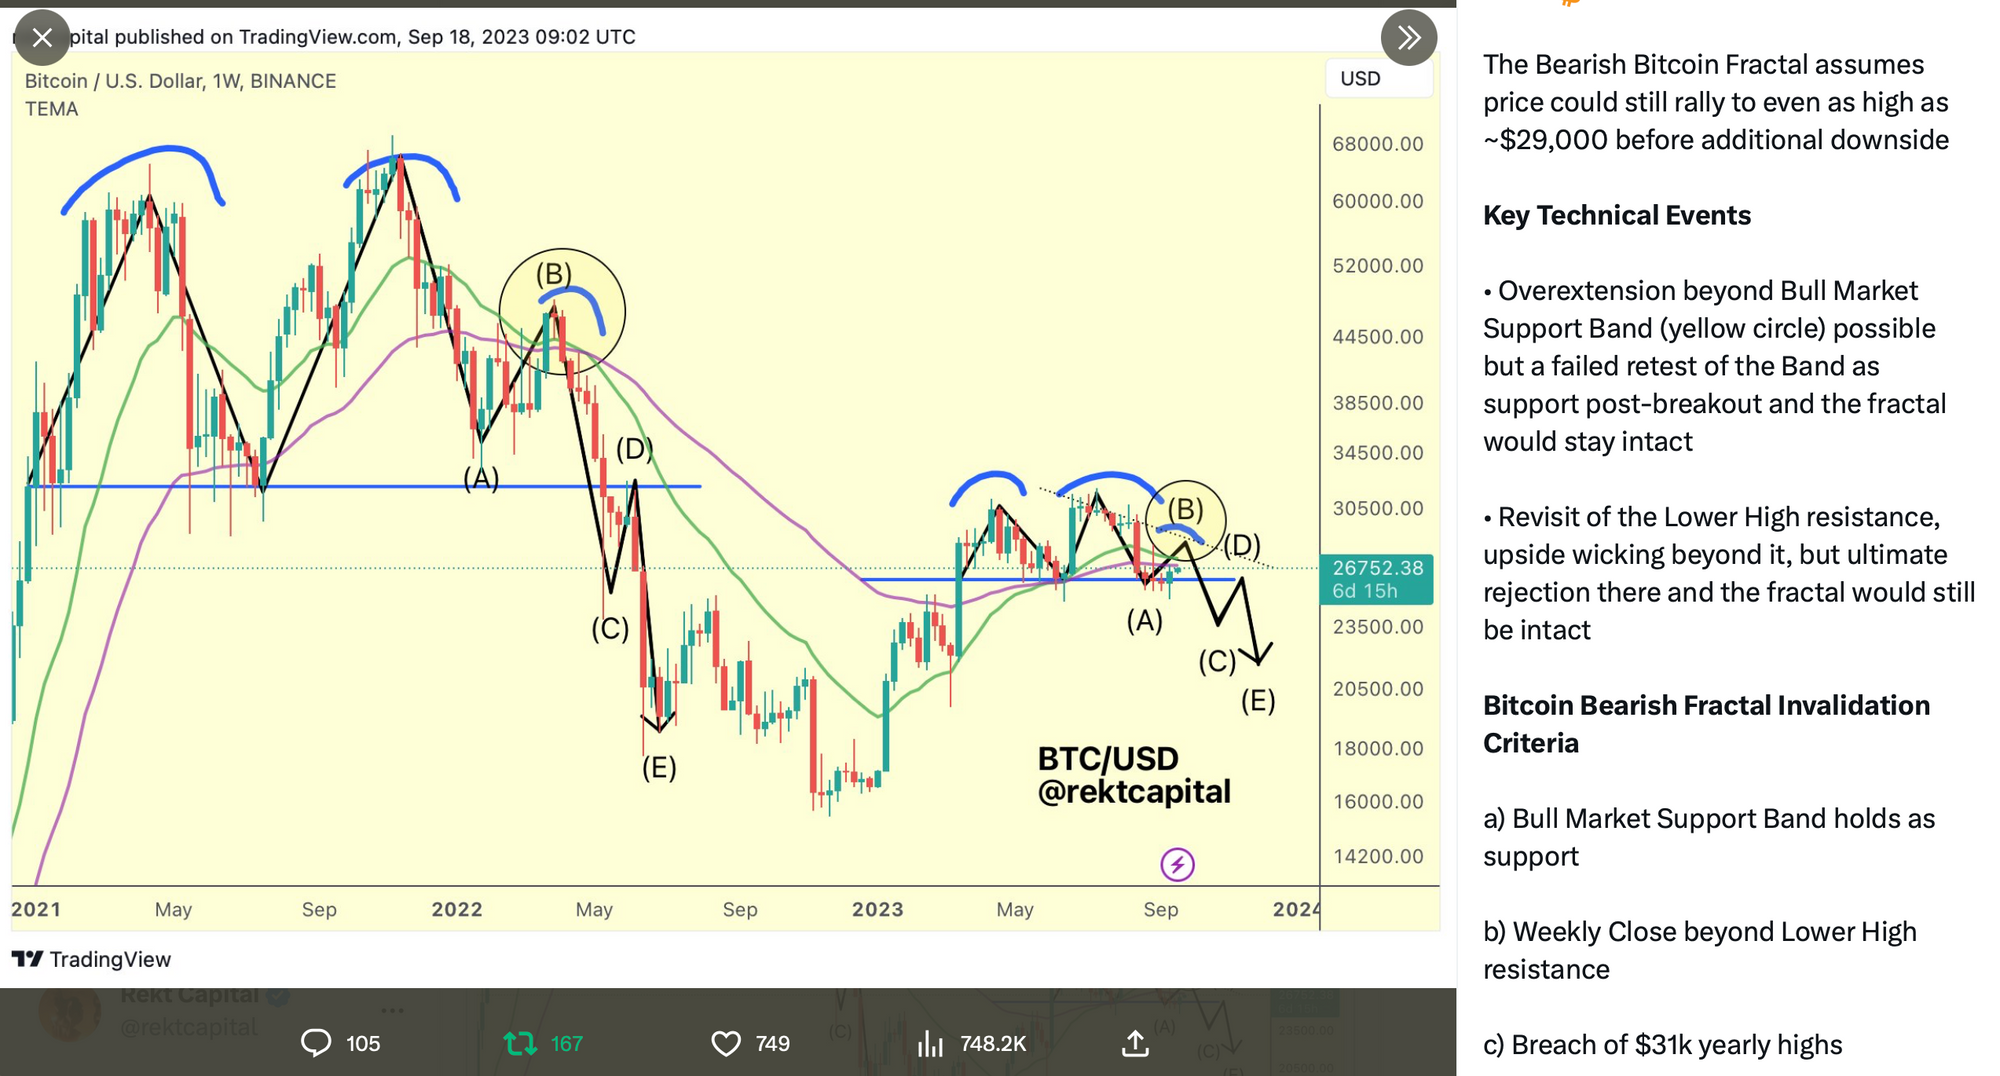
Last month, I shared this bearish fractal BTC:
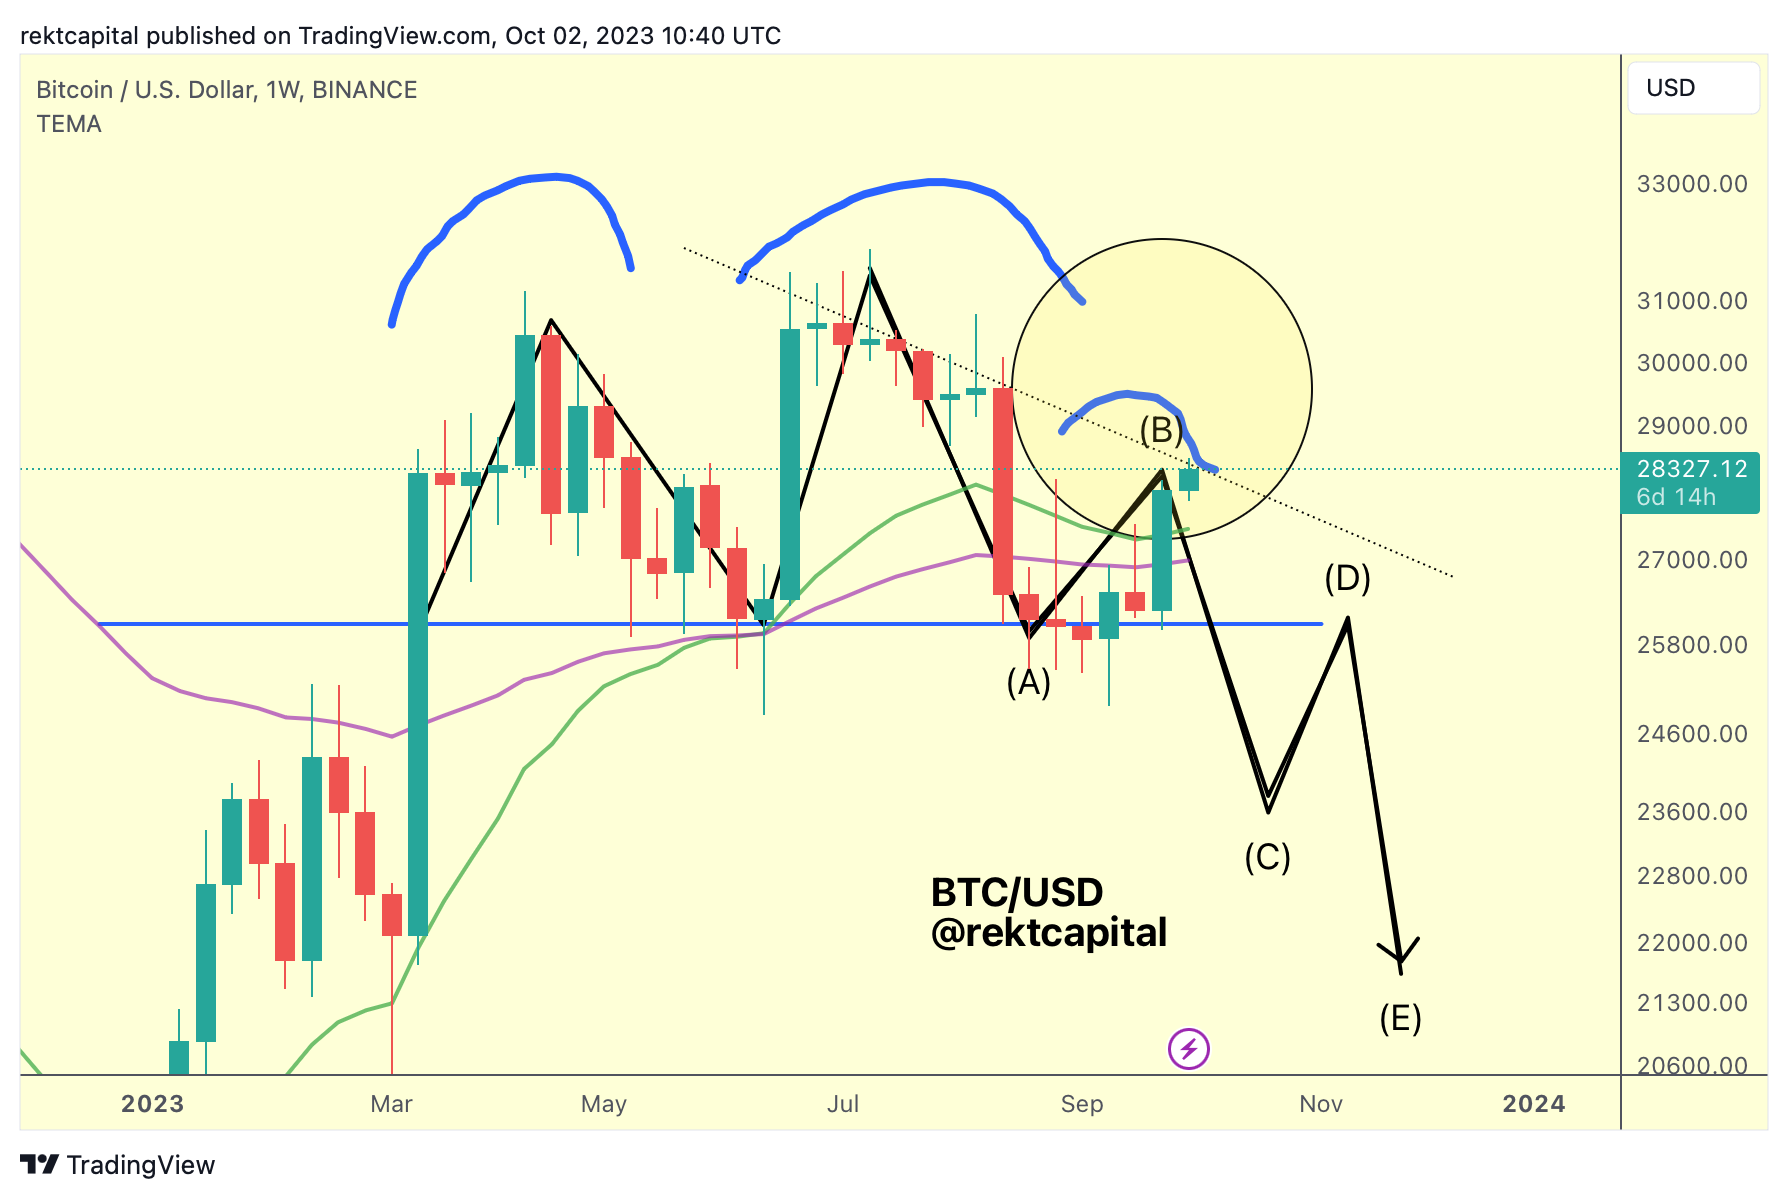
And here is an update:
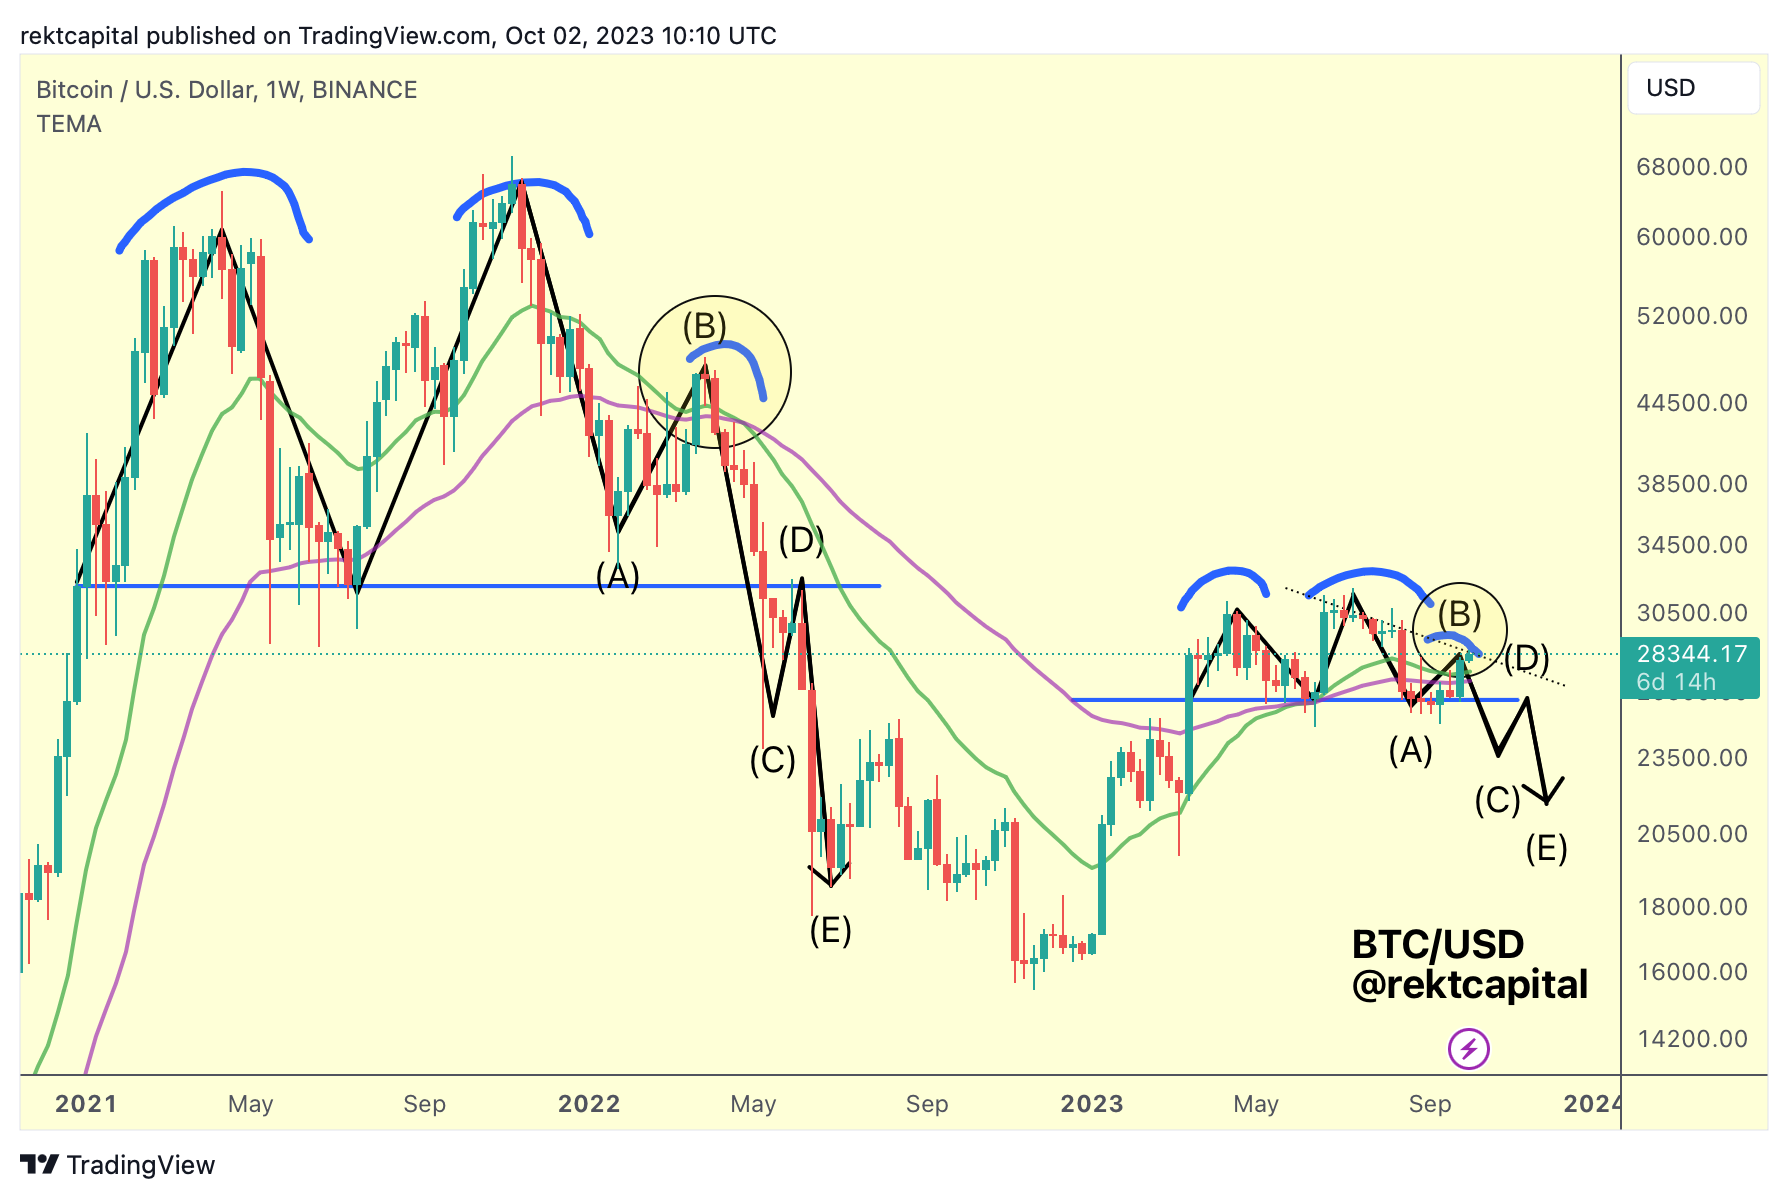
Indeed, Bitcoin has rallied beyond the Bull Market Support Band cluster of moving averages to revisit the Lower High resistance, completing Phase A-B of the fractal, with scope for upside wicking to as high as $29000.
Of course, the invalidation criteria from the tweet are clear:
- Bull Market Support Band holds as support
- Weekly Close beyond the Lower High resistance
- Break beyond ~$31000 resistance
At the moment, none of these invalidation criteria have been met; in fact, BTC is at a crossroads, now at the crucial Lower High resistance.
Can Bitcoin break beyond this Lower High to finish this Bearish Bitcoin Fractal?
Until we see the invalidation criteria play out, we cannot dispute this theory.
Especially since we've seen similar fractals play out in the past:
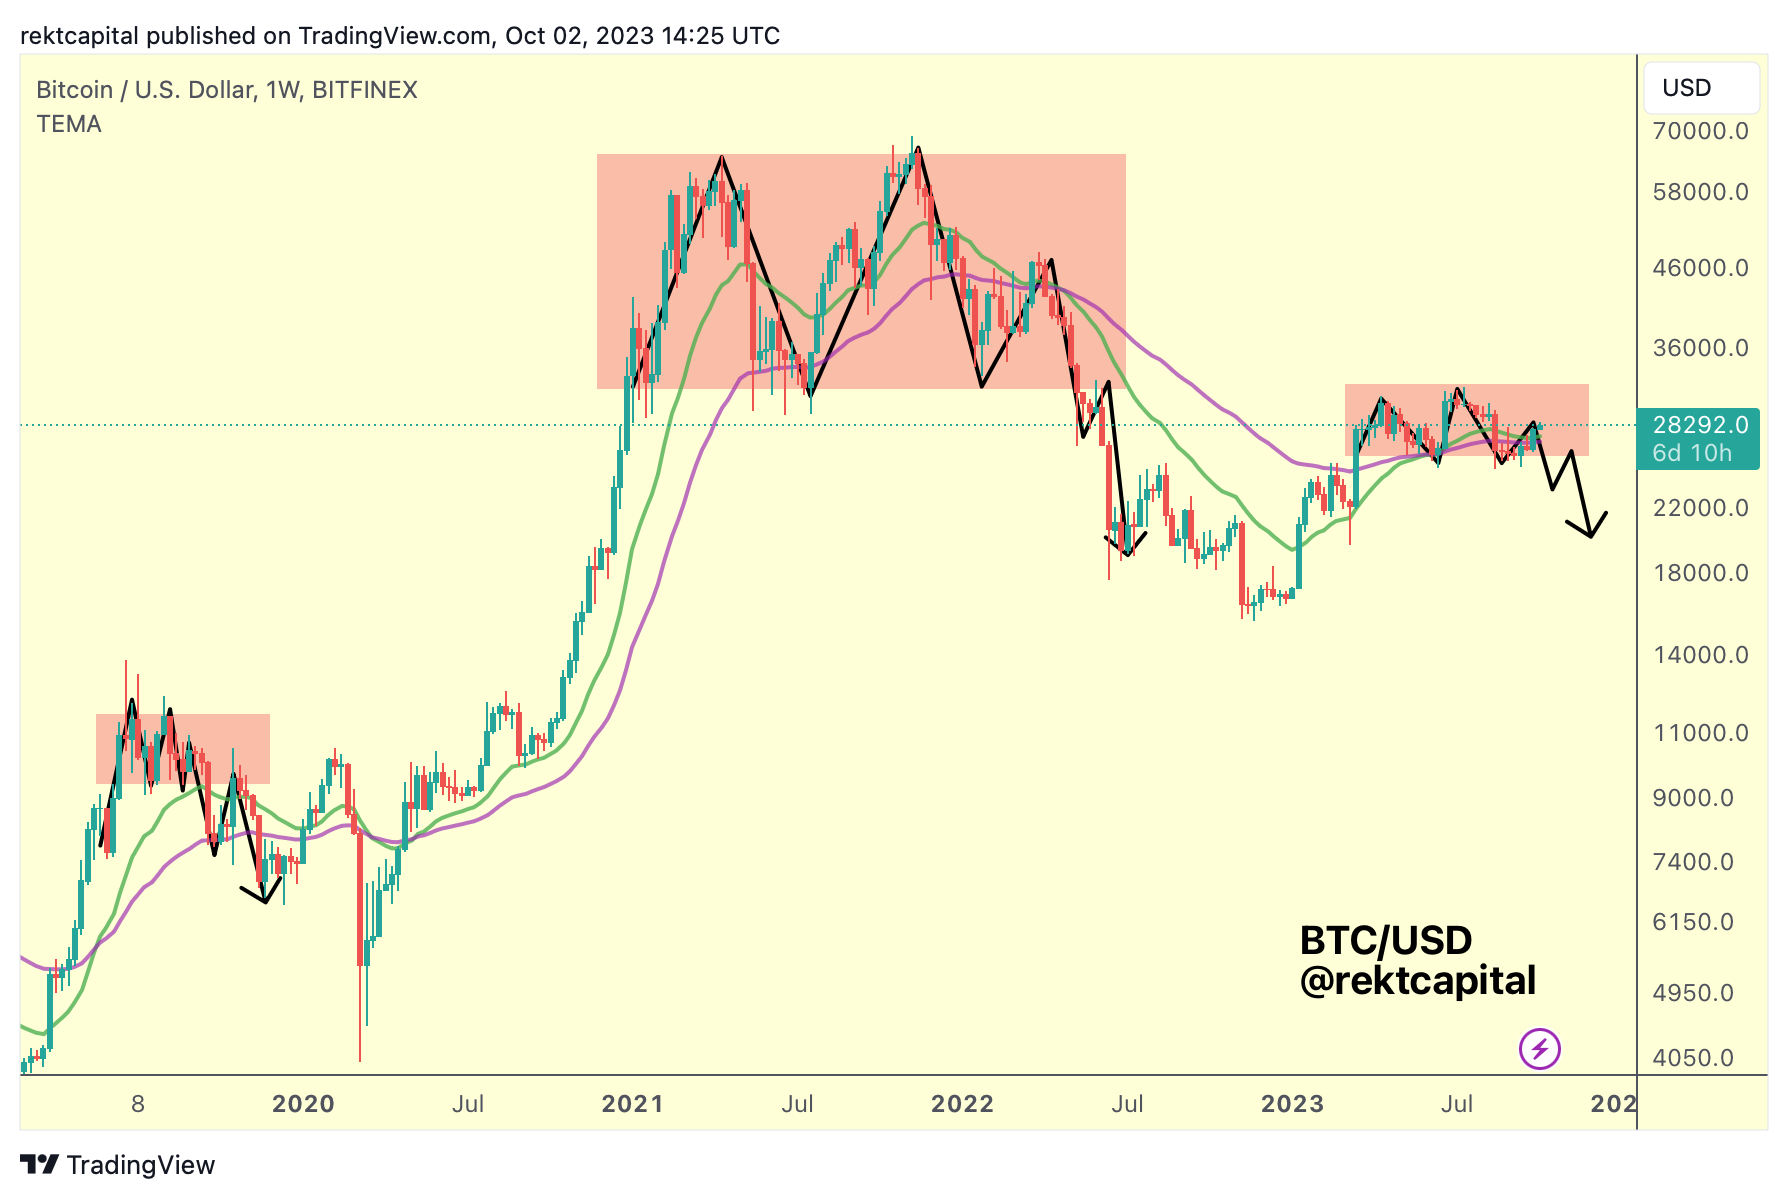
In fact, in 2019 and 2021 BTC had also overextended beyond the Bull Market Support Band cluster of moving averages, before forming a Lower High and losing those EMAs as support on the pullback.
Could history repeat?
The entire point here is trying to answer the question of whether Bitcoin has one last crash left in it before we see bullish upside in 2024 and 2025.
It's not about being anti-Bitcoin and being bearish on price for the fun of it.
After all - we are all macro bullish on Bitcoin.
But it's important to try to analyse the historically recurring price tendencies for Bitcoin in a Pre-Halving period to understand the potential scenarios for price going forward.
And upon doing that - we'll notice that becoming resoundingly bullish at this juncture could carry risk in of itself:
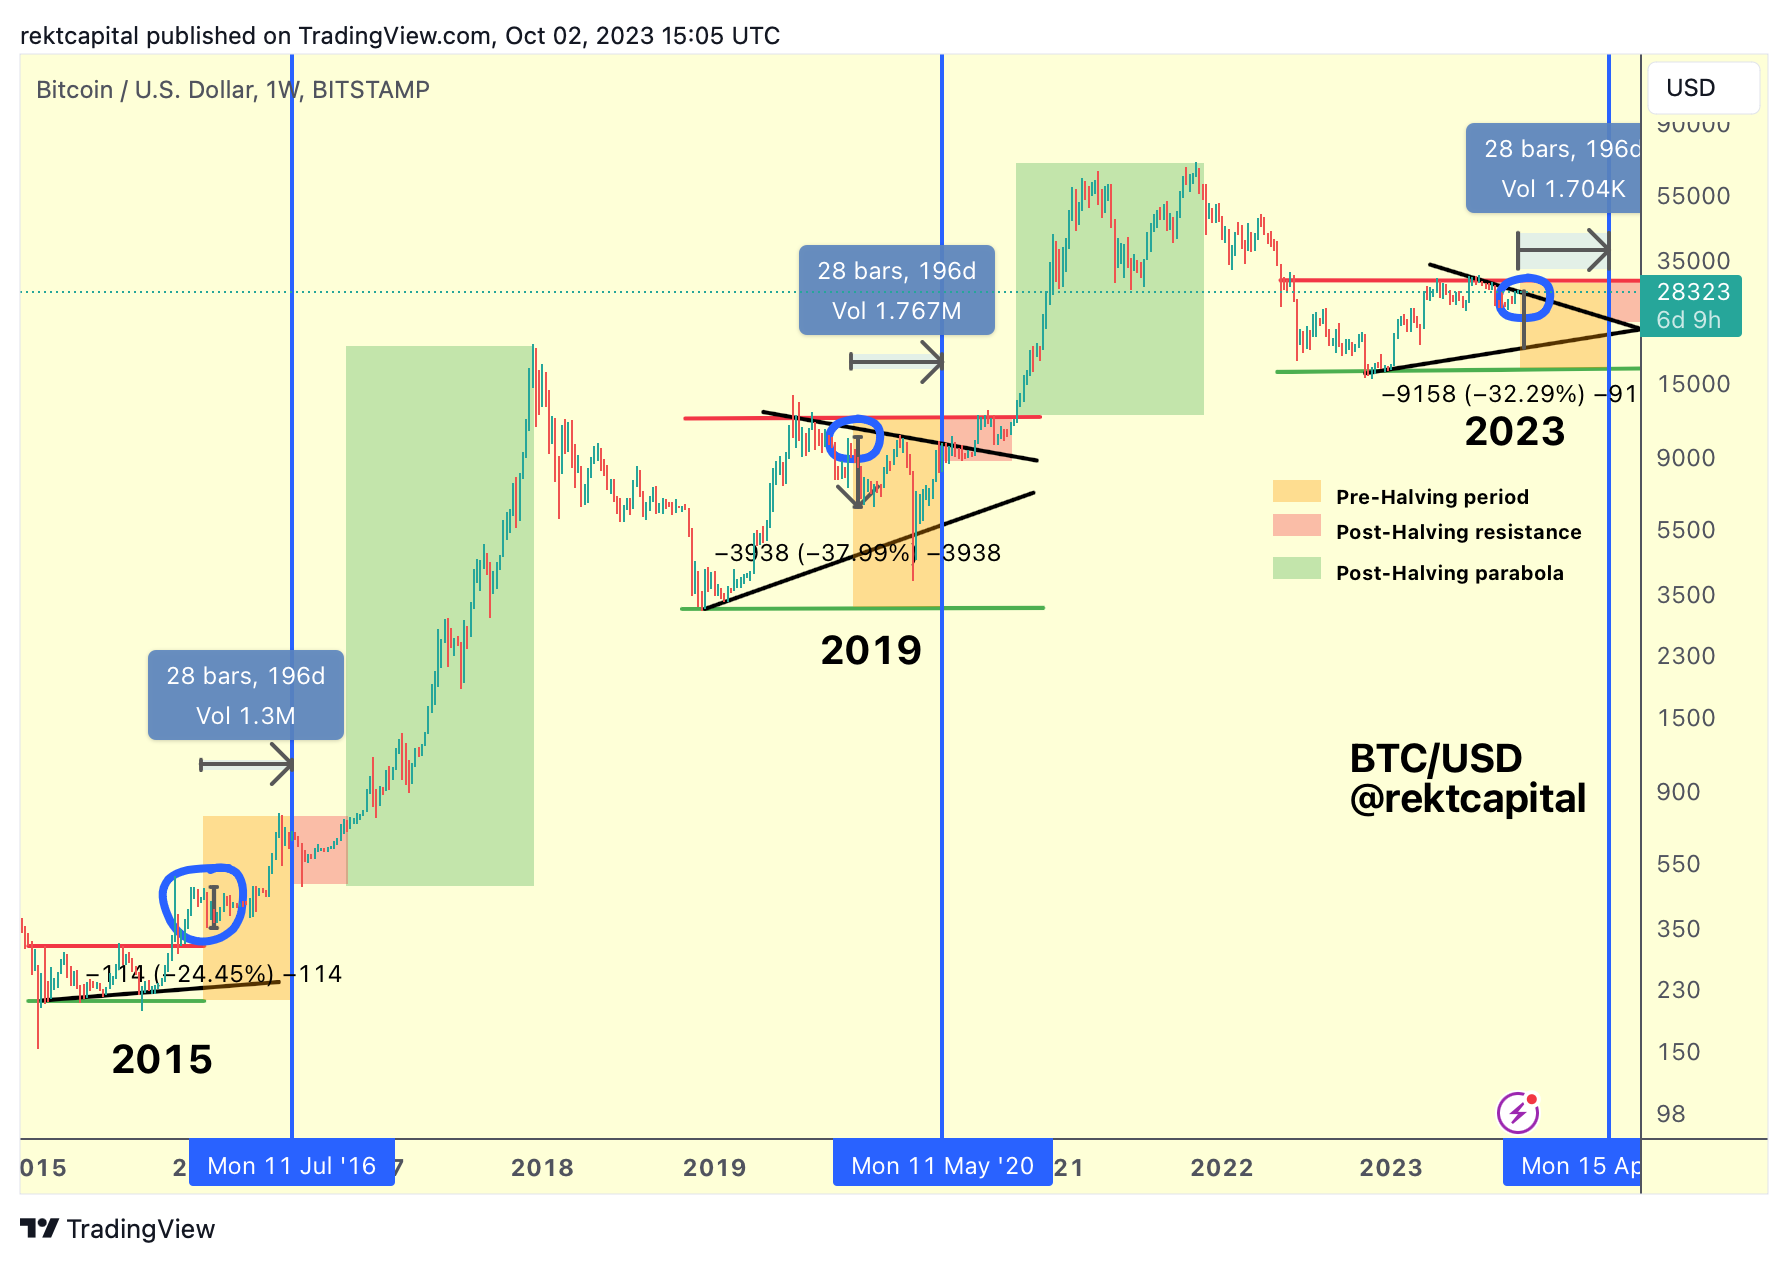
Because at this same point in the cycle:
- In 2015, BTC Local Topped to perform a -24% retrace
- In 2019, BTC had already Local Topped to form a Lower High before experiencing a -37% retrace
We are less than 200 days away from the Halving and history suggests that if BTC is going to experience a deeper retrace, it should do over the coming 140-days or so