Bitcoin - Is $46000 The Top For 2023?
Is a Pre-Halving Retrace Possible?
Welcome to the Rekt Capital newsletter, a resource for investors who want to better navigate the crypto markets with the help of cutting-edge crypto research and unbiased market analysis.
Bitcoin - Weekly Timeframe
In recent weeks we've been talking about how Bitcoin was in the process of retesting the Range Low of ~$36130 as new support in an effort to revisit the Range High of ~$44000:

A week later, Bitcoin already enjoyed strong trend continuation:

Until finally revisiting this Range High successfully for a +25% move in total:
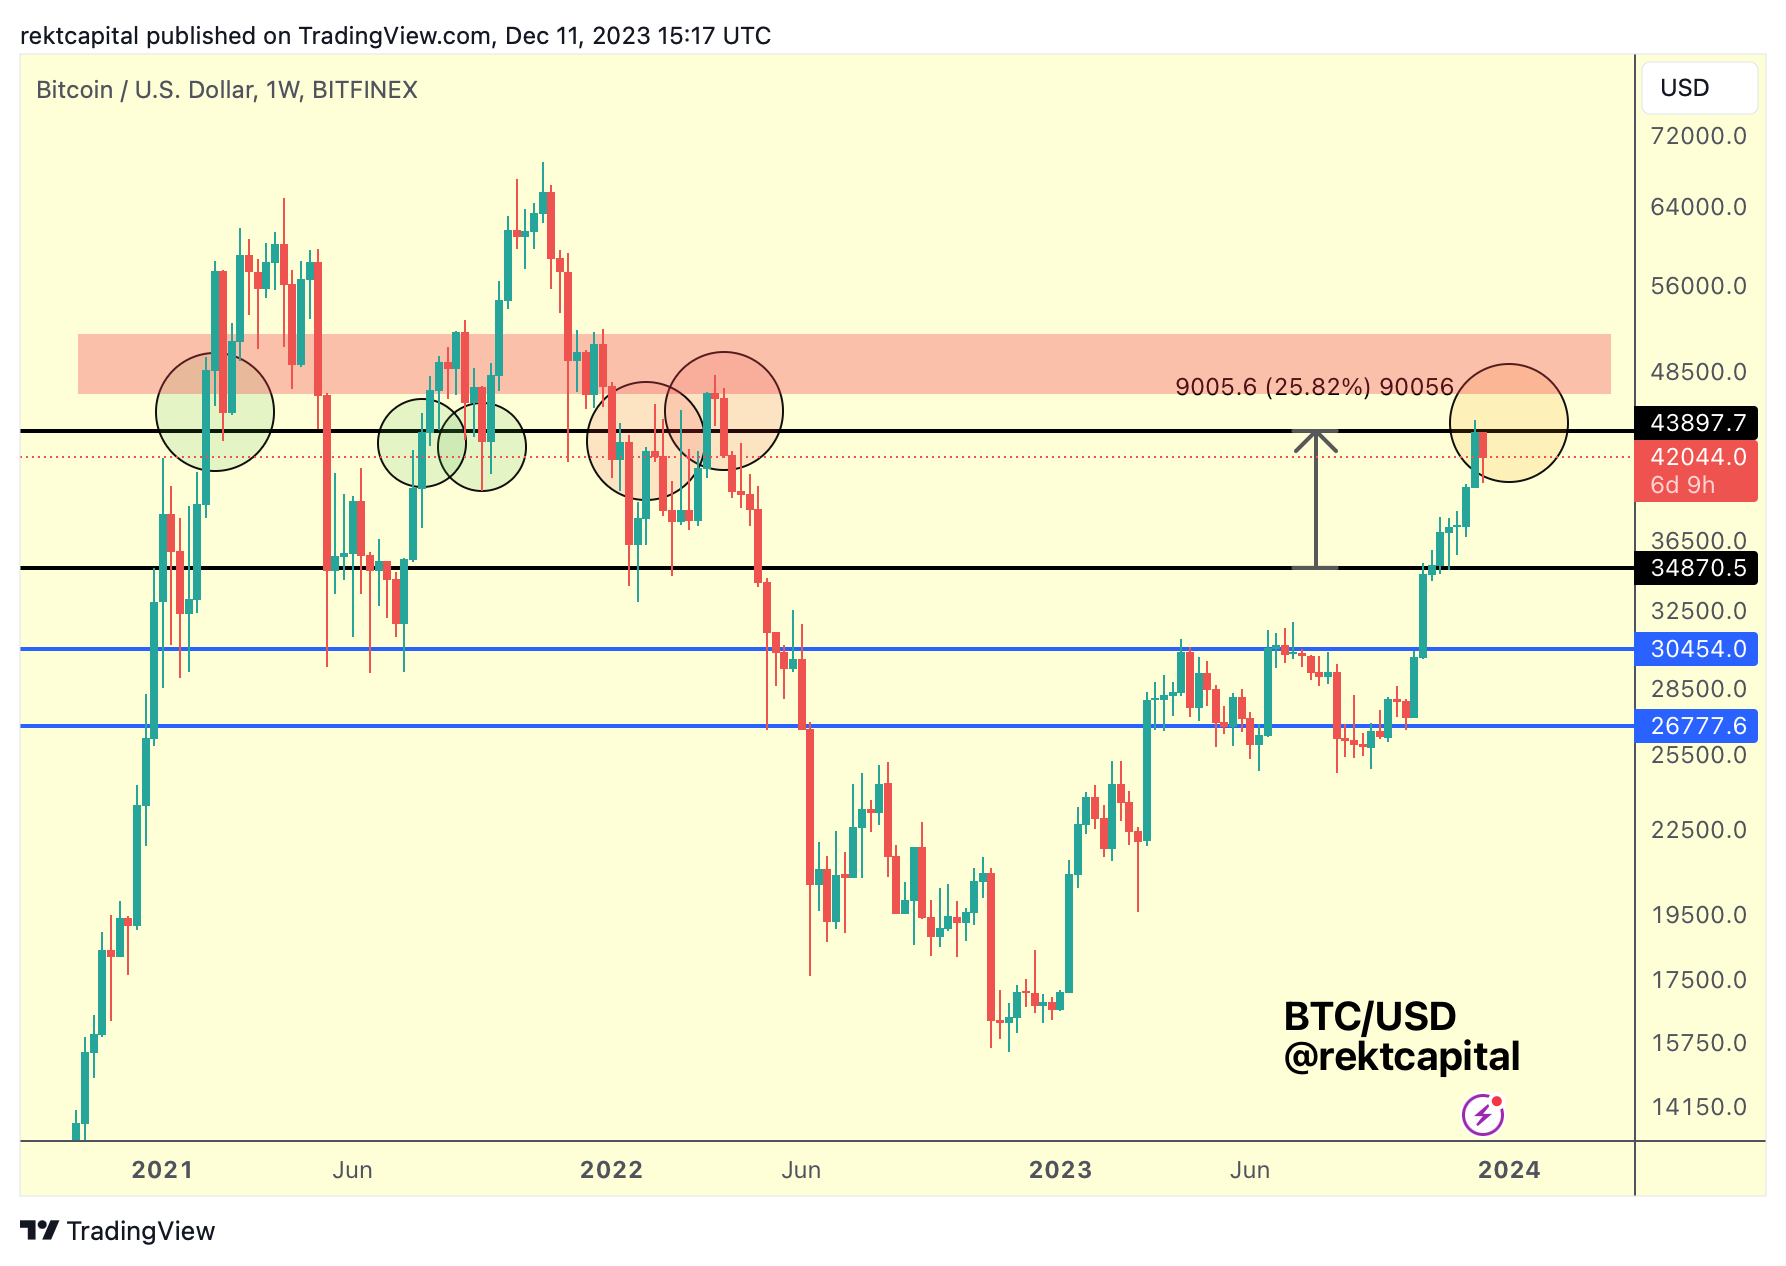
As long as Bitcoin continues to stay below the Range High, price will continue to occupy the ~$35000-$44000 Macro Range.
There are a few important points of confluence suggesting that the Range High here, or at least the ~$46000 area in general, could be a strong resistance going into 2024.
Here's why.
Four Year Cycle Resistance
First of all, this ~$46000 area is a Four Year Cycle resistance:
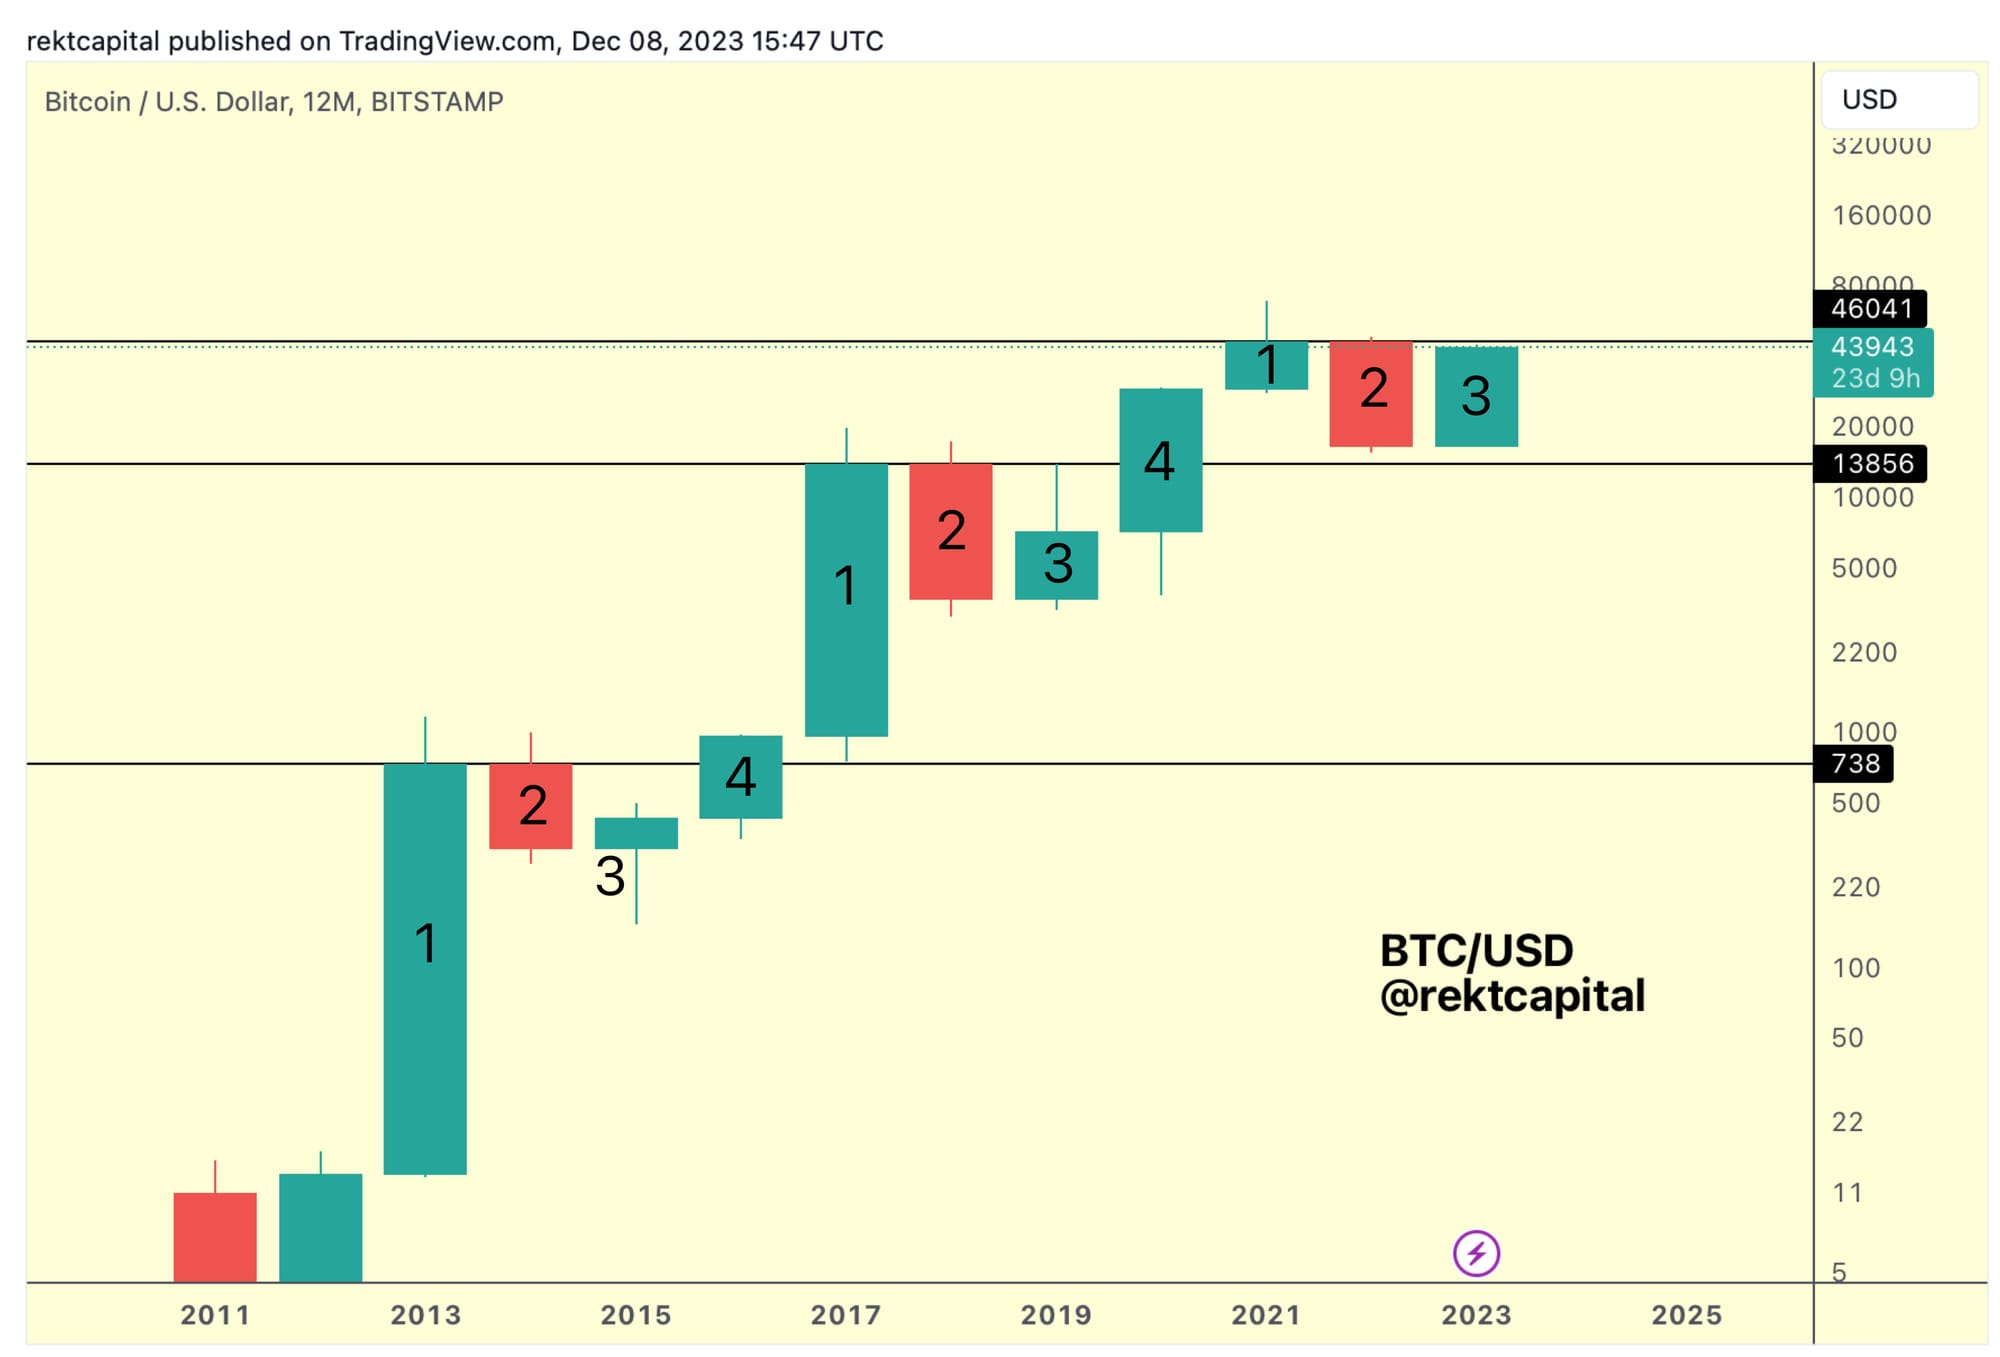
Four Year Cycle resistances tend to act as a strong point of rejection for three consecutive years.
In Candle 1 (Bull Market Peak year), BTC tends to produce an upside wick beyond this new Four Year Cycle resistance (black) to form the new All Time High before ultimately beginning a new Bear Market.
In Candle 2 (Bear Market year), this is where BTC tends to reject strongly in a deep correction that lasts around 365 days.
In Candle 3 (Bottoming Out year), price rebounds strongly however doesn't always revisit the Four Year Cycle resistance (e.g. 2015) though rejects from it when it does (e.g. 2019).
It is only until Candle 4 (Trend Reversal year) where BTC successfully breaks beyond this Four Year Cycle resistance.
From this, we can understand that BTC will break beyond $46000 in 2024, most likely after the Halving.
But another important point can be gleaned from a Candle 4 and that's that price tends to produce long downside wicks in the beginning of the Candle 4 year.
This long downside wick forms a Higher Low relative to the bottom of Candle 3, like so:
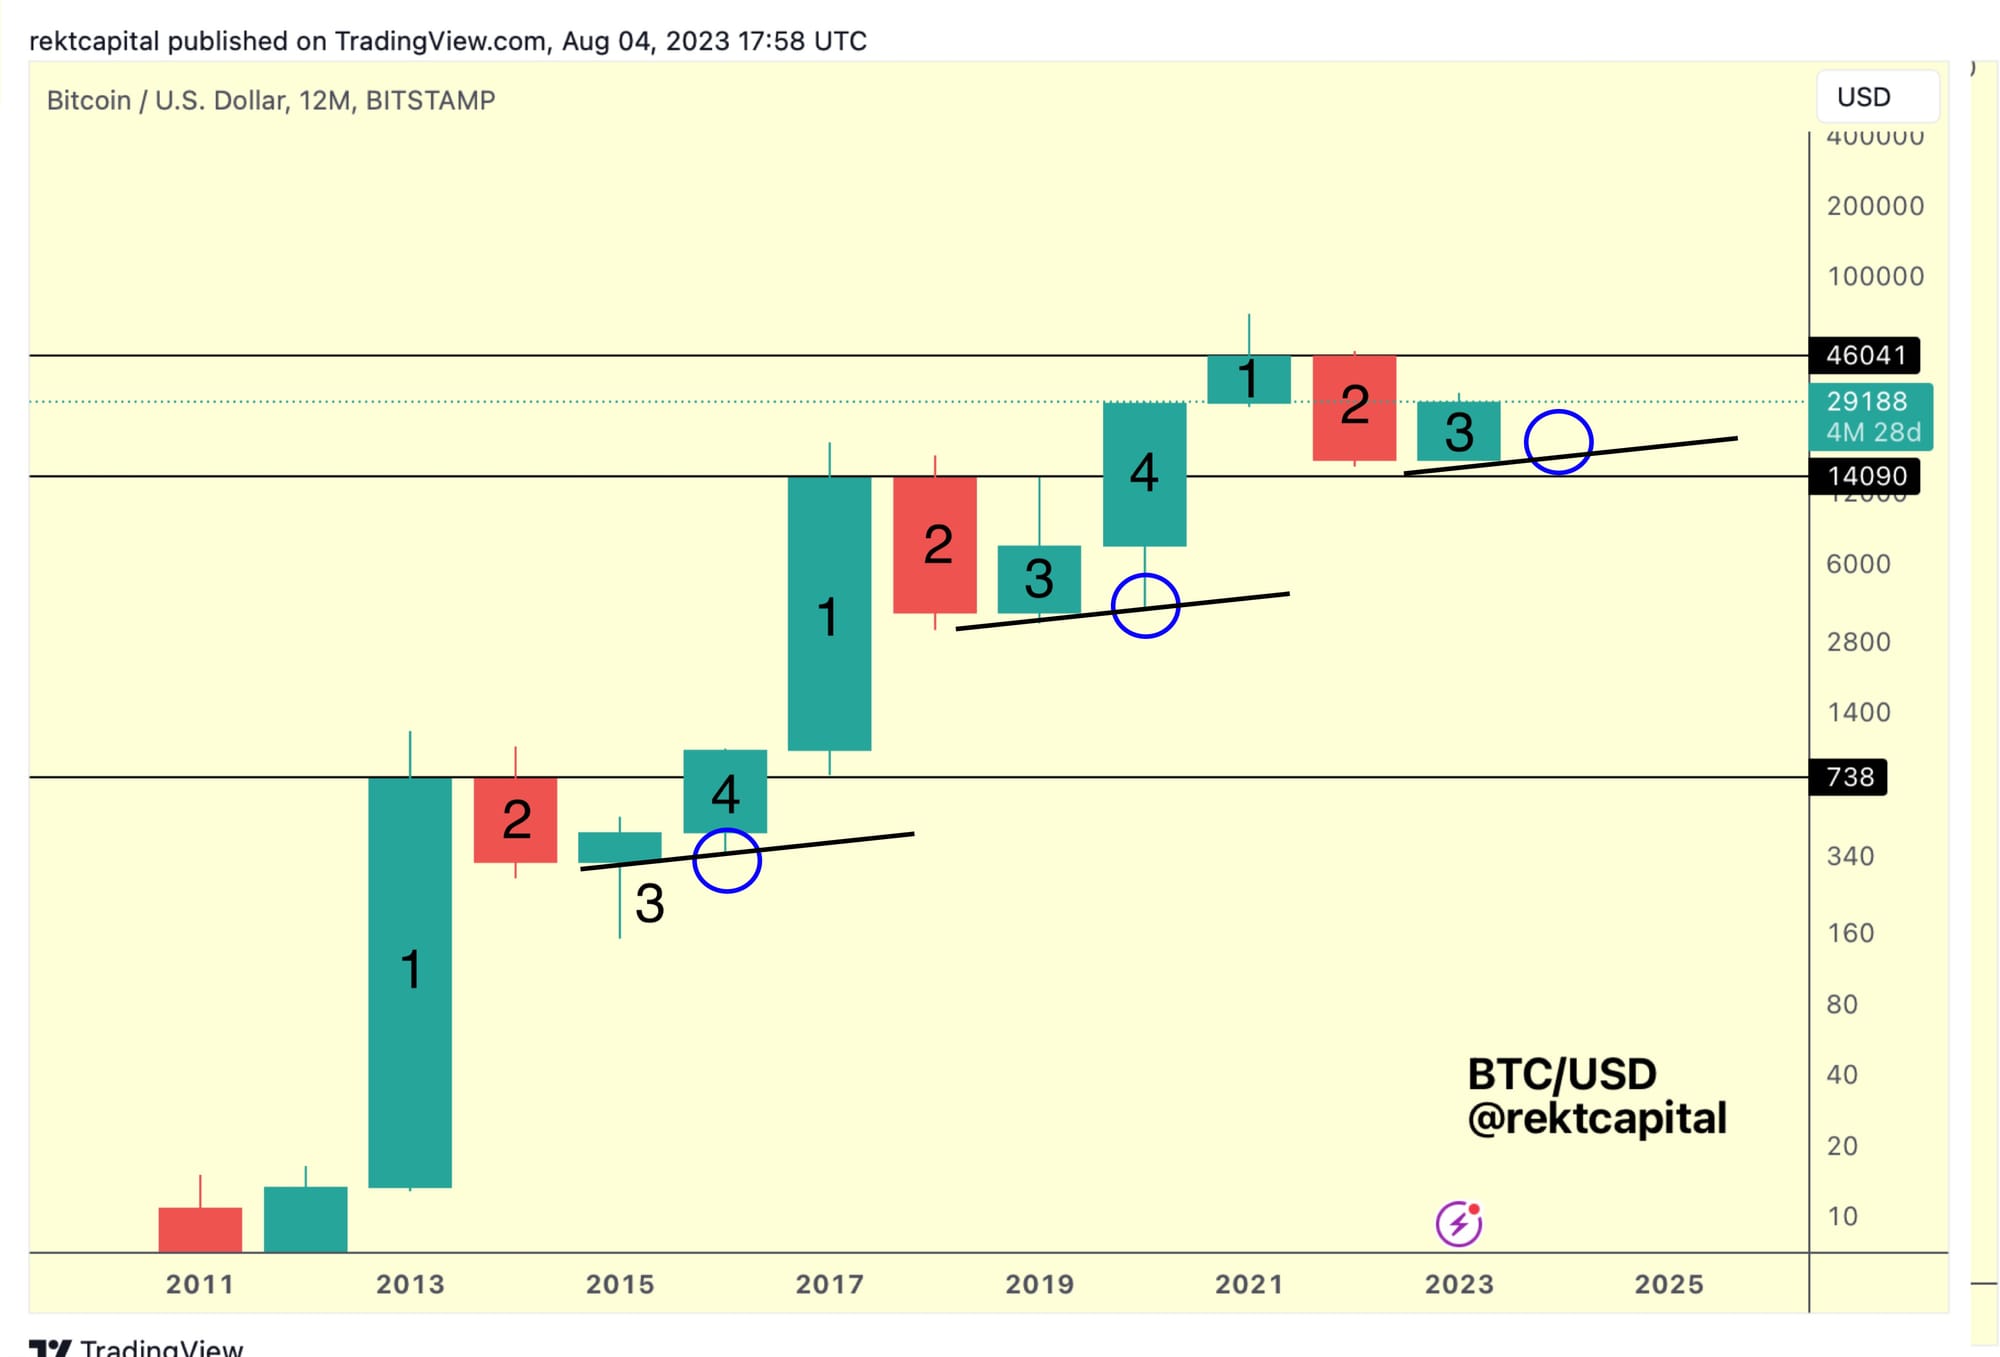
However, of course, since the August 2023 chart Bitcoin has gone up considerably and therefore may change where the bottom could be on a potential downside wick in early 2024.
In other words, perhaps the Macro Higher Low could be a bit higher, sloping at a sharper angle.
Nonetheless, the takeaway here is that any deeper retrace going into the Halving would be one of the last bargain-buying moments for Bitcoin before it enters its Post-Halving parabolic uptrend.
And if BTC fails to break beyond the $46000 level resistance this year, there's a risk of a "Buy the Hype, Sell the News" effect around the Bitcoin ETF news in January that could prompt a pullback.
Perhaps that could be a recipe for a pullback; another possibility would be if the ETF is postponed again, for some reason, and isn't ultimately approved in January 2024, like many in the space seem convinced will be the case.
And of course - people could argue that this cycle is different altogether, because of the ETF and there is merit to that argument.
But here are two tweets from late 2022 which just confirm that this cycle has been no different thus far.
One tweet to mark the Bear Market bottom:
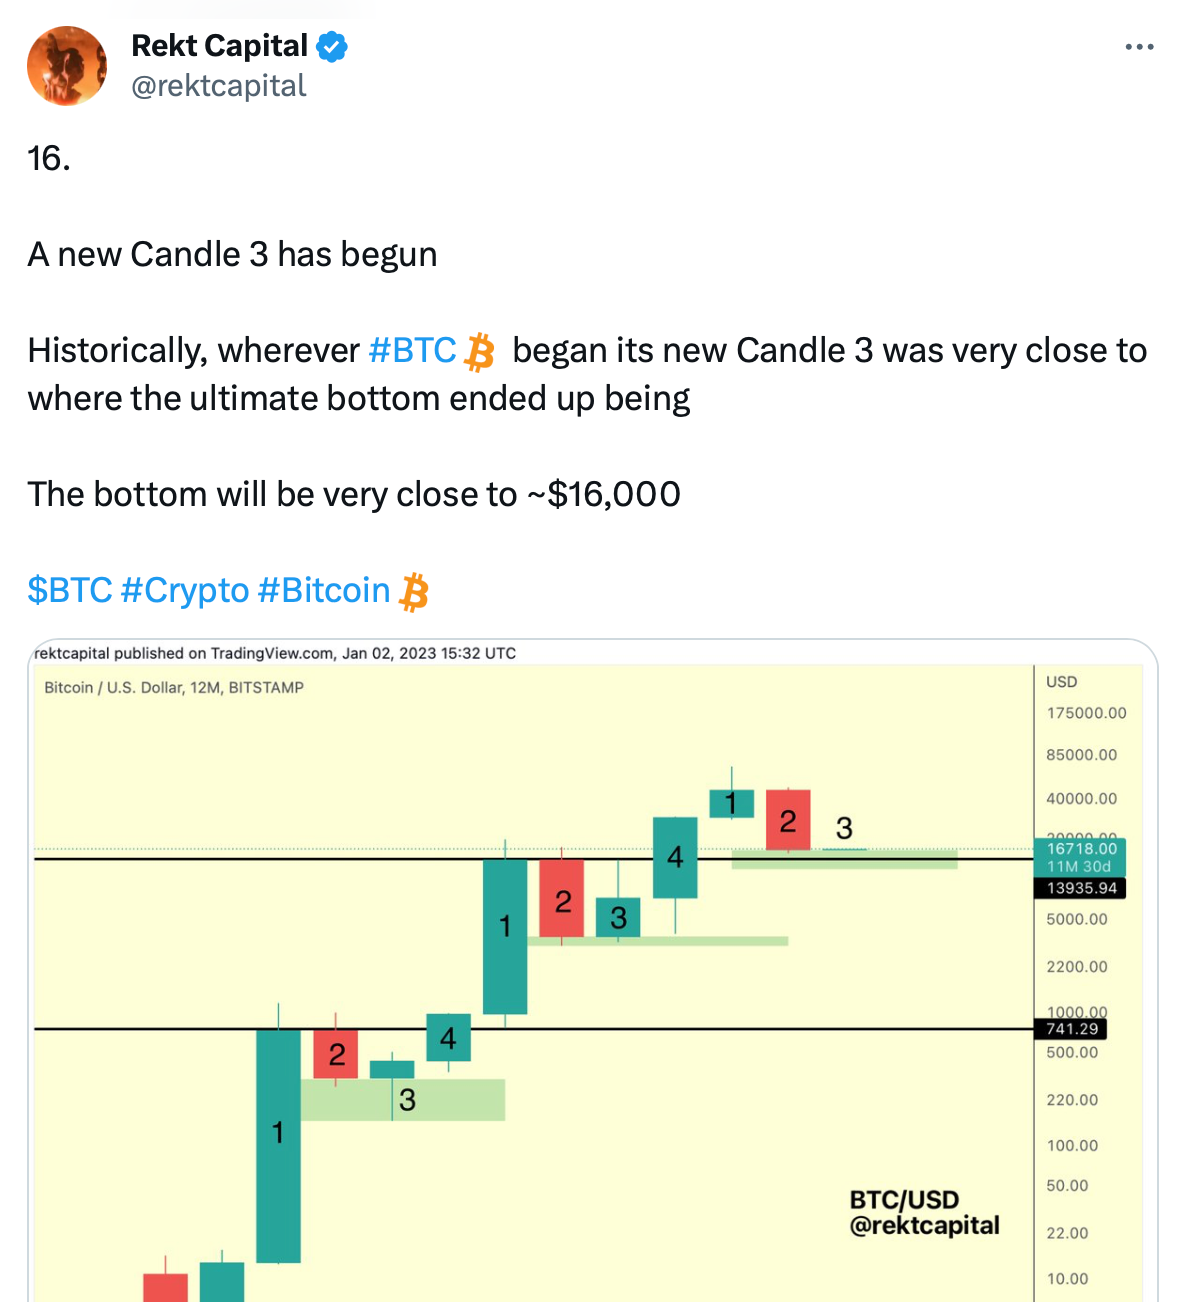
And one to predict the rally to ~$46000:
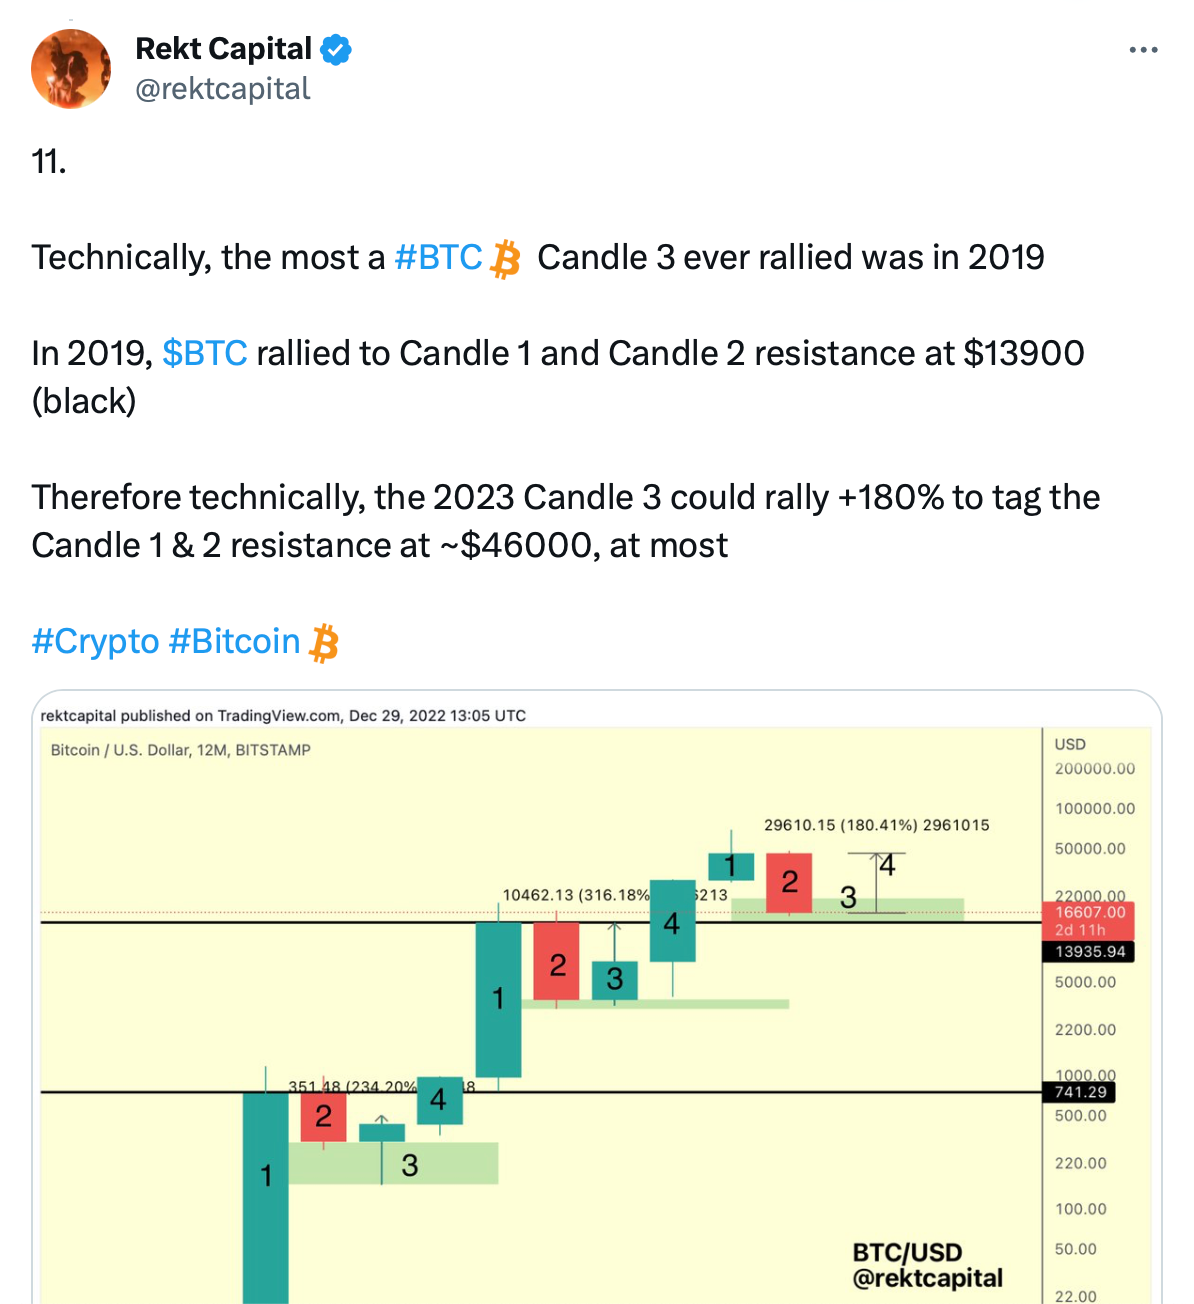
And it's because of the historically recurring tendencies in Bitcoin's price action that it's at least worth being open to the scenario of any possible downside in early 2024, in the Pre-Halving period.