Bitcoin - Limited Relief Before Extended Downside?
Understanding short-term strength in the context of long-term macro weakness
Welcome to the Rekt Capital Newsletter, a resource for investors who want to better navigate the crypto markets with the help of cutting-edge crypto research and unbiased market analysis.
The 200-Week EMA: Still Technical Resistance
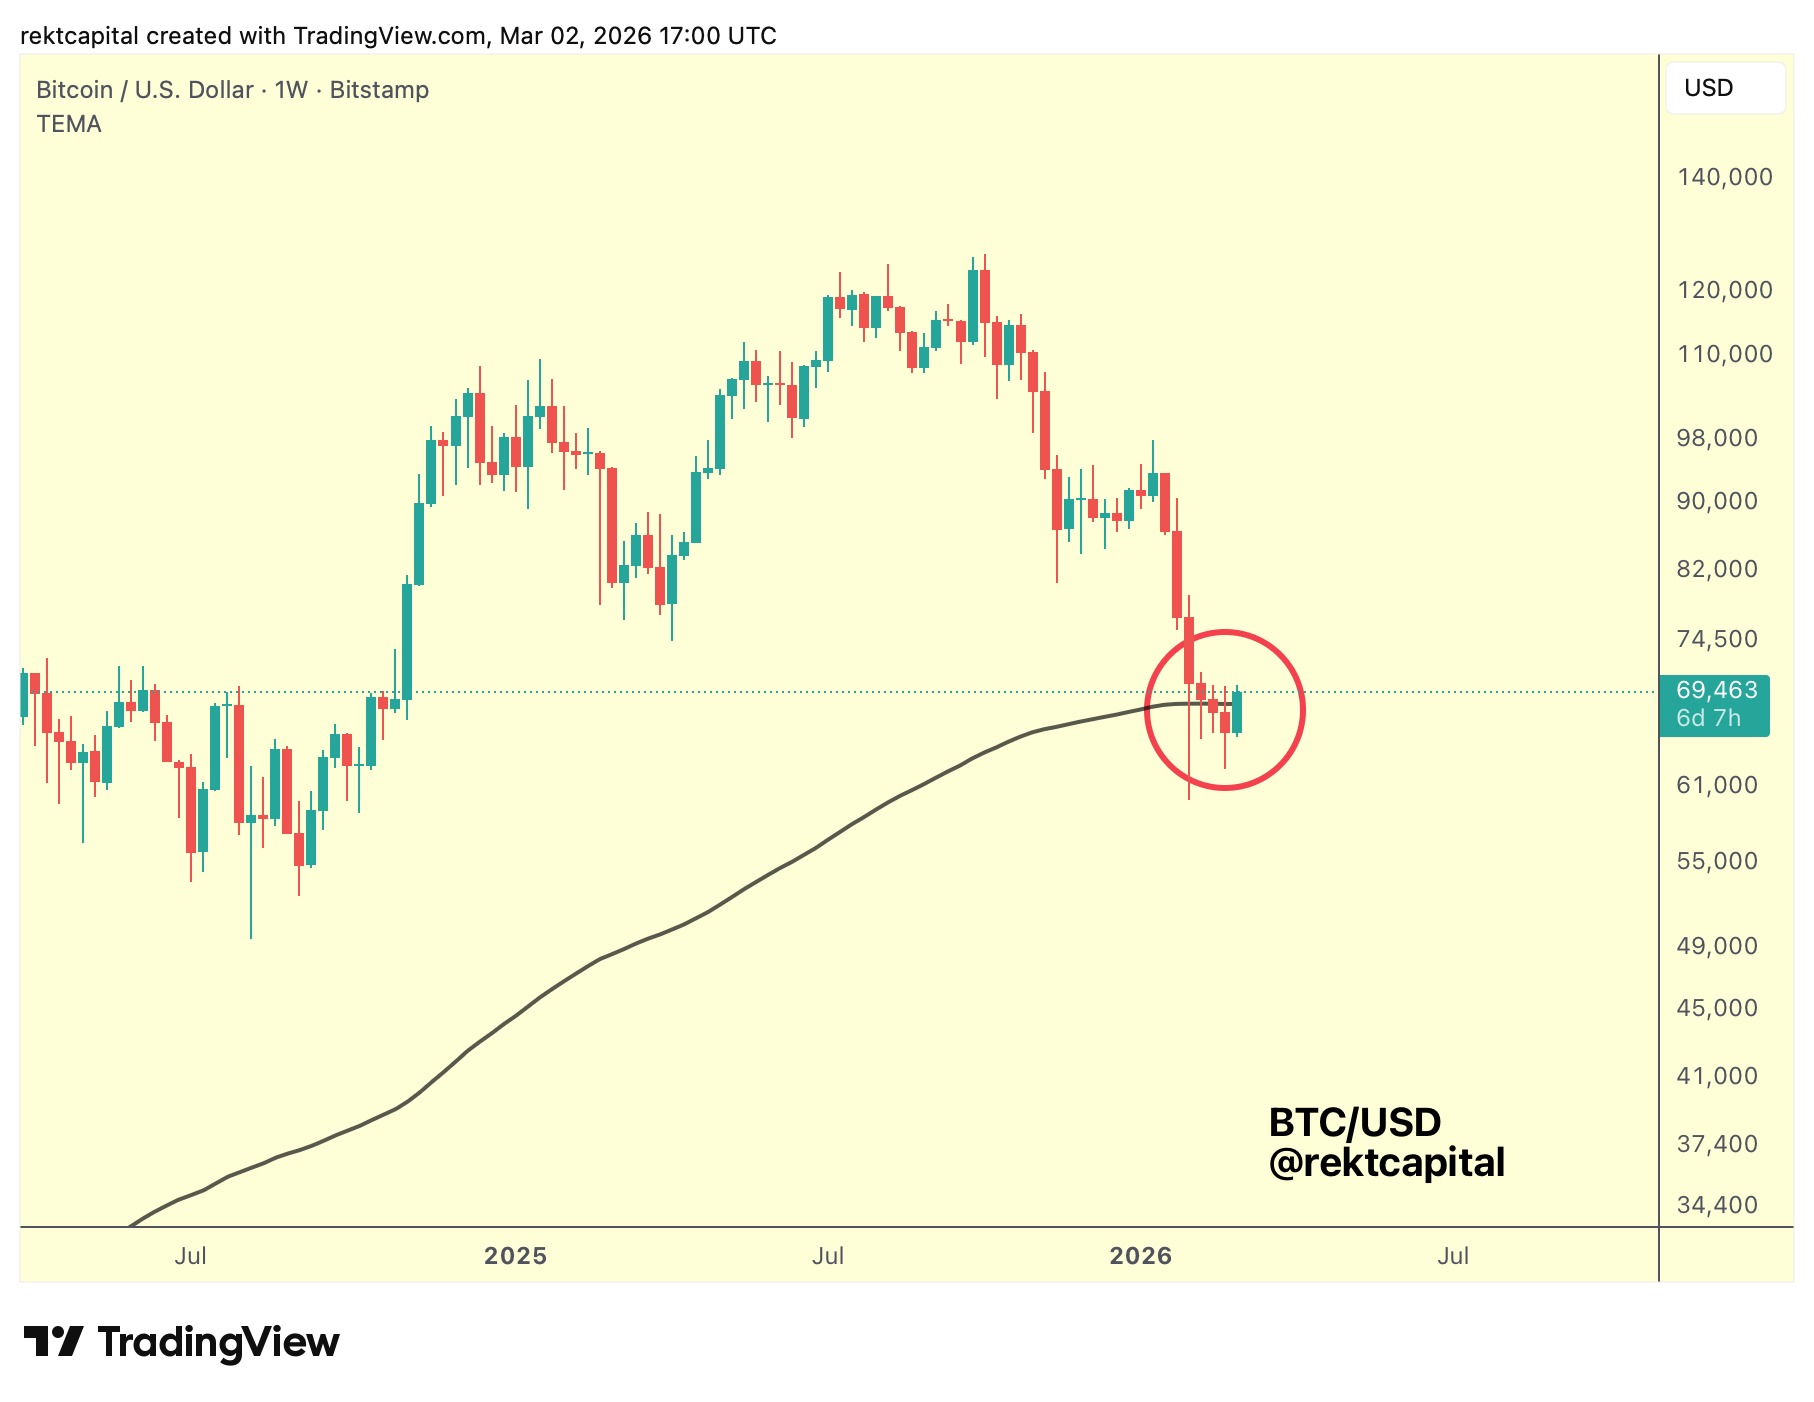
Bitcoin has registered yet another consecutive Weekly Close below the 200-week EMA which solidifies the price positioning as technically bearish; the 200-week EMA continues to act as resistance.
However, indeed price has seen a bit of upside, stretching even a little bit beyond the EMA.
That said, the Weekly Candle from last week also produced limited upside beyond the EMA before ultimately Closing beneath it to register it as resistance.
Unless price manages to Weekly Close back above the EMA to post-breakout retest it as support to then confirm upside, the EMA is a technical resistance, until proven otherwise.
Such a scenario where BTC would reclaim the EMA as support at this stage of the cycle would go against the grain of history when it comes to historical price behaviour relative to the 200-week EMA.
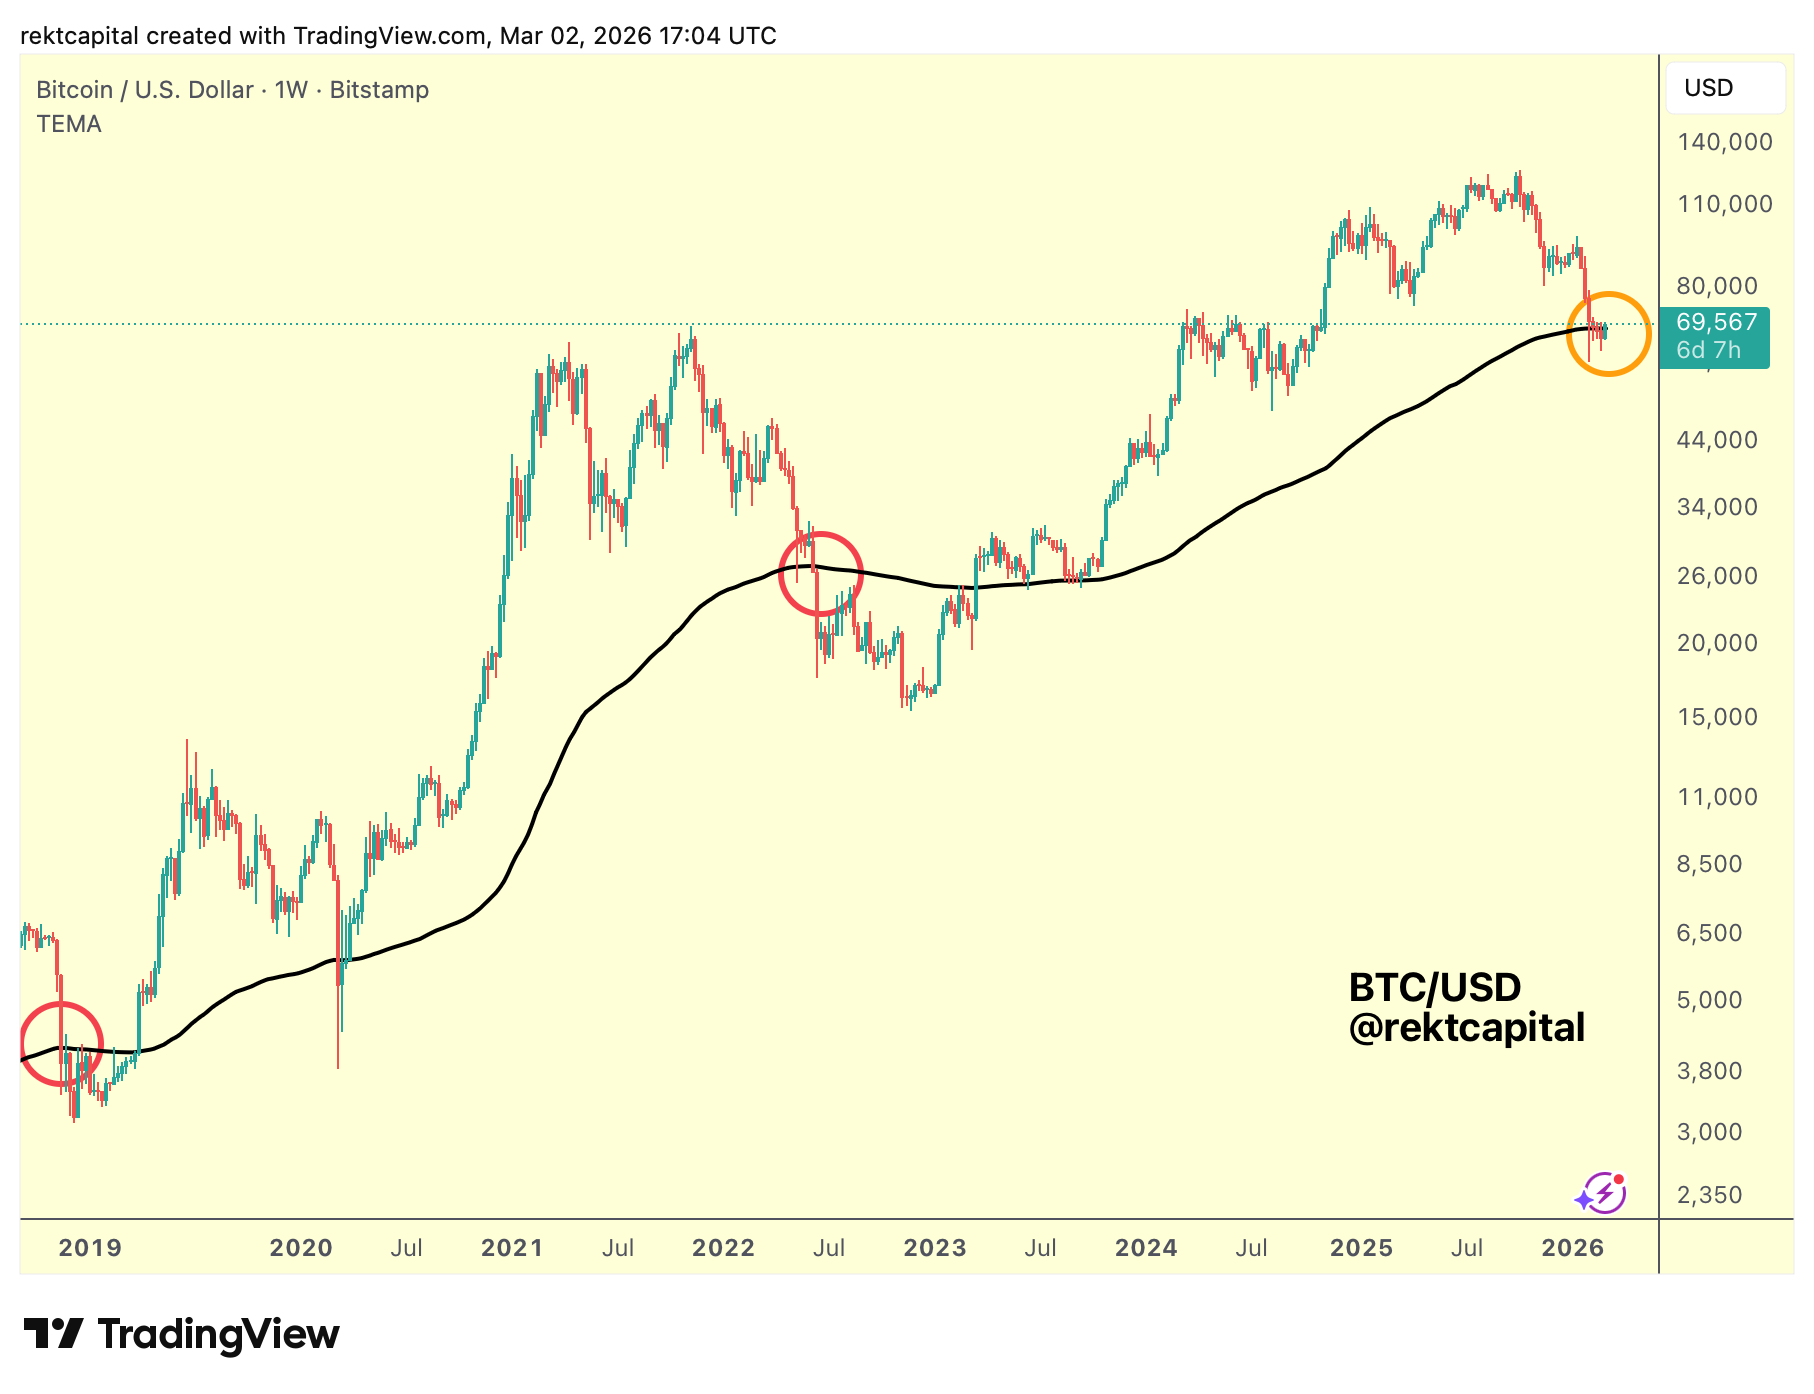
After all, Weekly Closes below the 200-week EMA followed by bearish retests of it into new resistance have historically prompted additional downside for Bitcoin over time.
And in this case, the 200-week EMA is a confluent resistance with the old 2024 All Time High, which Bitcoin recently Monthly Closed below this past February:
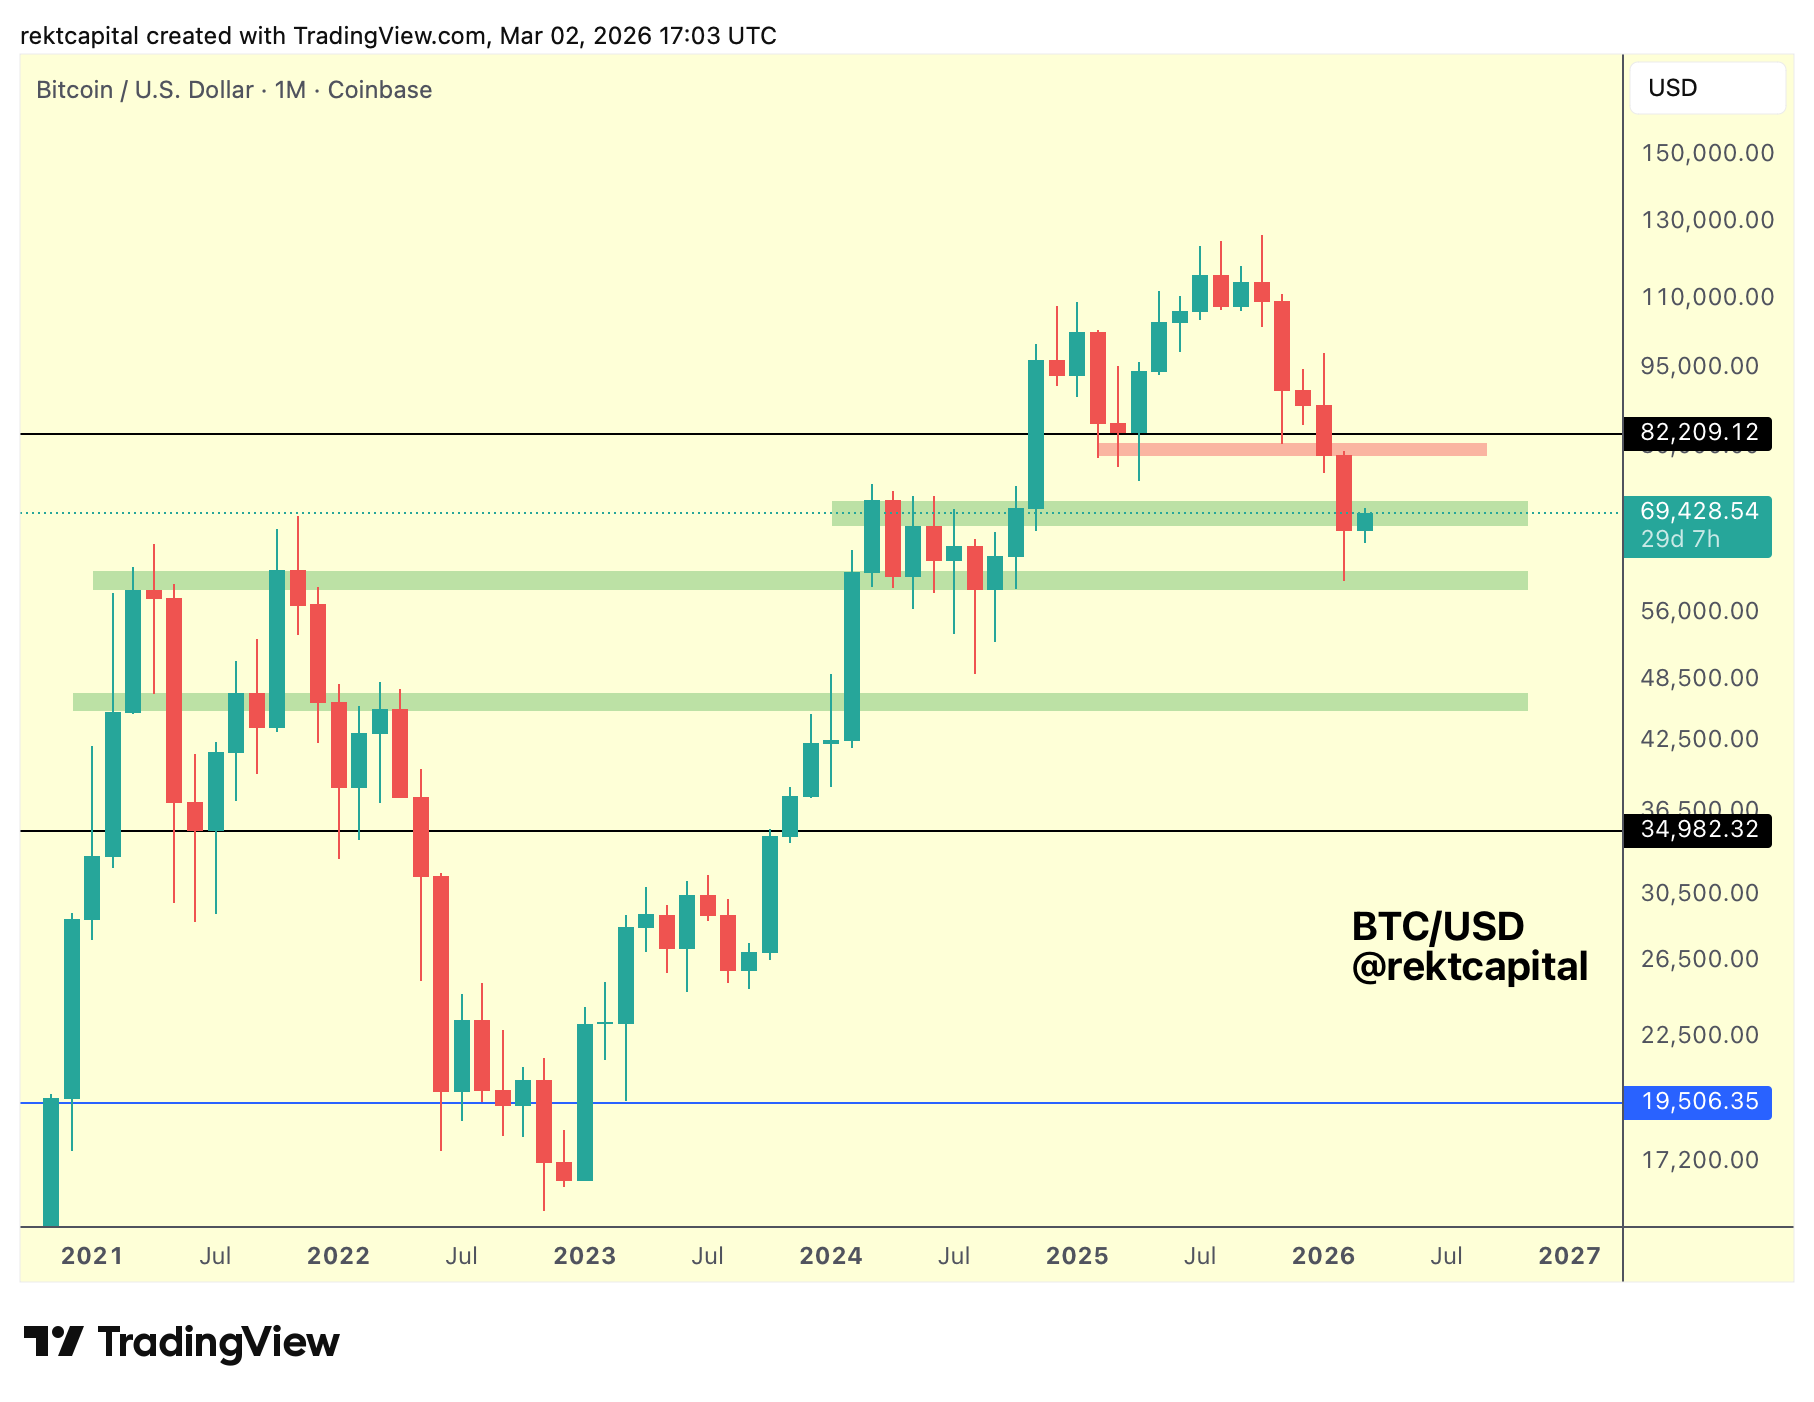
The Monthly Close below the old 2024 All Time High (green) means price has lost this area as support and this current uptick could turn it into new resistance, especially if it can't clear the $73k-$74k region which is where the 2024 old All Time High upside wicks went before rejection over the Summer that same year.
And in fact, this is something we discussed last week:
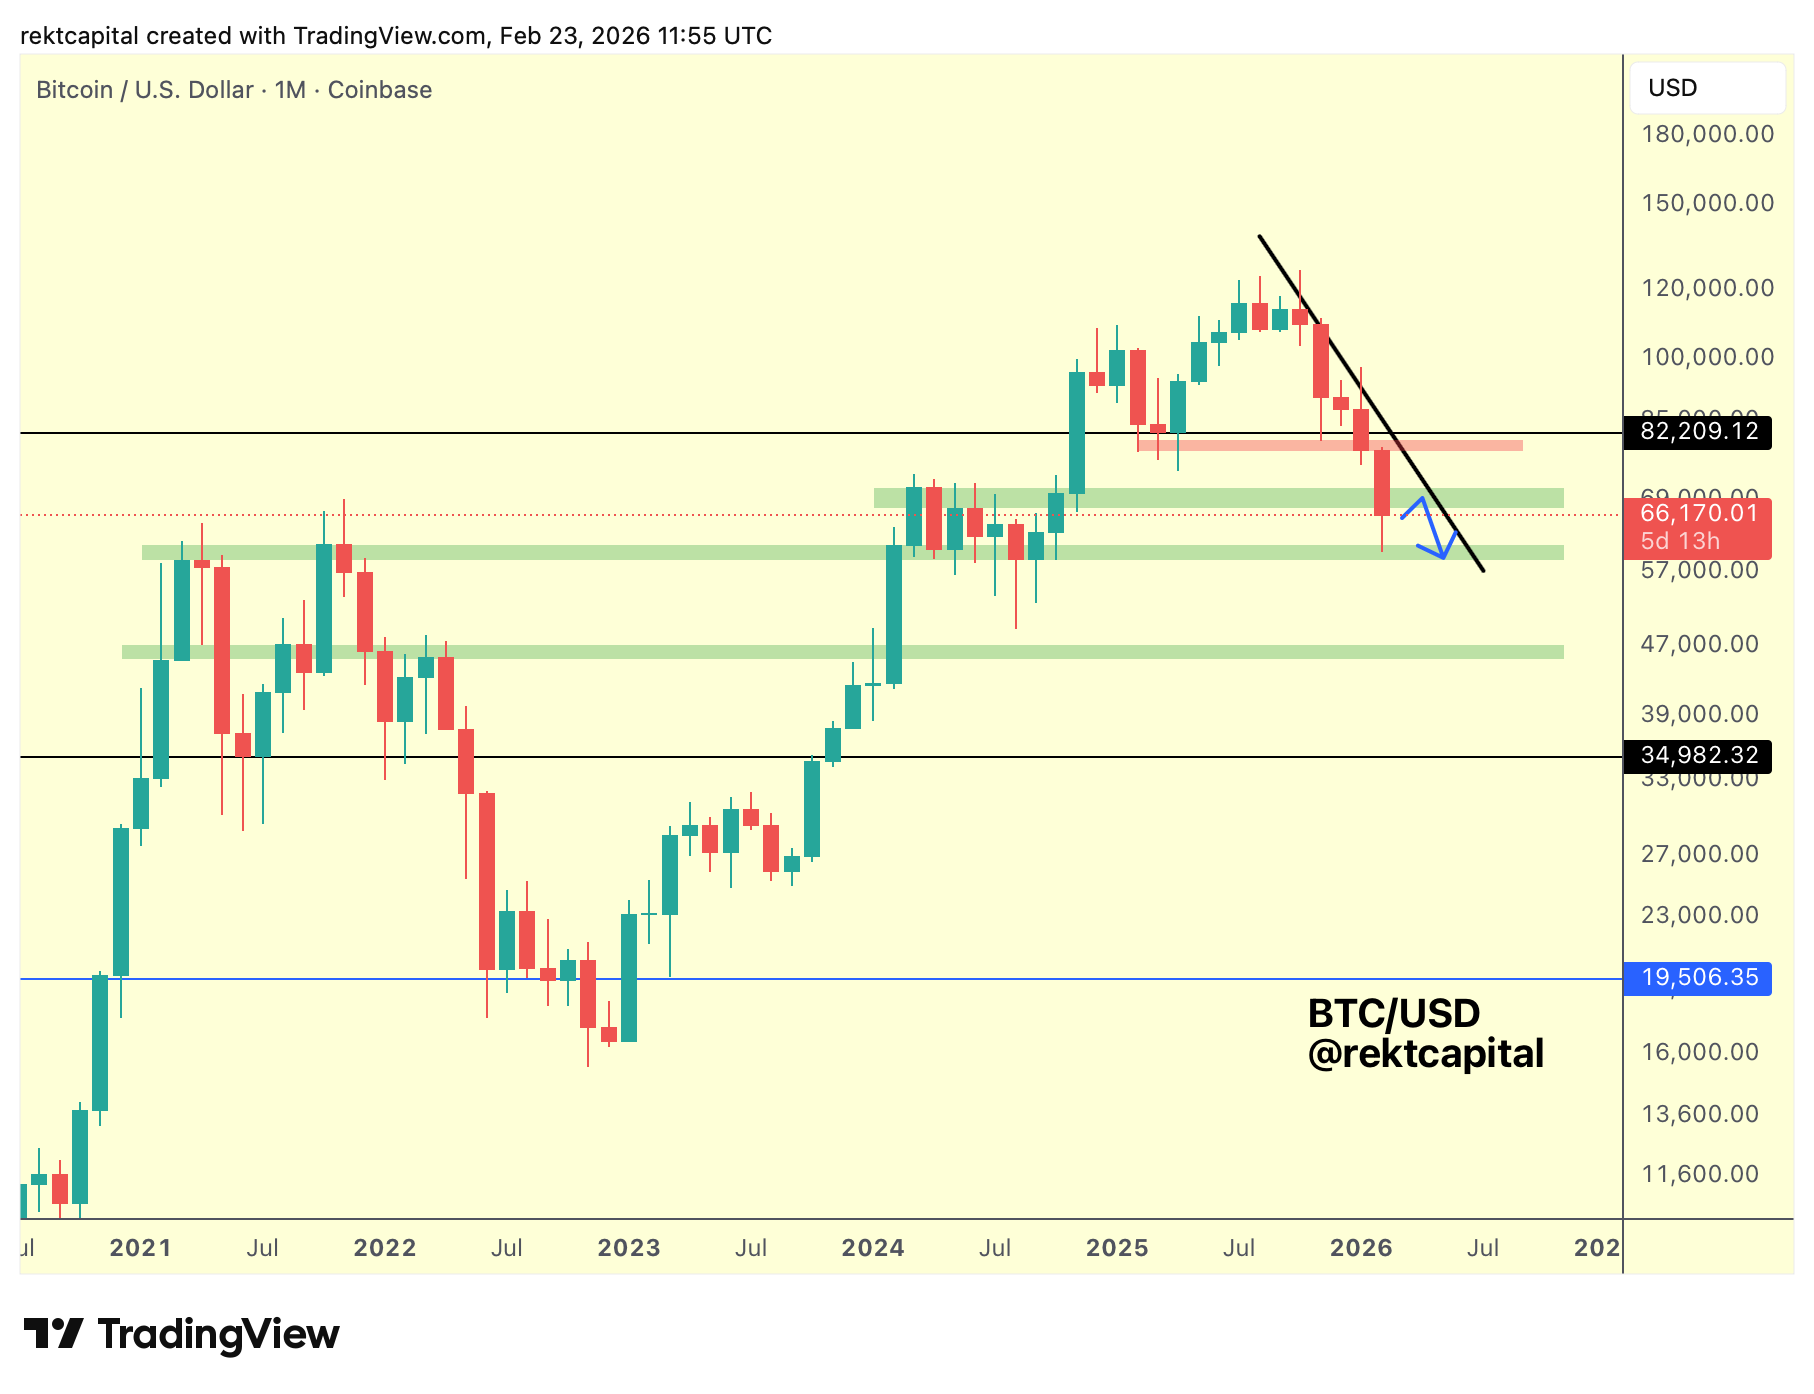
If the rebound from the low $60ks fails to generate any meaningful upside and turns the low $70ks into new resistance, then price could indeed follow the blue path that would price revisit the low $60ks.
Because after all, what is price trying to tell us?
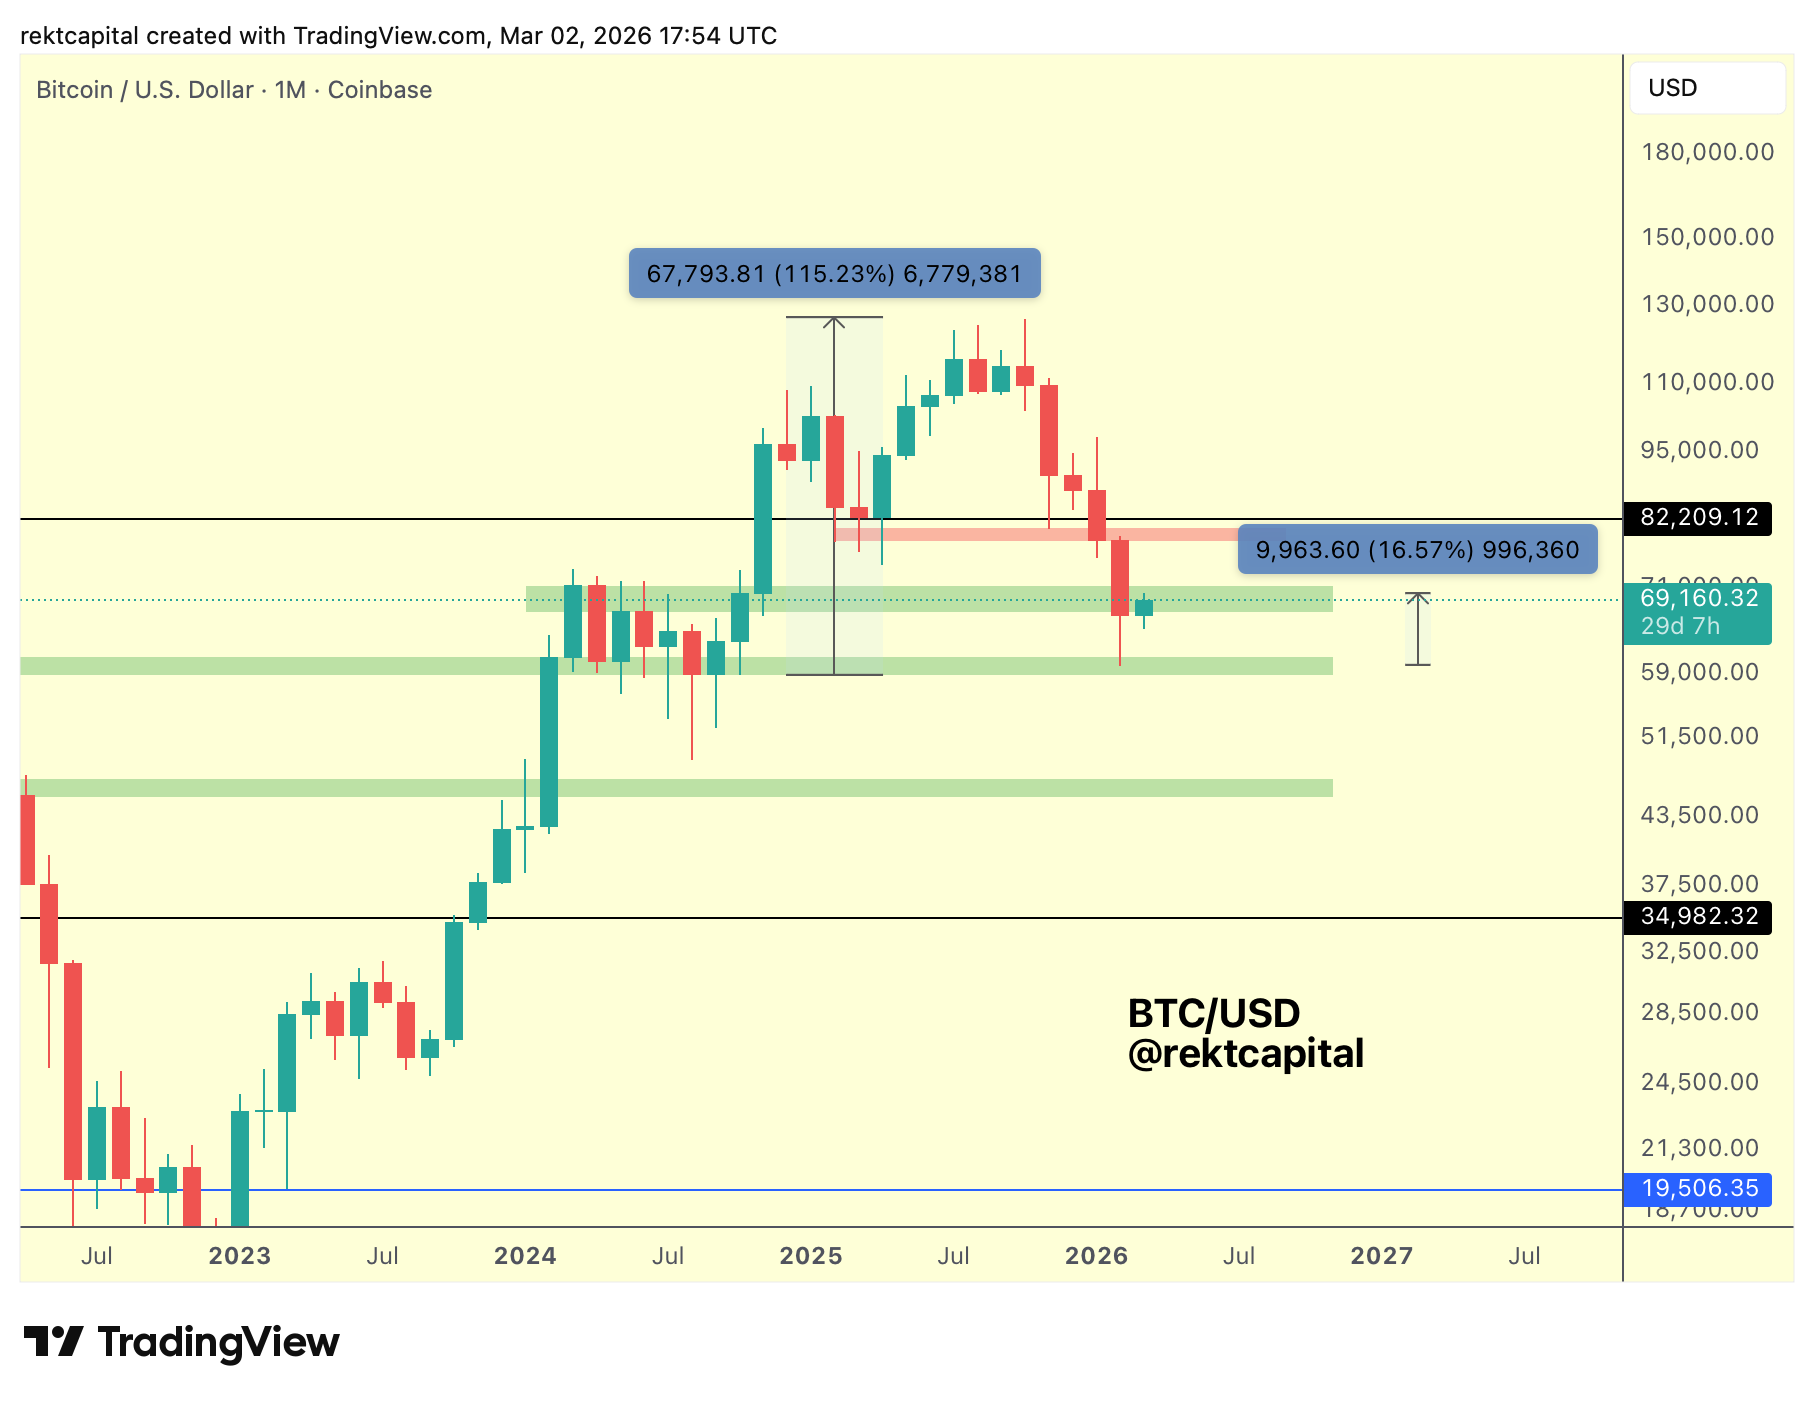
In 2024, Bitcoin was able to rally from the low $60ks to new All Time Highs in Q4 of 2025, enjoying a move of +115% in total.
Whereas this current rebound from the same historical order block has generated only a +16% move thus far.
Of course, it's obviously a little too early to compare these two moves, but the point is that price could very easily produce a much lesser rally from here to demonstrate that this historical order block is running out of buy-side liquidity.
Thus, a weak rally from here would be a sign that this green region could lapse as a support in the future, after any sort of limited upside rally from here.
And if the old 2024 All Time High acts as resistance given how price Monthly Closed below this region, that could hamper the magnitude of this current relief move and the sell-side pressure here could weigh down on price.
It's really important to monitor the price upticks in Bitcoin's price and question them: is price turning old supports into new resistance?
This has been the case for months thus far and there's scope for this tendency to continue.