Bitcoin – Early Bear Market Signals?
What to watch out for
Welcome to the Rekt Capital Newsletter, a resource for investors who want to better navigate the crypto markets with the help of cutting-edge crypto research and unbiased market analysis.
Weekly Range Holding Above Support
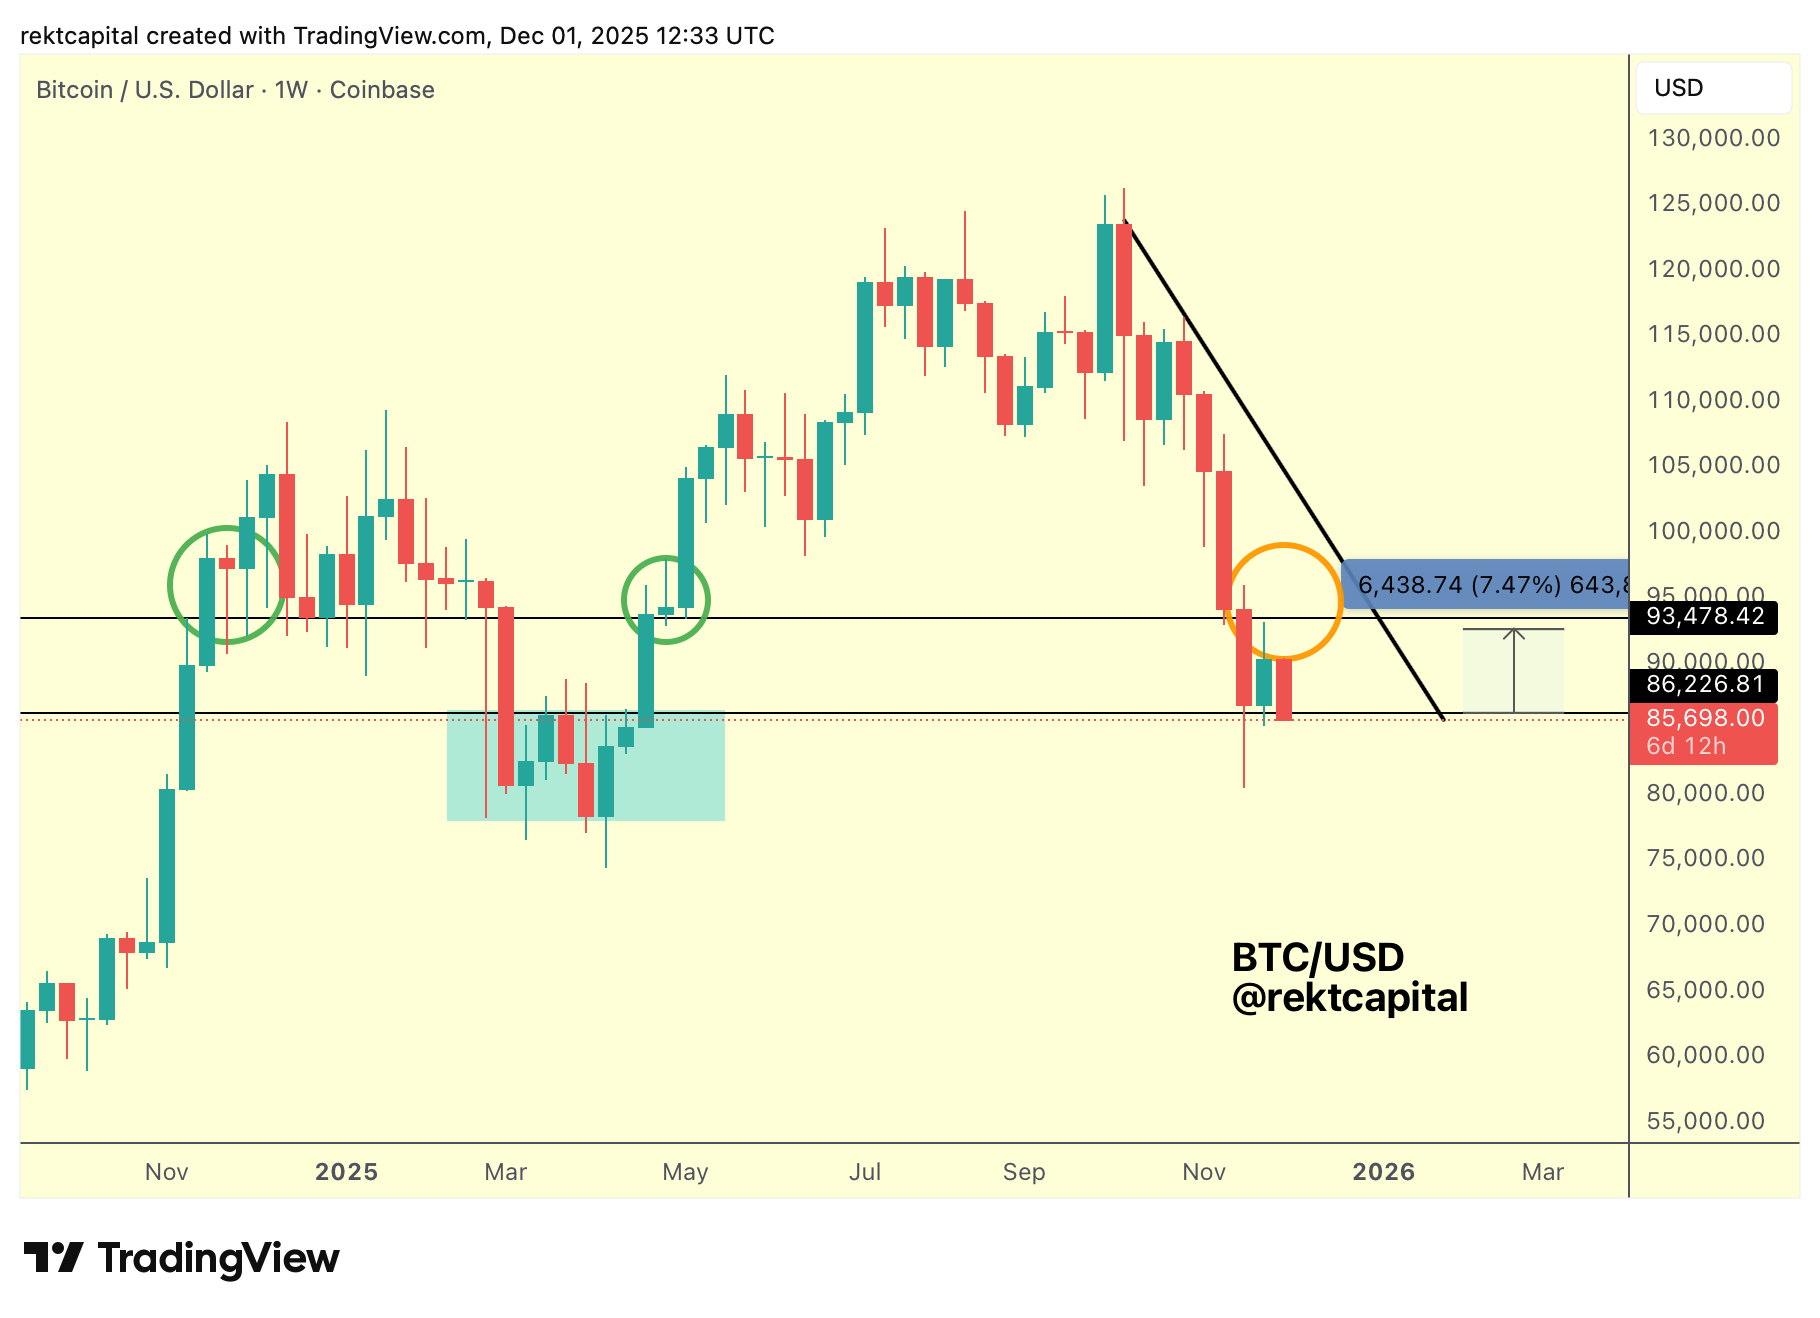
Bitcoin continues to stabilise within its Weekly Range, maintaining its position above the Range Low at $82,226 (black line), which marks the very top of the earlier liquidity cluster highlighted in turquoise.
This level formed the upper boundary of the lower-low structure that developed around the 50-Week EMA in early 2025, and price has repeatedly tapped this region, producing three downside wicks into the same pool of liquidity.
Each of these wicks has been followed by a Weekly Close above the Range Low, preserving this area as a functioning support.
Last week’s Weekly Close above the Range Low enabled a relief move toward $93,500 (black, Four-Year Cycle Level), but that level acted as clean resistance.
It represents prior support turned into resistance, and Bitcoin’s first approach into it resulted in a clear rejection.
Price has since rotated lower, but remains anchored at the Weekly Range Low, sustaining the broader consolidation.
Maintaining stability around this level is important because further downside wicking into the turquoise cluster is probable, especially over the next few days.
As long as Weekly Closes continue to hold above the Range Low, the consolidation structure remains intact.
This sort of price behaviour helps Bitcoin work toward its next macro decision: either breaking the Weekly Range to approach the macro downtrend at higher levels, or continuing to consolidate nearer the bottom of the range and eventually challenging that same downtrend from a lower position.
Meanwhile, Bitcoin continues to trade beneath a sharply declining Macro Downtrend that has been dictating resistance throughout this phase of the cycle.
The slope of this trendline is highly dynamic.
If price were to break out today, the downtrend would be positioned around $105,000, whereas a breakout attempt closer to year-end would encounter the same trendline near $93,500, highlighting how rapidly this resistance descends.
The speed of this decline underscores how aggressive the broader corrective structure has been, with the trendline shedding roughly $10,000 of altitude in a matter of weeks.
This sharpness is confirmed by price behaviour.
Earlier in the move, Bitcoin produced a candle-bodied rejection at the first touchpoint of the trendline, followed by a second rejection via an upside wick.
Most recently, candles have not managed to reach the trendline at all, reflecting increasing downward pressure and the steepening character of the resistance.
The Macro Downtrend continues to compress price action from above, acting as a consistent ceiling for relief rallies emerging from the Weekly Range.
This dynamic creates two scenarios for any attempt to challenge the downtrend.
A breakout soon would require reclaiming higher price levels, whereas a later attempt would meet the trendline at lower valuations, narrowing the distance between current price and resistance.
In either case, the Macro Downtrend remains the dominant structural barrier, and Bitcoin’s path forward depends on whether consolidation near the Weekly Range Low can bring price closer to a meaningful test of this sharply descending level.
EMA Convergence and Crossover Risk
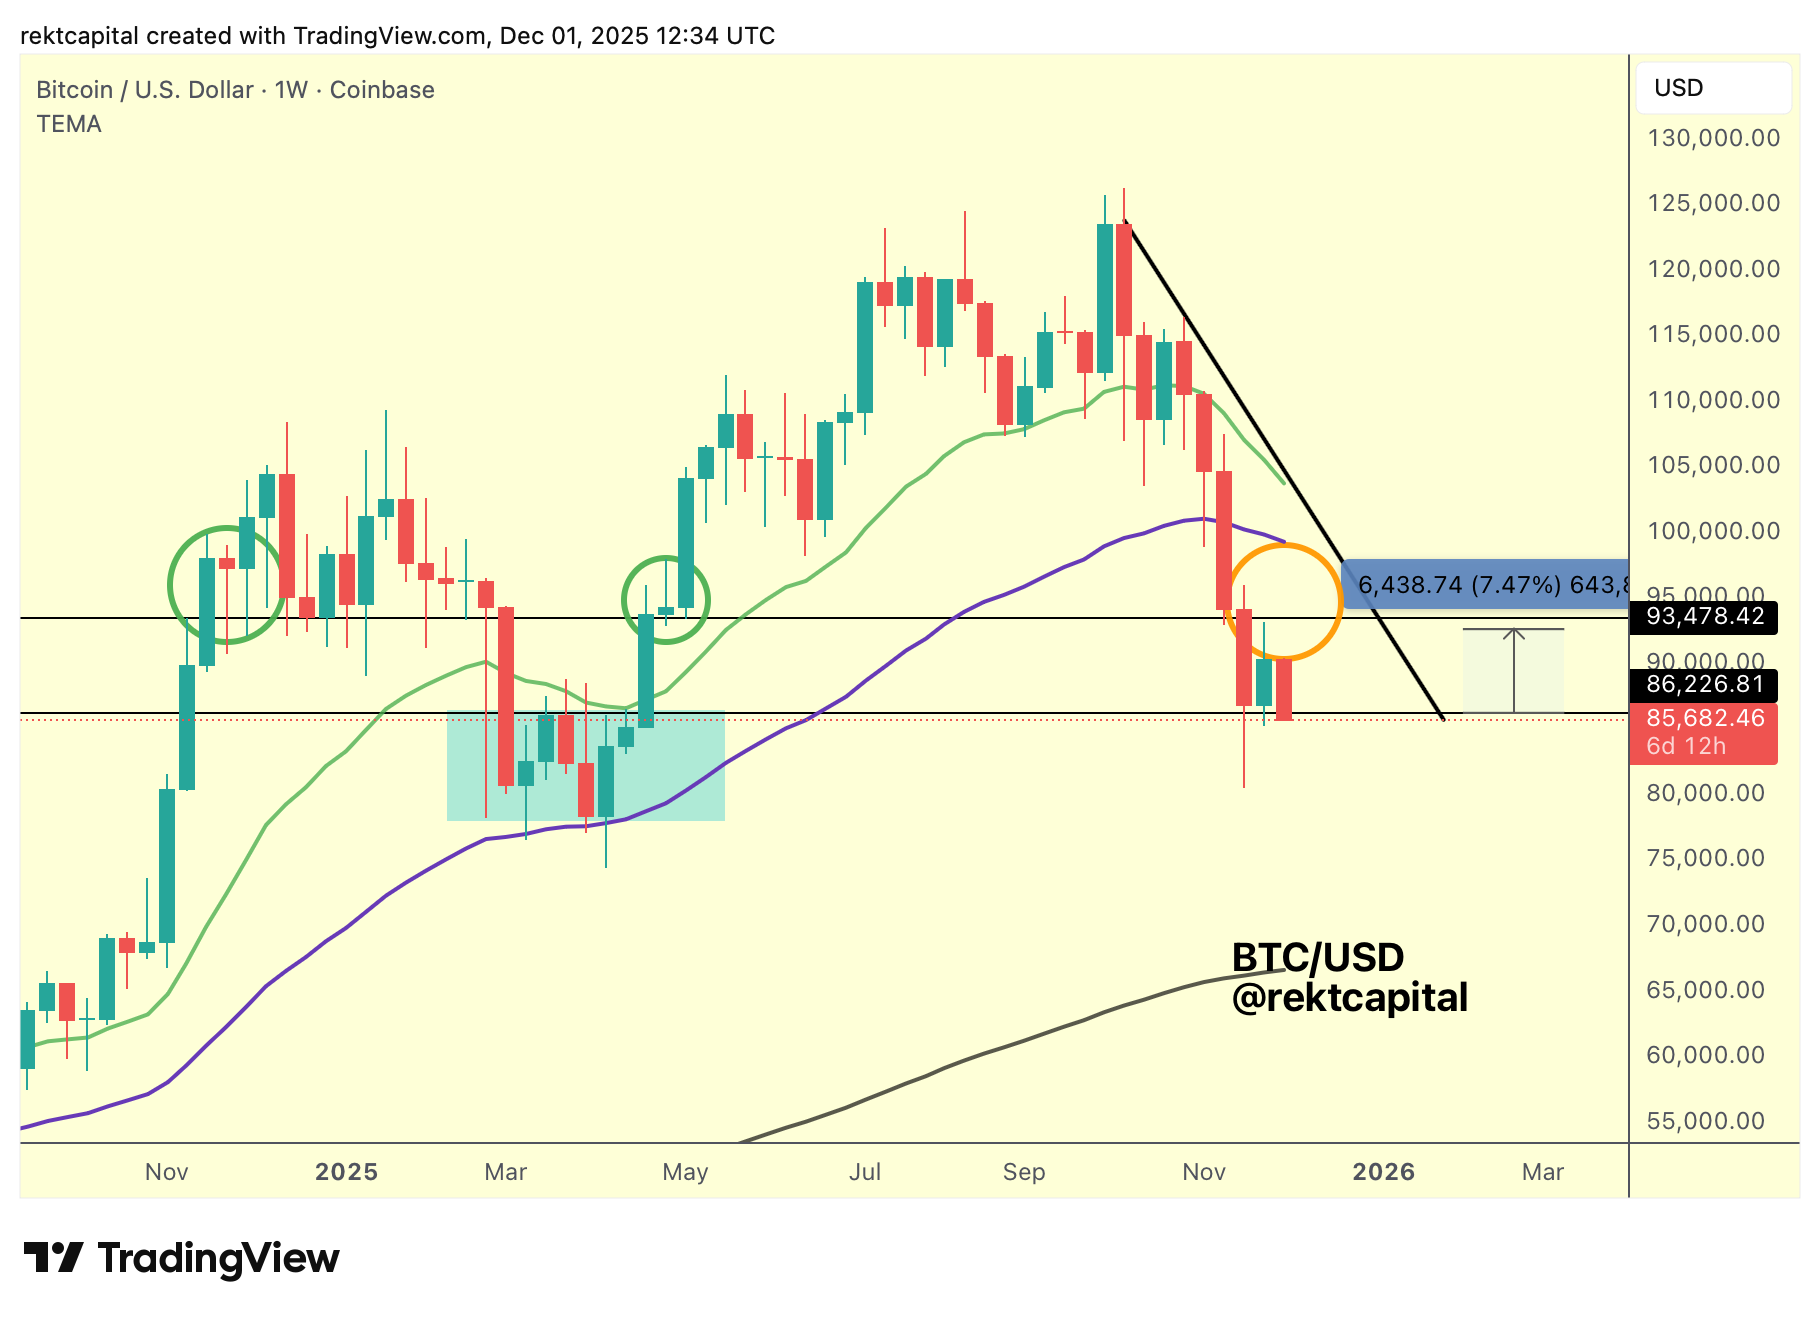
Bitcoin remains positioned below both the 21-Week EMA and the 50-Week EMA, and the distance between these moving averages continues to narrow with each passing week.
This convergence has been developing quickly, reflecting the sharpness of the broader Macro Downtrend and the weakening structure of the current cycle.
Historically, when these EMAs compress and ultimately cross, that crossover tends to precede further downside, though the effect is lagging.
It usually takes several weeks after the crossover for price acceleration to fully unfold, but the implication remains the same: crossover risk is increasing.
The EMAs have begun to mirror the steepening nature of the Macro Downtrend itself.
Earlier in the cycle, Bitcoin was unable to form a new cluster of Higher Lows at the 50-Week EMA, and that absence has become more meaningful as the structure matures.
Now that both EMAs are overhead, they represent potential resistance levels on future relief attempts.
The 21-Week EMA has already served as resistance, while the 50-Week EMA has not yet been tested on the underside, leaving room for a future rejection if price revisits it.
This positioning places Bitcoin in a vulnerable technical environment.
The convergence of the EMAs toward the Macro Downtrend creates a layered zone of resistance that will be difficult to overcome unless price can reclaim one of these moving averages and stabilise above it.
Until that happens, the structure resembles the early-stage clustering seen in prior cycles where EMAs compressed before a broader bearish continuation.
The upcoming weeks will reveal whether Bitcoin can challenge these moving averages or whether this compression will ultimately reinforce the ongoing relief cluster beneath major resistance.