Bitcoin Bounces But Is It Just Relief?
A brief history of historical price tendencies
This Friday, I’ll chart your Altcoin picks in an exclusive subscriber-only TA newsletter and will cover as many as I can. So if you’d like to have an Altcoin charted, feel free to share max. two TA requests each in the comments below.
I’ll chart the Altcoins that get mentioned and ‘Liked’ the most.
A few days ago, I posted a thread on Twitter analysis the space/separation between two pivotal moving averages in an effort to understand more about how the period of maximum financial opportunity forms for Bitcoin, based on historical price tendencies.
In today’s edition of the newsletter, I’ll take it a step further.
I’ll analyse key technical periods that have been historically relevant to each cycle.
And the similarities are actually quite astounding.
Let’s dive in.
Between Two Moving Averages…
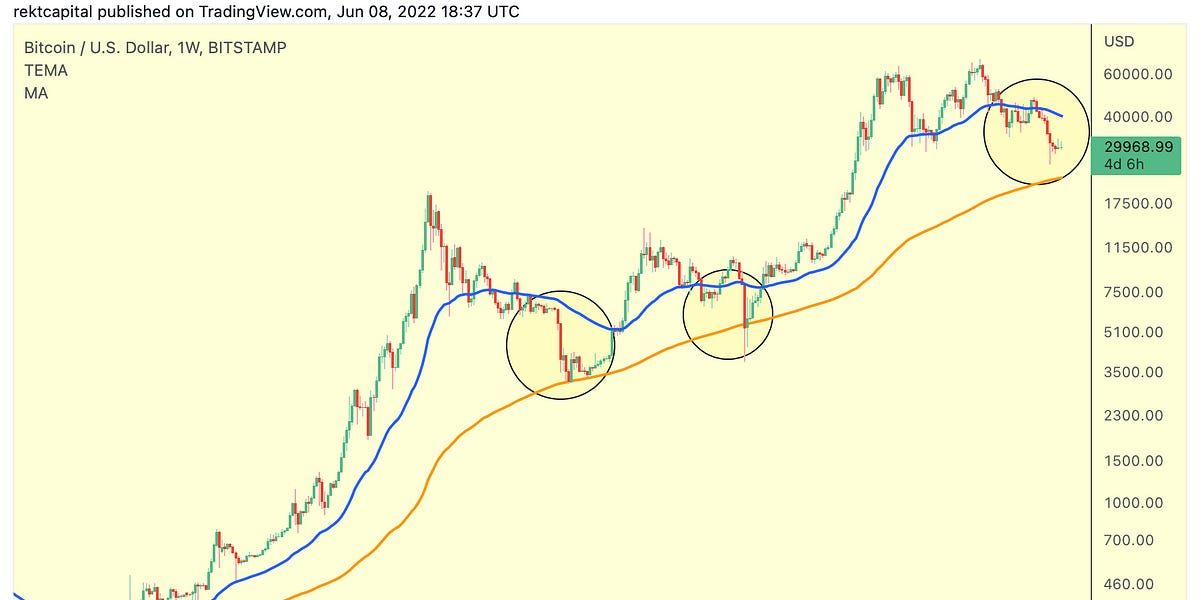
In today’s newsletter, we’ll explore the curious relationship of price action relative to the 50-week EMA (blue; a Bull Market reference point for price) and the 200-week MA (orange; an indicator of the maximum point of financial opportunity for Bitcoin).
Historically, we’ve only ever seen three periods of consolidation and/or rebound from the 200-week MA.
This year, perhaps we could see the fourth instance of that phenomenon.
To understand how price could play into that possibility - let’s look at price history.
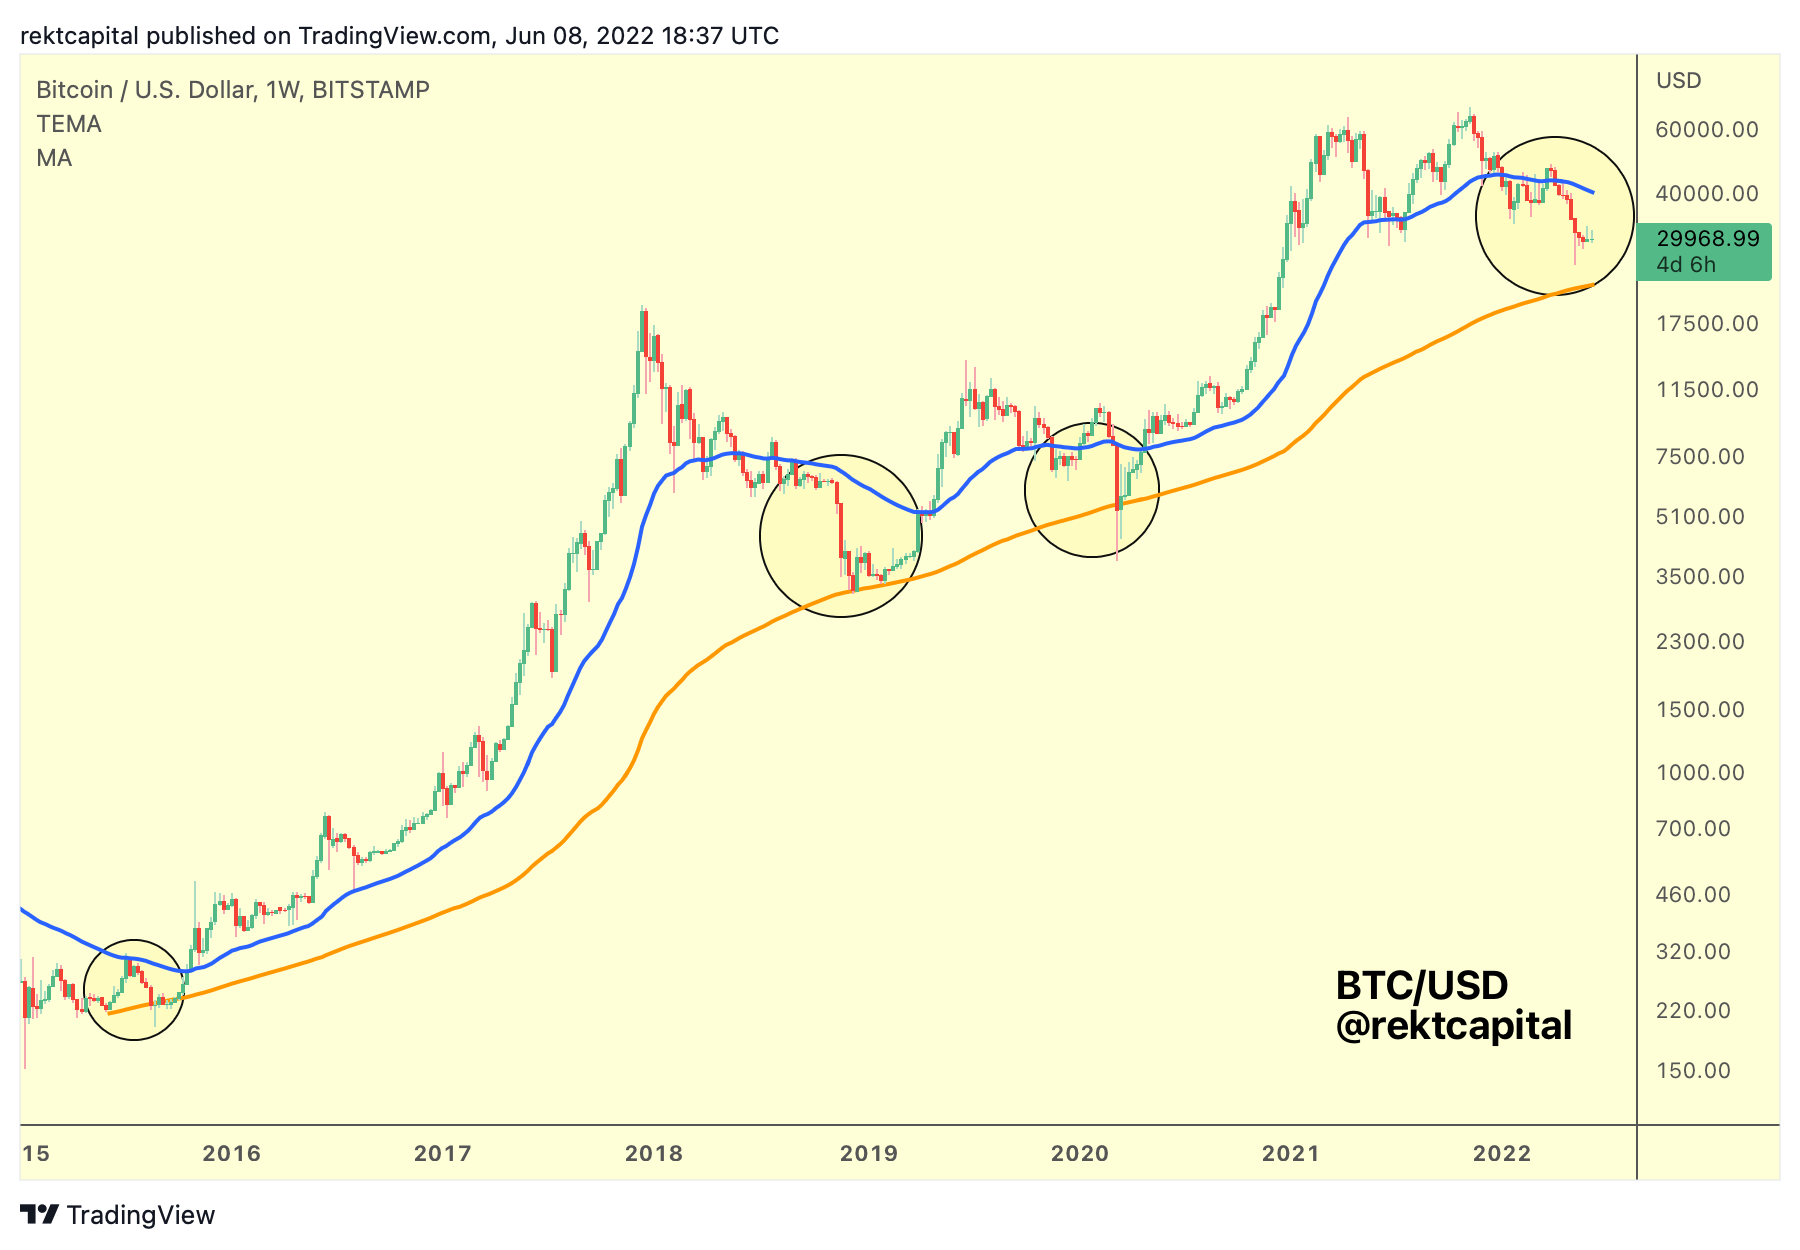
2015
In 2015, BTC rejected from the blue 50-WEMA to rebound from the orange 200WMA.
The first rebound was a solid one, but it didn’t last and gave way to further consolidation before a macro price reversal to finally break the blue 50WEMA.
The 50WEMA was successfully retested as support before lift-off into a new Bull Cycle.
2018/2019
In 2018/2019, BTC rejected from the blue 50-week EMA after forming a lengthy consolidation period just below it.
In fact, price deviated towards the upside beyond the 50WEMA a couple of times, faking out investors with the promise of a trend reversal above this Bull Market indicator.
Price then crashed and before it reached the 200MA, price relief rallied before ultimately resting on the 200MA and then later breaking beyond the blue 50WEMA to begin a new Bull Market.
The 50WEMA was successfully retested as support before lift-off into a new Bull Cycle.
2020
Much like in 2018/2019, BTC consolidated below the 50WEMA, even fake-broke out beyond it, before ultimately rejecting from it to reach the 200MA and even deviate below it.
Then price broke the 50WEMA and then 50WEMA was successfully retested as support before lift-off into a new Bull Cycle.
2022
Much like in previous years, BTC consolidated below the 50WEMA, fake-broke out beyond it, before ultimately rejecting, and crashing towards the 200MA.
Based on these recurring tendencies, what can we understand about this current period?