Bitcoin - Between Two Old All Time Highs
Will old All Time Highs from 2021 and 2024 turn into new resistance?
Welcome to the Rekt Capital Newsletter, a resource for investors who want to better navigate the crypto markets with the help of cutting-edge crypto research and unbiased market analysis.
Bitcoin and the Retest of the 200-Week EMA
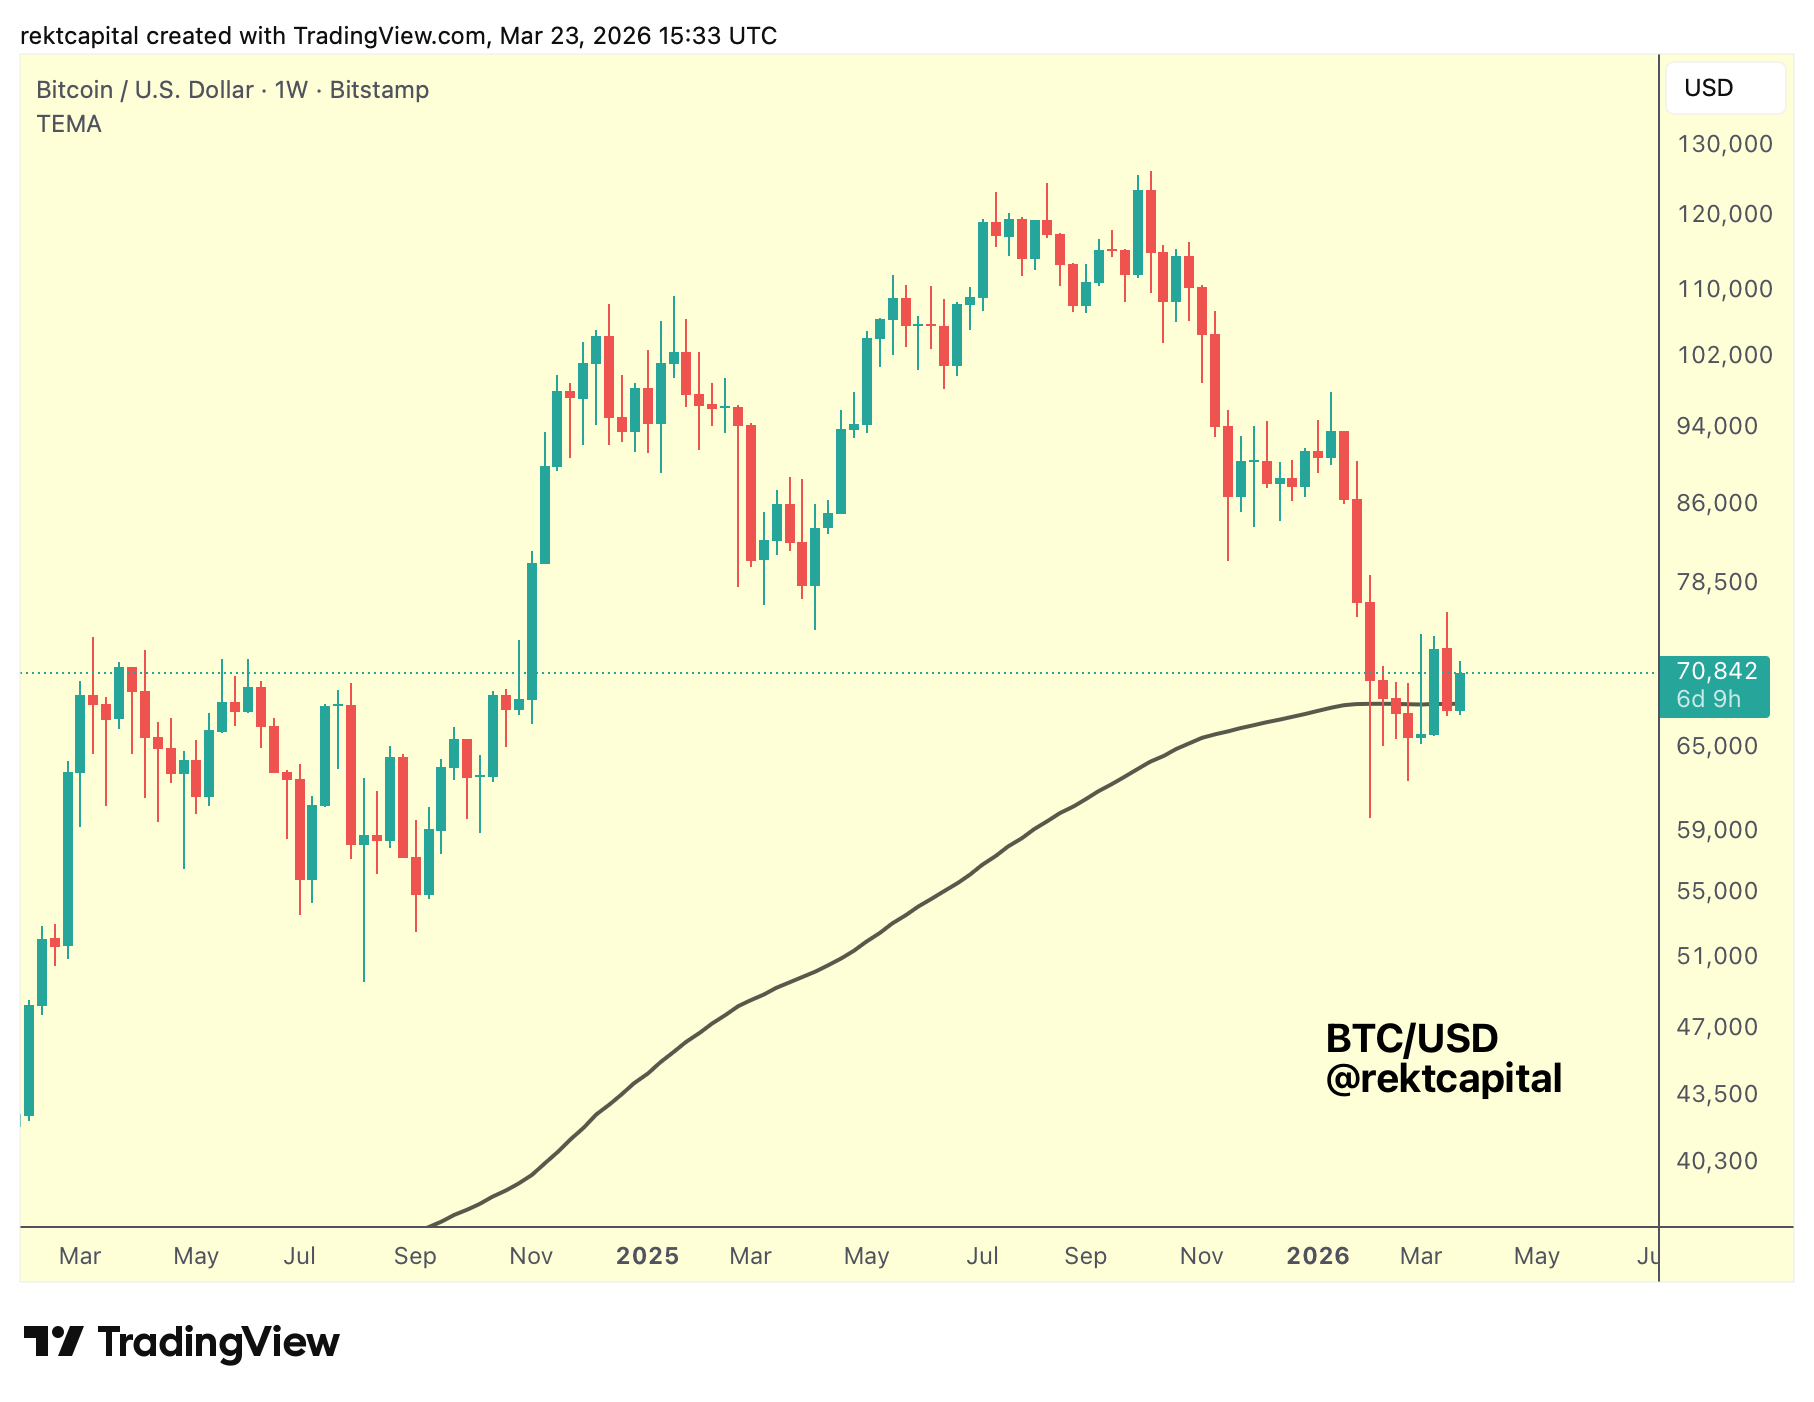
Bitcoin’s recent price action continues to revolve around the $68,300 (black, 200-Week EMA).
A level that has shifted rapidly between resistance and support over the past few weeks.
Previously, this EMA was acting as resistance, but once price Weekly Closed above it, the expectation was for a post-breakout retest to confirm it as new support.
However, there were already reservations about whether this level — having been unreliable as resistance — could truly hold as reliable support.
And those concerns are now beginning to materialise.
Bitcoin has since produced a Weekly Close below the 200-Week EMA, suggesting that the attempted support retest was technically not successful.
Which introduces a key shift in structure.
Because a Weekly Close below a level like this does not just signal weakness, it opens the door to a potential bearish retest, where the EMA transitions back into resistance.
In fact, if the current Weekly Candle were to reject from current prices and close below the 200-week EMA and as a result with an upside wick, that would actually confirm the EMA as resistance rather than support.
And since BTC didn't technically retest the 200-week EMA as support, there's scope for a dip into said EMA for a retest in the future.
In many ways, this behaviour is going against both historical precedent and textbook Technical Analysis principles.
Instead of clean breakdowns or breakouts, Bitcoin is producing repeated fake breakdowns and fake breakouts around this level.
And in doing so, Bitcoin is building out a cluster between roughly $68,000 and $71,000.
Notably, this emerging cluster is forming at a higher level than the previous consolidation cluster which built beneath the 200-week EMA a few weeks ago.
And generally across cycles, Bitcoin tends to build clusters of price action after strong breakdowns in Bear Markets, but those clusters tend to resolve to the downside over time, further building out the Macro Downtrend.
Bitcoin Is Trapped Between Two All Time Highs
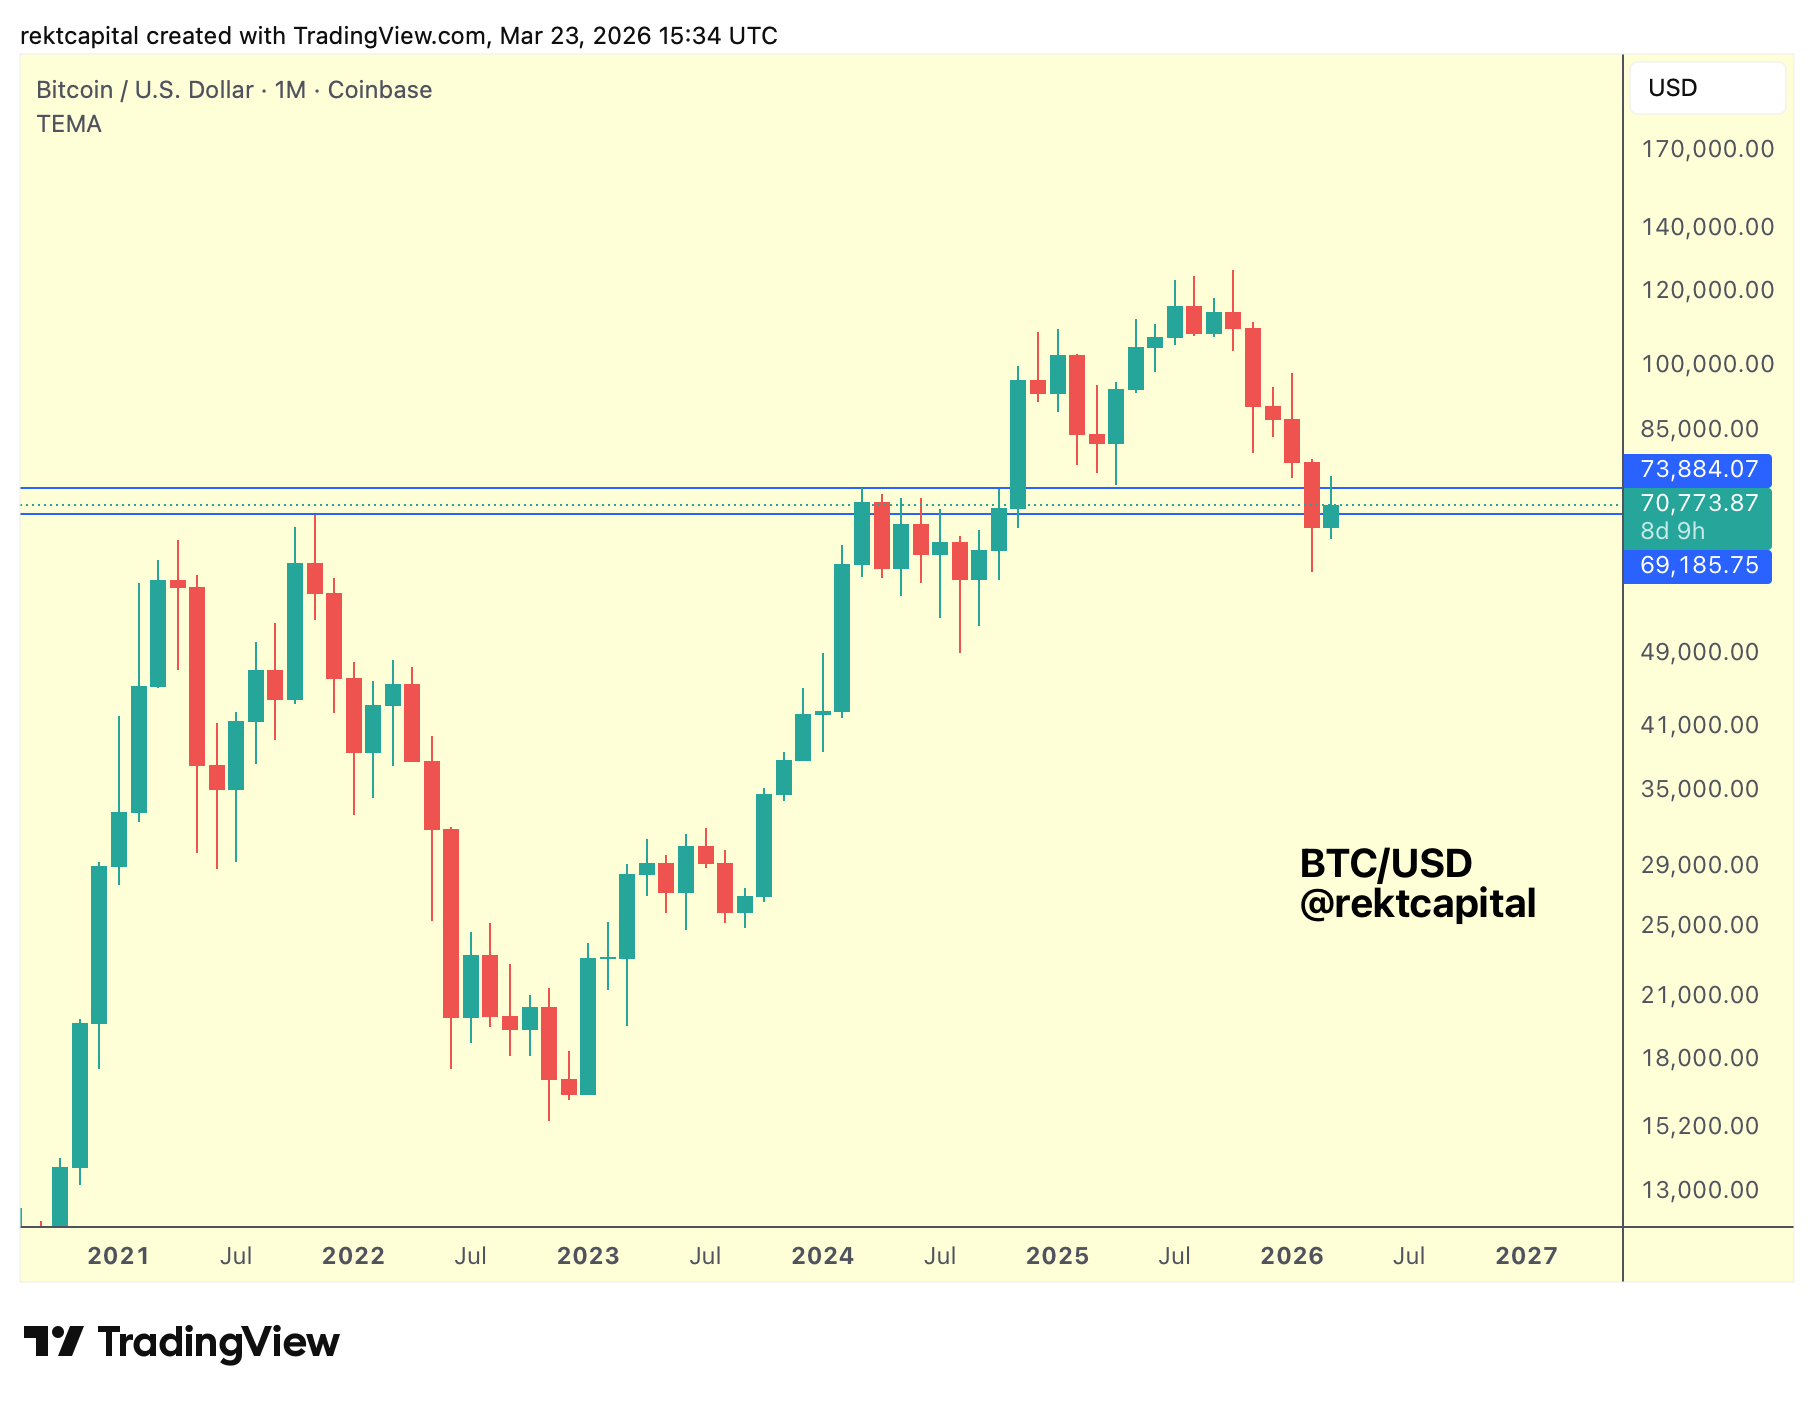
Bitcoin is currently positioned between two key levels: the $69,185 (blue, 2021 All Time High support) and the $73,884 (blue, 2024 All Time High resistance), leaving price effectively sandwiched between former highs now acting as pivot points.
The central question is how Bitcoin will Monthly Close relative to these levels.
If Bitcoin Monthly Closes below both the 2021 and 2024 All Time Highs, then both levels would be confirmed as resistance, reinforcing a bearish retest positioning already initiated by the prior Monthly Close beneath them.
In that case, this current Monthly Candle would effectively act as a continuation of that bearish retest, with downside likely to follow sooner rather than later.
However, if Bitcoin Monthly Closes within this range — holding above the 2021 level while remaining below the 2024 level — then price may simply continue clustering between these two levels; as previously mentioned, clusters at this stage in Bear Markets are quite common and tend to resolve to the downside over time.