Bitcoin & Altcoins - Realistic Market Update
How I think about the Ethereum bottom
Welcome to the Rekt Capital newsletter, a place for people who want to better navigate the crypto markets with the help of cutting-edge crypto research and unbiased market analysis.
Bitcoin Monthly View
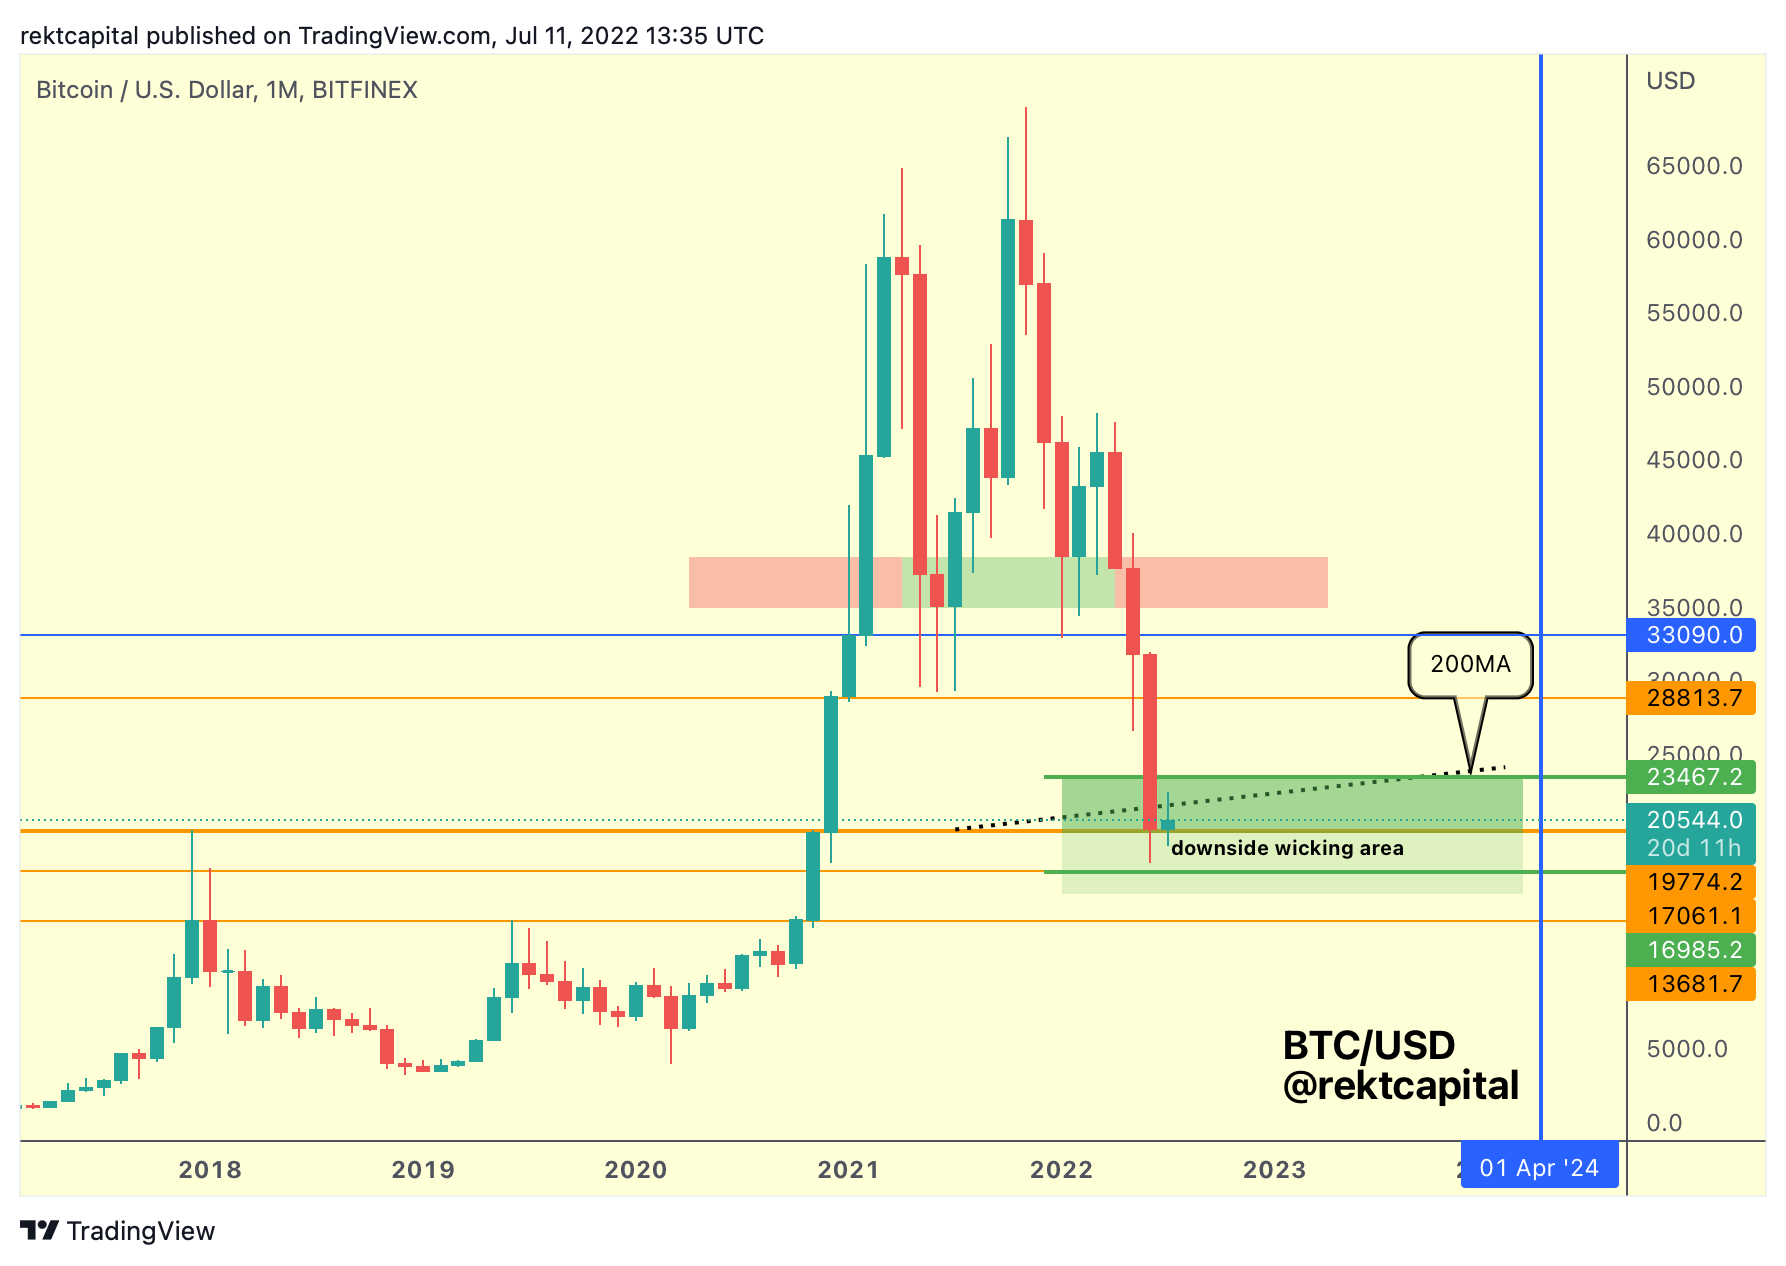
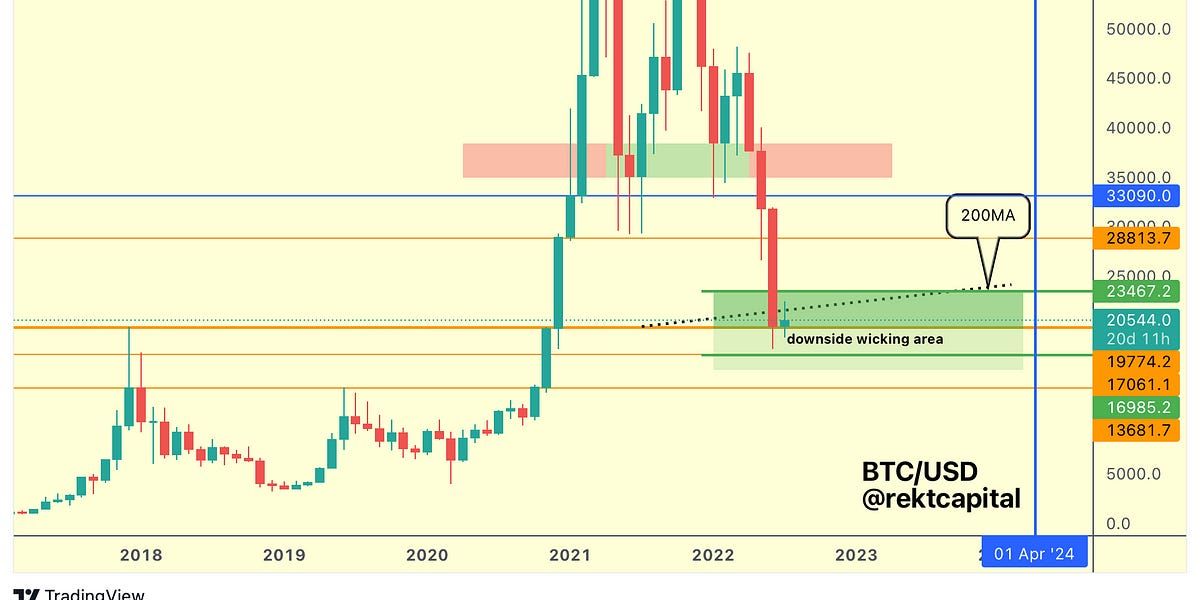
Historical post-Death Cross retracements across time, along with downside wicking below the 200-week MA produce a confluent support/bottoming out zone that is denoted by the green box on the chart.
Right now, BTC is resting at a major ~$20000 support, which is essentially the Range Low of its $20000-$28800 range.
Below the Range Low however are located ~$17000 and $13900 Monthly supports.
Theoretically, those are Monthly levels that could be tagged in some volatile way but generally speaking there is not much left for BTC to finally produce a generational bottom.
The green area suggests that, as historical bottoms have occurred in this analogous bottom here.
With BTC resting at the $20K Monthly support, under the 200-week MA, this is going to cause price compression to precede the next major move.
I’m not looking to trade the next move.
The way I see it is that I’ll be accumulating more for the long-run via my Dollar-Cost Averaging strategy if we go lower.
And if BTC actually manages to relief rally, then I’ll understand that this movement is a function of draining the clock in terms of time before the Halving.
Because BTC is now some ~650 days prior to the Halving and historically price has bottomed out 517-550 days pre-Halving.
So BTC still has time to do whatever it needs to do before firmly registering that bottom, at least in the context of time prior to the Halving.
I talk more about this regarding Ethereum later on.