Altcoin Newsletter #88
My exclusive commentary on 8 Altcoins

Welcome to the Rekt Capital newsletter, a resource for people who want to better navigate the crypto markets with the help of cutting-edge crypto research and unbiased market analysis.
Every Friday, I host an Altcoin TA session where I share my exclusive commentary on the price action of a wide variety of coins, requested by valued premium members of the Rekt Capital Newsletter.
I share charts on 8 coins today.
In today’s Altcoin newsletter, I cover 8 different Altcoins, specifically:
- Polygon (MATIC/USDT)
- Chainlink (LINK/USDT)
- Harmony (ONE/USDT)
- Binance Coin (BNB/BTC)
- Kadena (KDA/USDT)
- Iota (IOTA/USDT)
- Loopring (LRC/USDT)
- Power Ledger (POWR/USD)
Polygon - MATIC/USDT

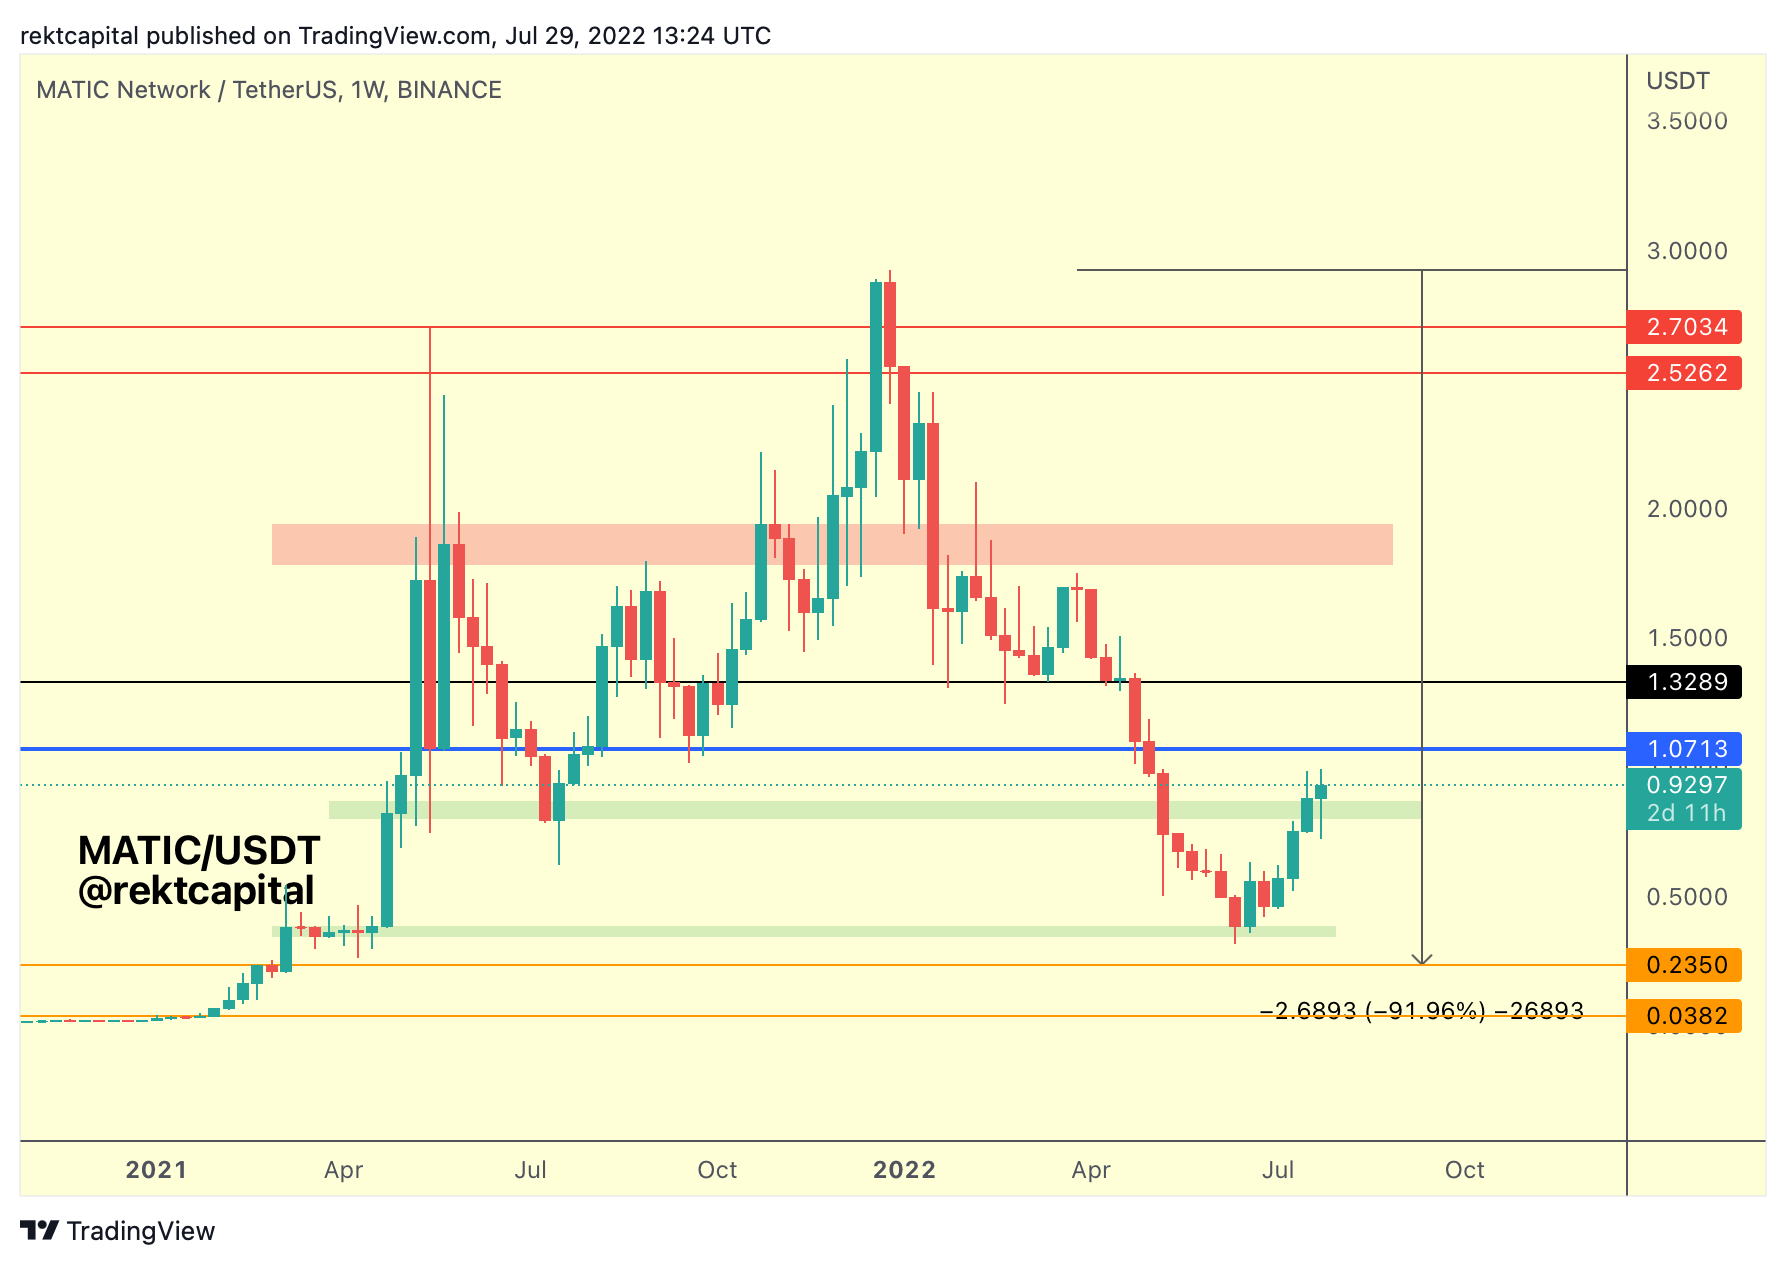
MATIC has successfully retested the green region as support, producing a long downside wick in the process, just like before in mid-2021 and April 2021 as well.
This is something we kept an eye on in this week’s Altcoin Watchlist, with the prospect of MATIC being able to possibly reach the blue level above over time.
That blue level will likely be a strong resistance and so if MATIC wants to have a chance at prolonging this rally, it would need to Monthly Close above blue in a few days to bring it closer to a necessary technical confirmation of trend continuation.
Chainlink - LINK/USDT

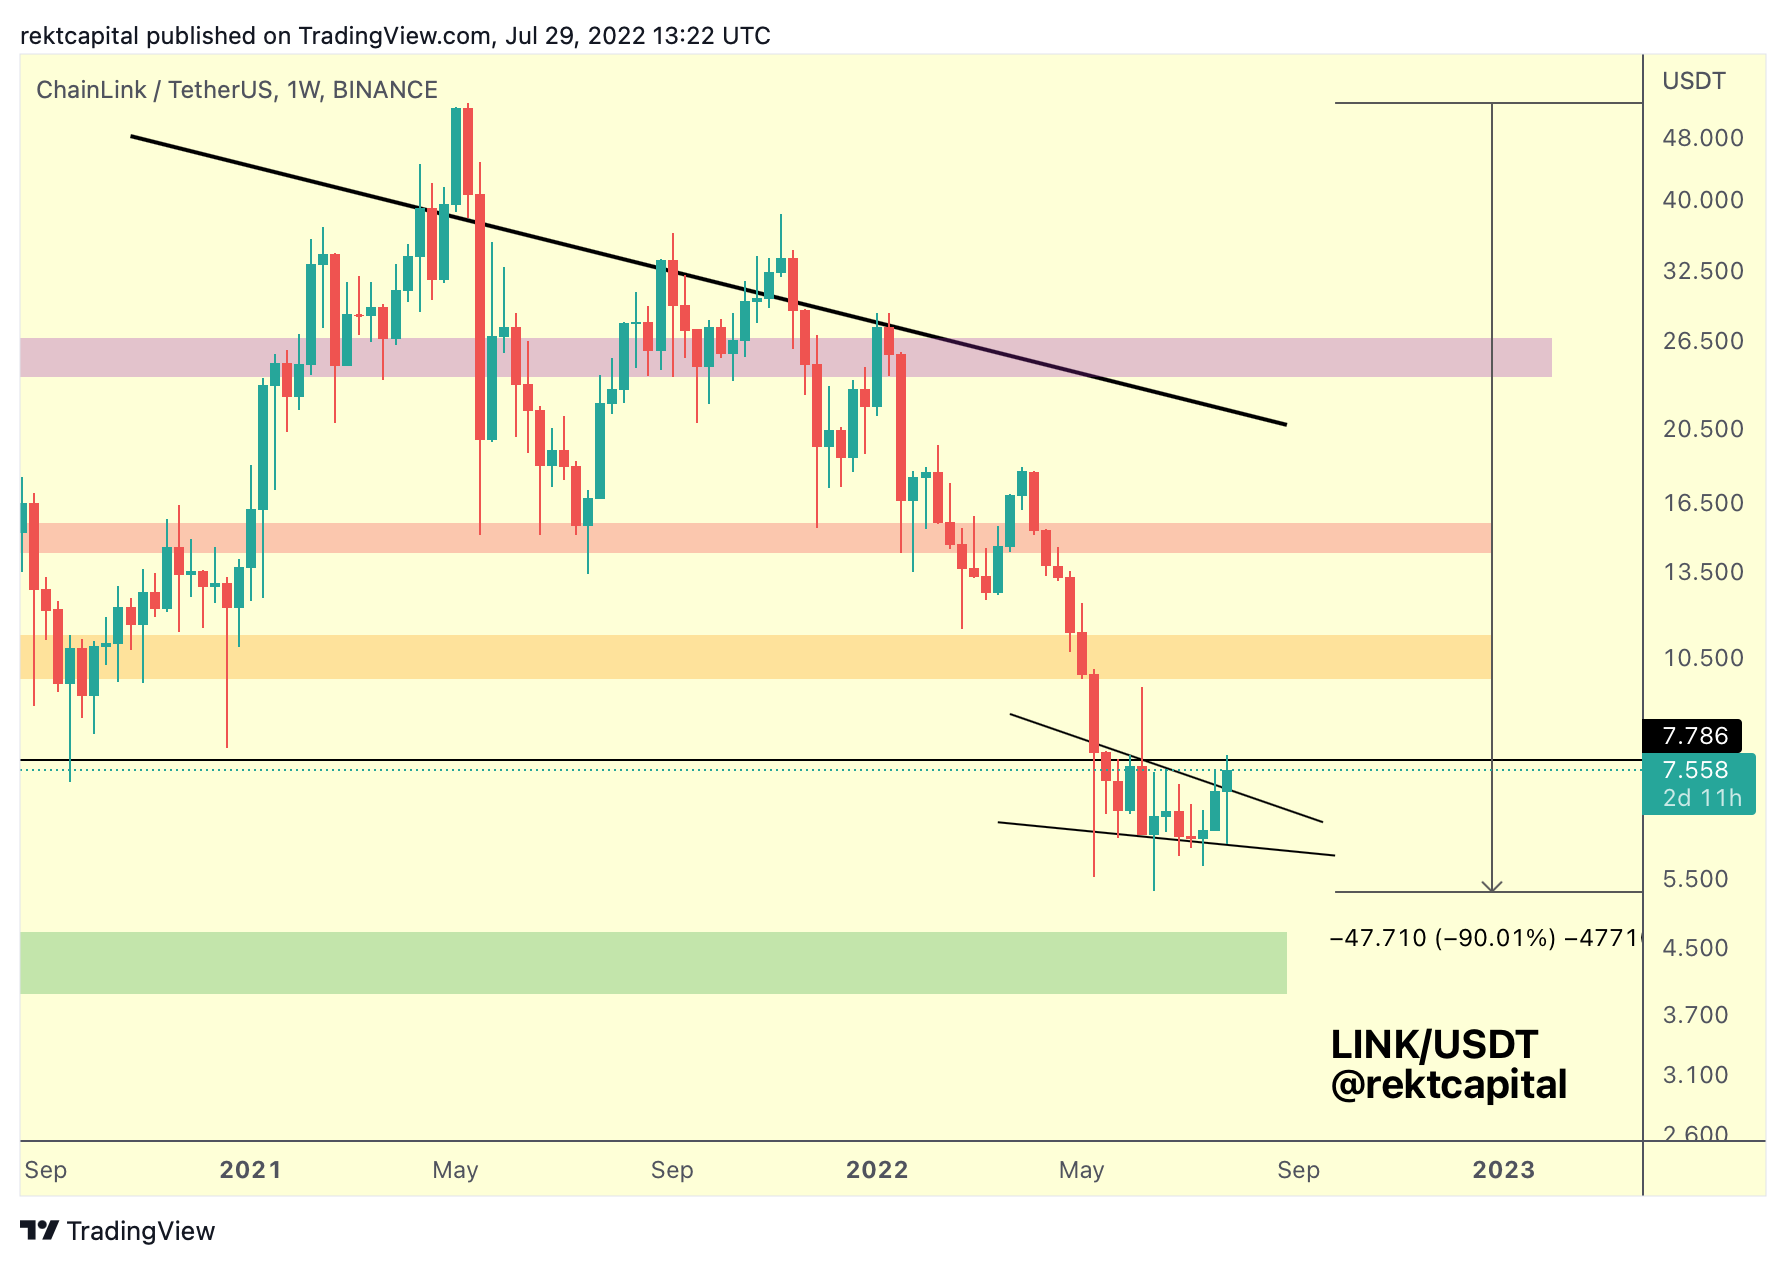
LINK has successfully rebounded from the bottom of its wedging structure, something we kept an eye on in this week’s Altcoin Watchlist.
This rebound has actually facilitated a breakout from the wedge, with LINK tagging the black $7.786 resistance.
This black level is the one to watch as we head into the Monthly close.
In the meantime, some rejection could take place to force LINK into a retest of the Wedging structure top.
Upon successful retest there, LINK will try to reclaim that black level as support to move higher.
Harmony - ONE/USDT

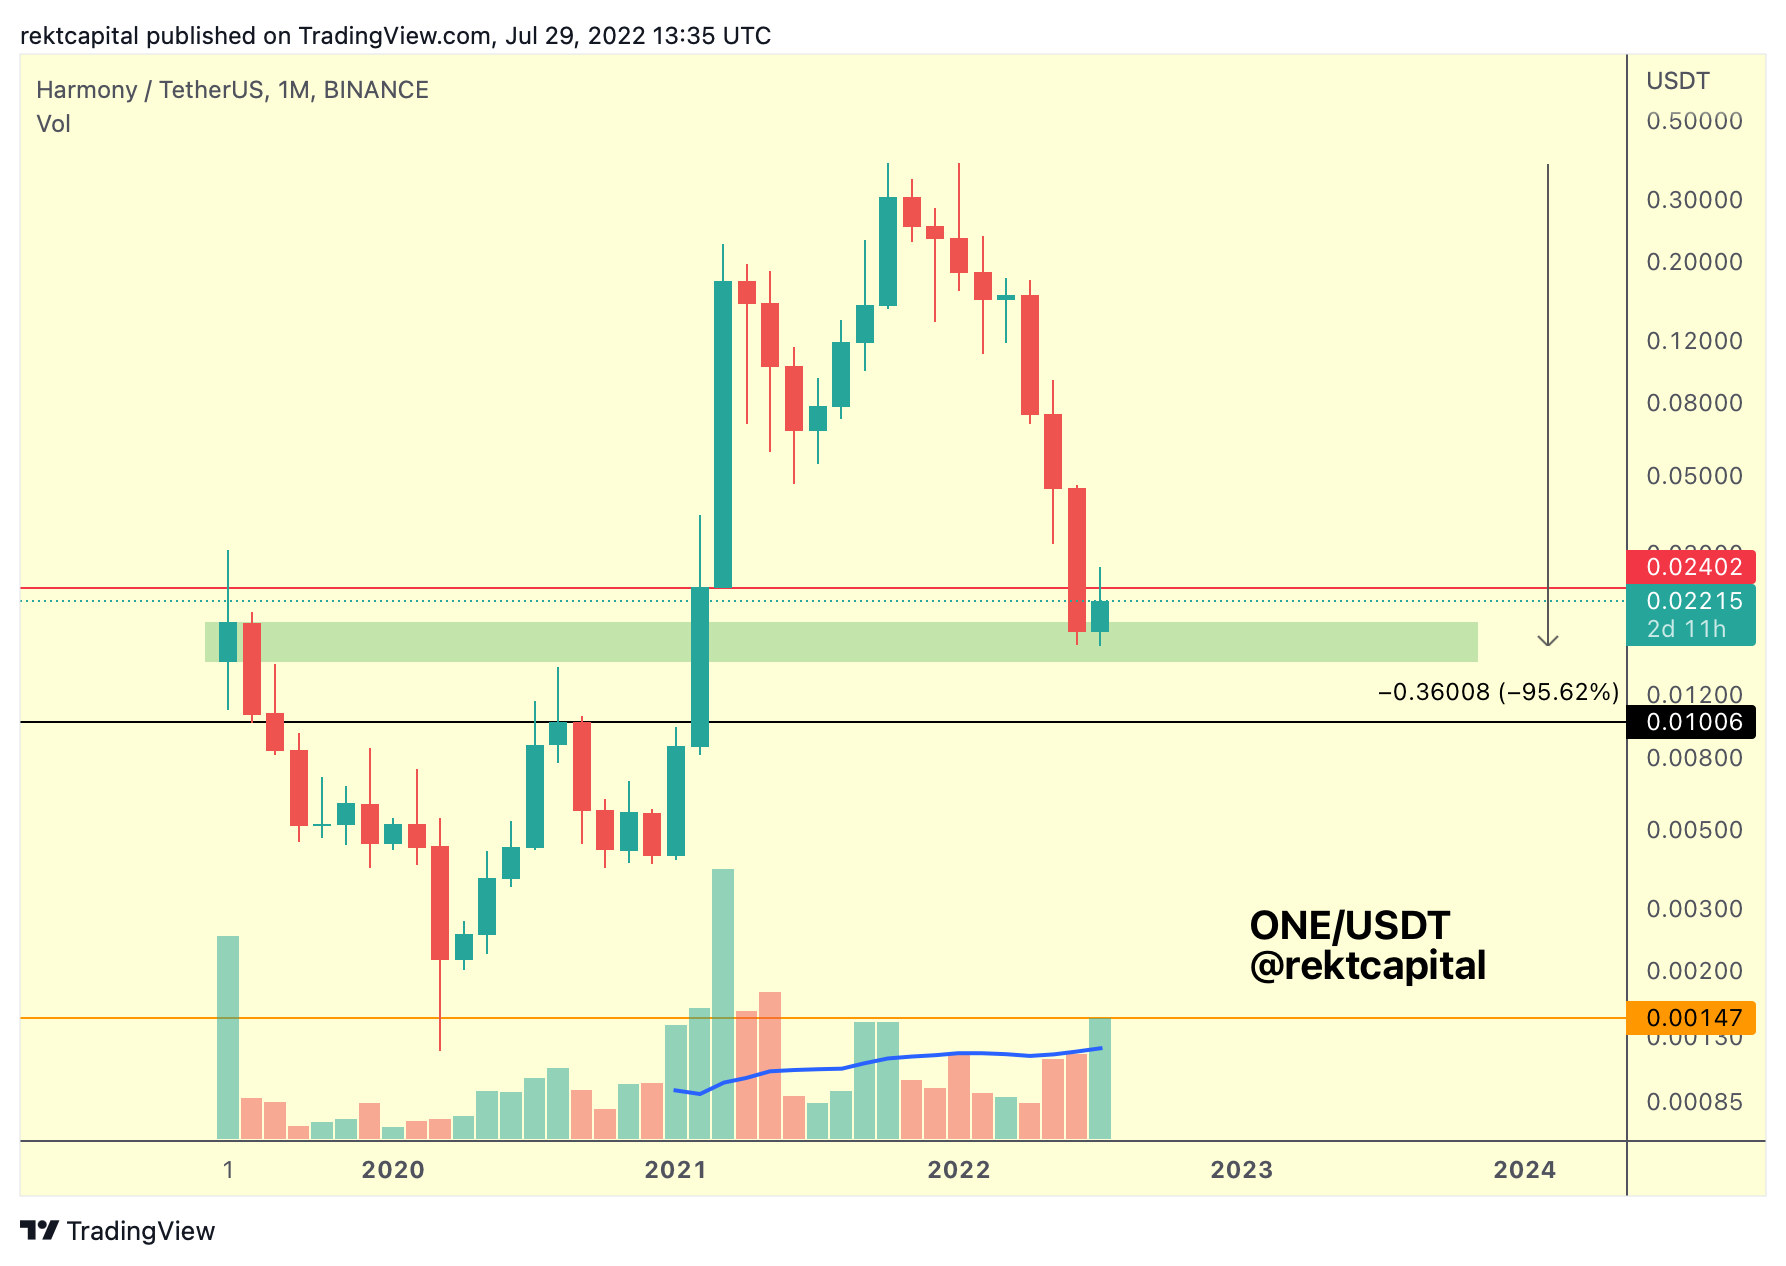
ONE has rebounded from its Binance Listing Price region (green), while rallying striaght into Monthly resistance (red).
Technically, ONE is in a green-red range, having retraced -95% already.
Is this green area a strong support?
In my experience, Listing Price regions fail to be so.
Moreover, while ONE has enjoyed some of the strongest buy-side volume ever, rivalling Bull Market buyer volume, if you compare the volume-to-candle-length ratio of this current Monthly candle vs other Monthly candles on similar buyer volume…
You’ll notice that the Bulls had to work very hard this month to generate a relatively narrow Monthly candle.
What this shows is that despite the buy-side volume being similar now, it is generating a lesser reaction compared to the past.
Previously, past Monthly candles would’ve expanded considerably on such volume which is showing that ONE right now is not in a buyer’s market and that sellers are still figuring as a formidable, suppressing presence.
Breaking the red $0.024 resistance however would be significant and this would need to occur on stronger buy volume, but for ONE to break that resistance it would therefore need almost historic buy-side volume.
And would that historic buy-side volume be sufficient to generate a breakout?
Based on the reaction we’re seeing thus far, probably not.
But let’s ignore volume for a moment and just focus on the technicals - breaking the red resistance would likely enable quite a rally as there is limited resistance above that level. The next Monthly resistance would be in the $0.05 region.
Does ONE need to lose the green support area to reach the black Monthly support, which is a decisively stronger support?
Again, Listing Price regions fail to figure substantially as areas of buy-side momentum, so perhaps after this relief rally, whatever it may become, ONE may need to go lower, in which case we may actually see ONE have to retrace -99% before forming some sort of bottom.