Altcoin Newsletter #265
Features analysis on Altcoins such as UNI HYPE SHIB OKB CPOOL JASMY
Welcome to the Rekt Capital Newsletter, a resource for investors who want to better navigate the crypto markets with the help of cutting-edge crypto research and unbiased market analysis.
In today’s Altcoin newsletter I cover the following Altcoins – specifically:
- Uniswap (UNI)
- Hyperliquid (HYPE)
- Shiba Inu (SHIB)
- OKB (OKB)
- Clearpool (CPOOL)
- JasmyCoin (JASMY)
These Altcoin TA requests are made by valued readers of the Rekt Capital Premium Newsletter.
Let’s dive in...
Uniswap – UNI/USDT
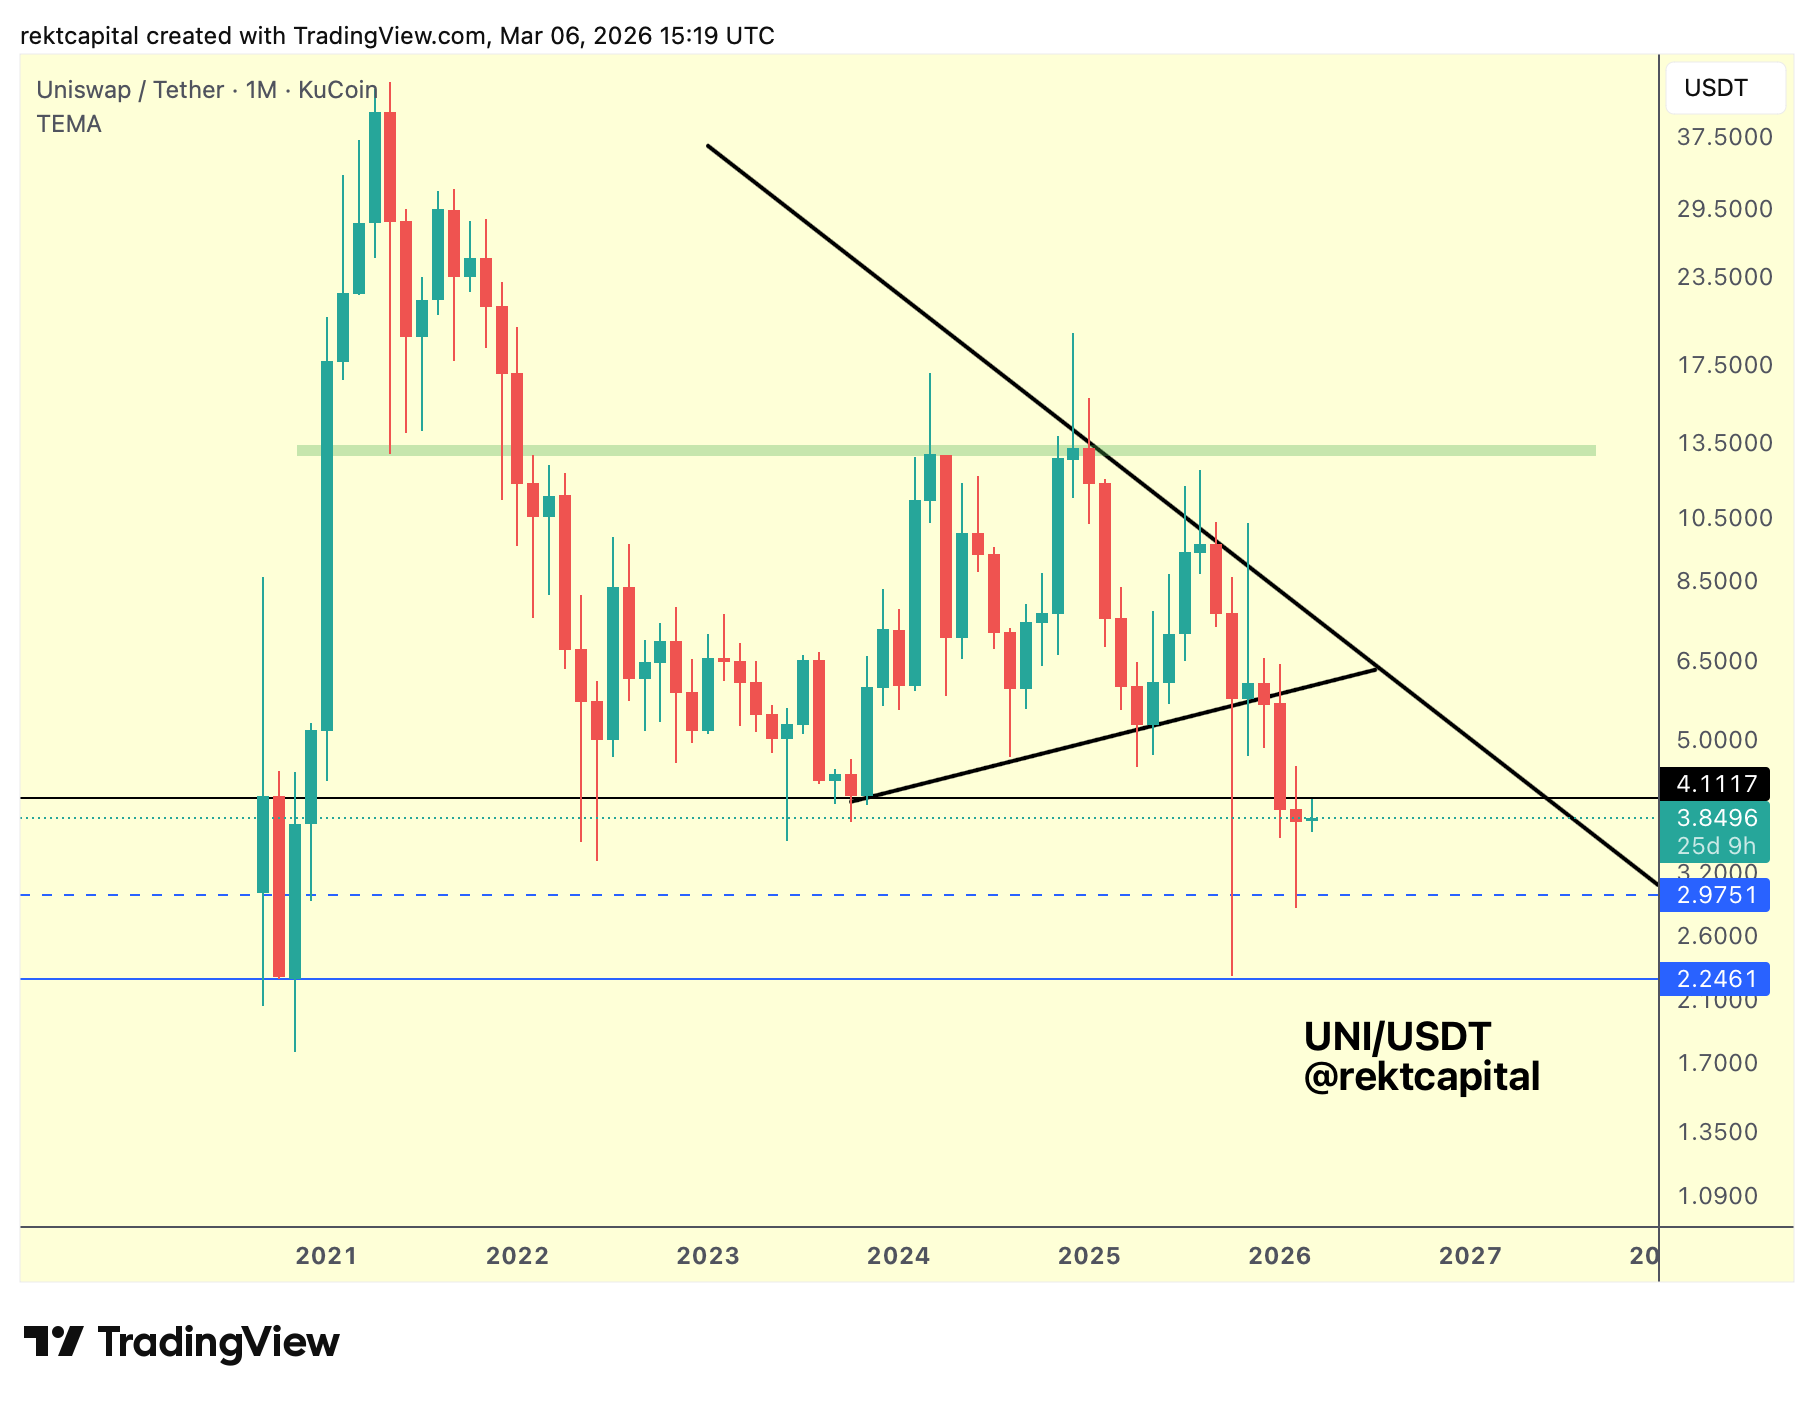
UNI has broken down from its macro triangular structure, producing a Monthly Close below the lower black trendline that previously acted as the base of the formation.
Since that breakdown, price has retested the trendline from below and treated it as resistance, reinforcing the structural shift.
Beyond the triangle breakdown, UNI has also lost the $4.1117 level (black horizontal, prior reversal region).
This area previously acted as a pivot for upside continuation, but a Monthly Close below it a few months ago has since turned it into overhead resistance.
Even though price wicked down toward the $3 region to grab liquidity, the reaction that followed has been relatively muted.
Rather than producing meaningful upside continuation, the market has repeatedly gravitated back toward $4.1117 and rejected from it.
As long as $4.1117 continues to function as resistance, recovery attempts are likely to remain capped beneath this region.
If that rejection persists, price could gradually move back toward the $3 region to probe liquidity once more.
However, if downside wicks continue to reach lower prices without generating meaningful upward progress, that behaviour would indicate weakening demand within the broader support cluster.
In that case, attention would increasingly shift toward the lower structural levels at $2.9751 (blue dotted horizontal support) and $2.2461 (blue horizontal support).
Hyperliquid – HYPE/USDT
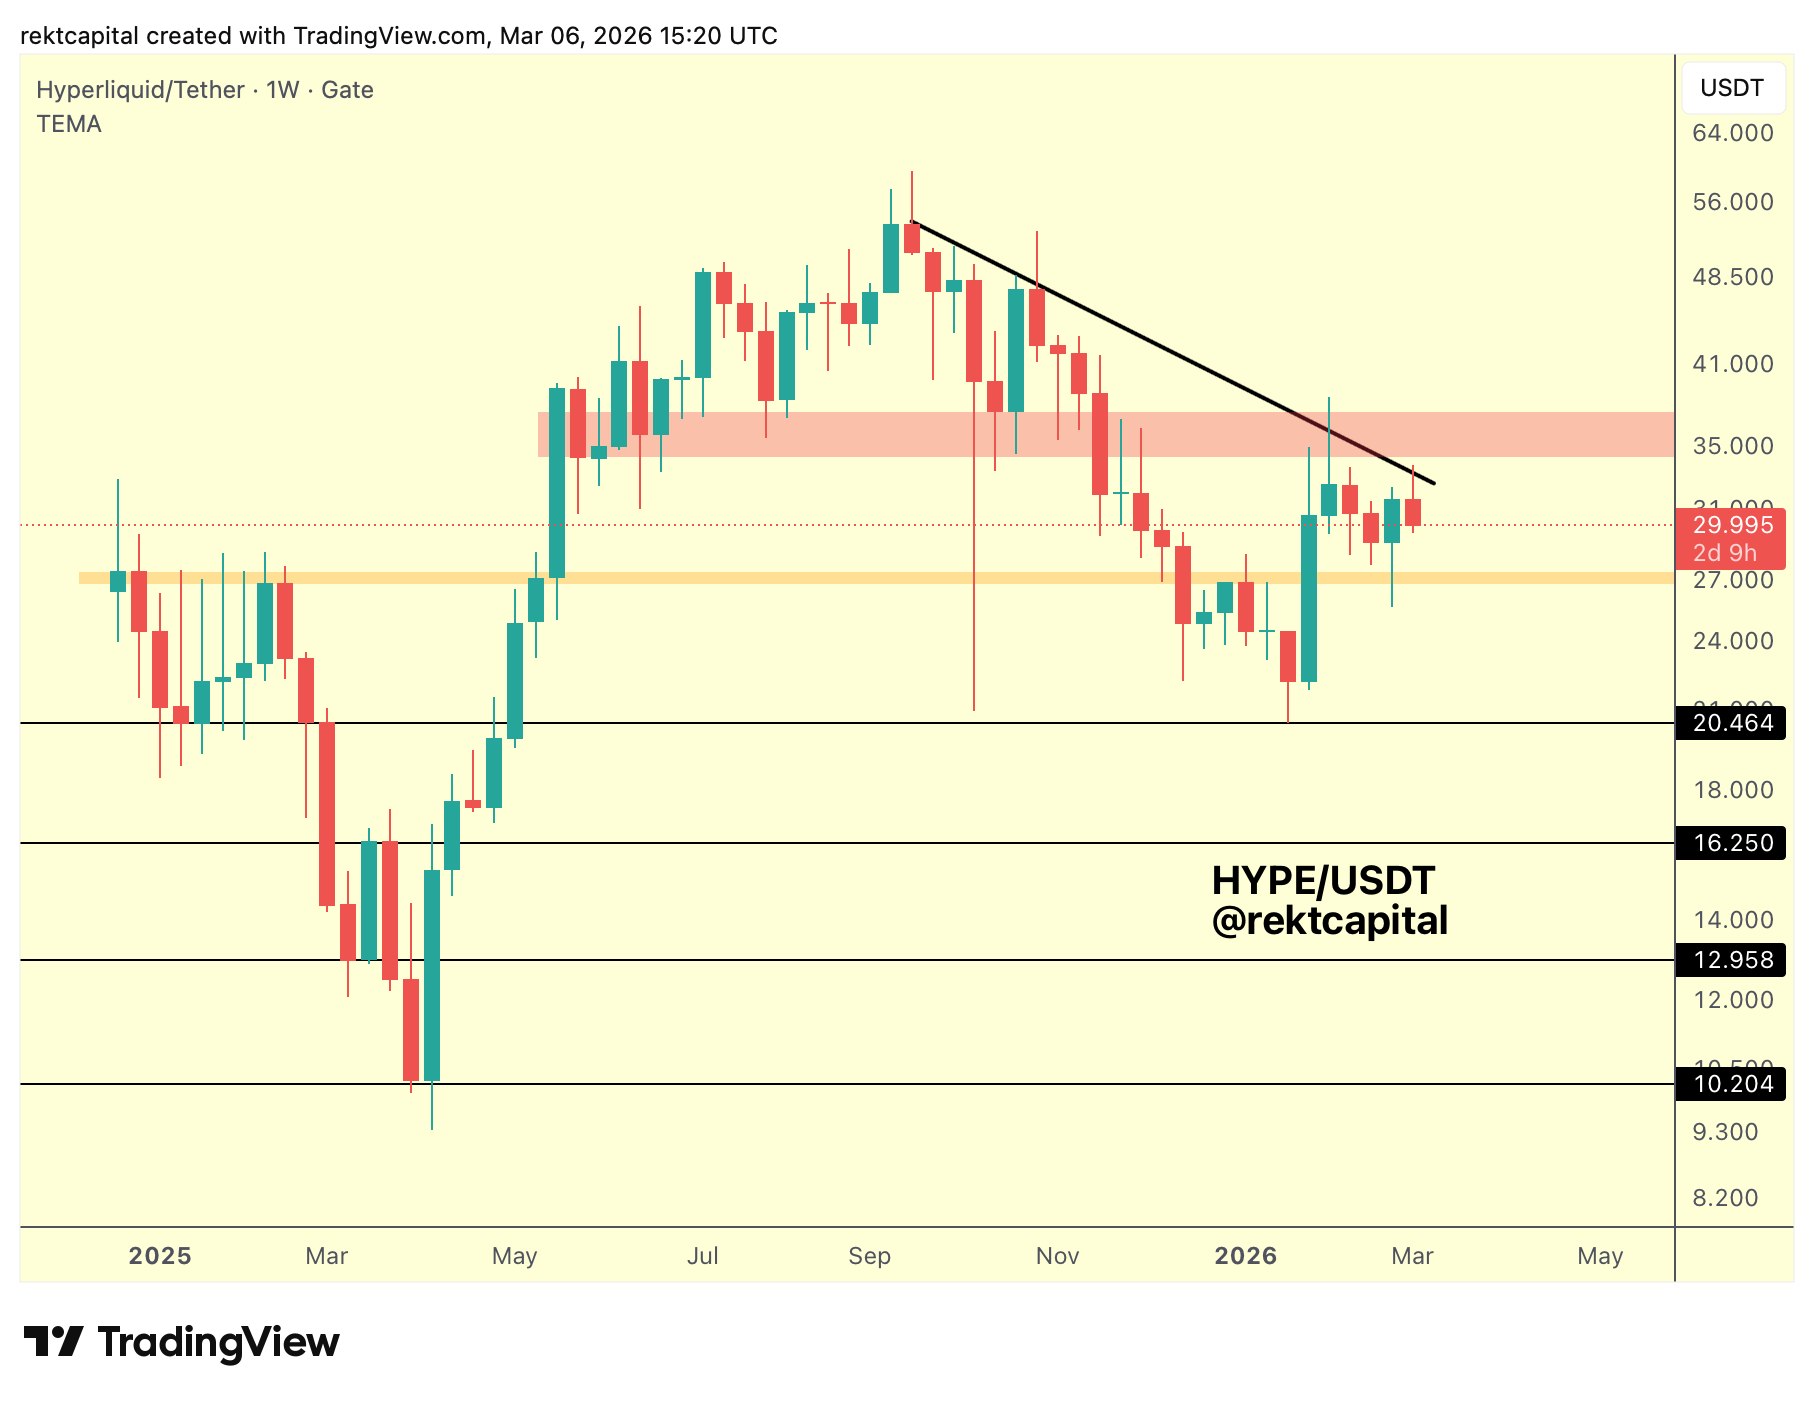
HYPE continues to reject from the macro downtrend (black diagonal) that has been guiding price lower since late Q4 2025.
The most recent interaction with this trendline has produced another rejection, reinforcing the downward pressure already present in the broader structure.
Within this same area, price has begun forming a new 2026 lower high beneath the trend ceiling.
That sequence of continued lower highs highlights the imbalance between buyers and sellers, suggesting that demand is struggling to overcome the persistent supply overhead.
At the same time, the red region above price — previously a demand area — has transitioned into supply and is now contributing to the resistance cluster pressing down on the market.
This supply zone aligns closely with the macro downtrend and the emerging 2026 lower high, creating a confluence of resistance that is limiting recovery attempts.
Beneath price, the $27 level (orange horizontal, Gate listing price) has been acting as a key reaction area.
Price has recently wicked down into this region, briefly tapping liquidity before attempting to stabilise.
However, the broader pattern still shows lower highs forming beneath resistance.
If that behaviour continues and price produces yet another weaker rebound — potentially forming a third lower high in 2026 — the reliability of $27 as support may begin to deteriorate.
Should that weakening become more pronounced, the market could gradually transition back into the broader $20.464–$27 range, where price previously consolidated for an extended period.
For now, the confluence of resistance above continues to weigh on the structure, and continued lower highs beneath the macro downtrend could slowly guide price toward a deeper retest of the range below.