Altcoin Newsletter #242
Features analysis on Altcoins such as SOL VIRTUAL LINK WLD DOT
Welcome to the Rekt Capital Newsletter, a resource for investors who want to better navigate the crypto markets with the help of cutting-edge crypto research and unbiased market analysis.
In today’s Altcoin newsletter I cover the following Altcoins – specifically:
- Solana (SOL)
- Virtuals Protocol (VIRTUAL)
- Chainlink (LINK)
- Worldcoin (WLD)
- Polkadot (DOT)
These Altcoin TA requests are made by valued readers of the Rekt Capital Premium Newsletter.
Let’s dive in...
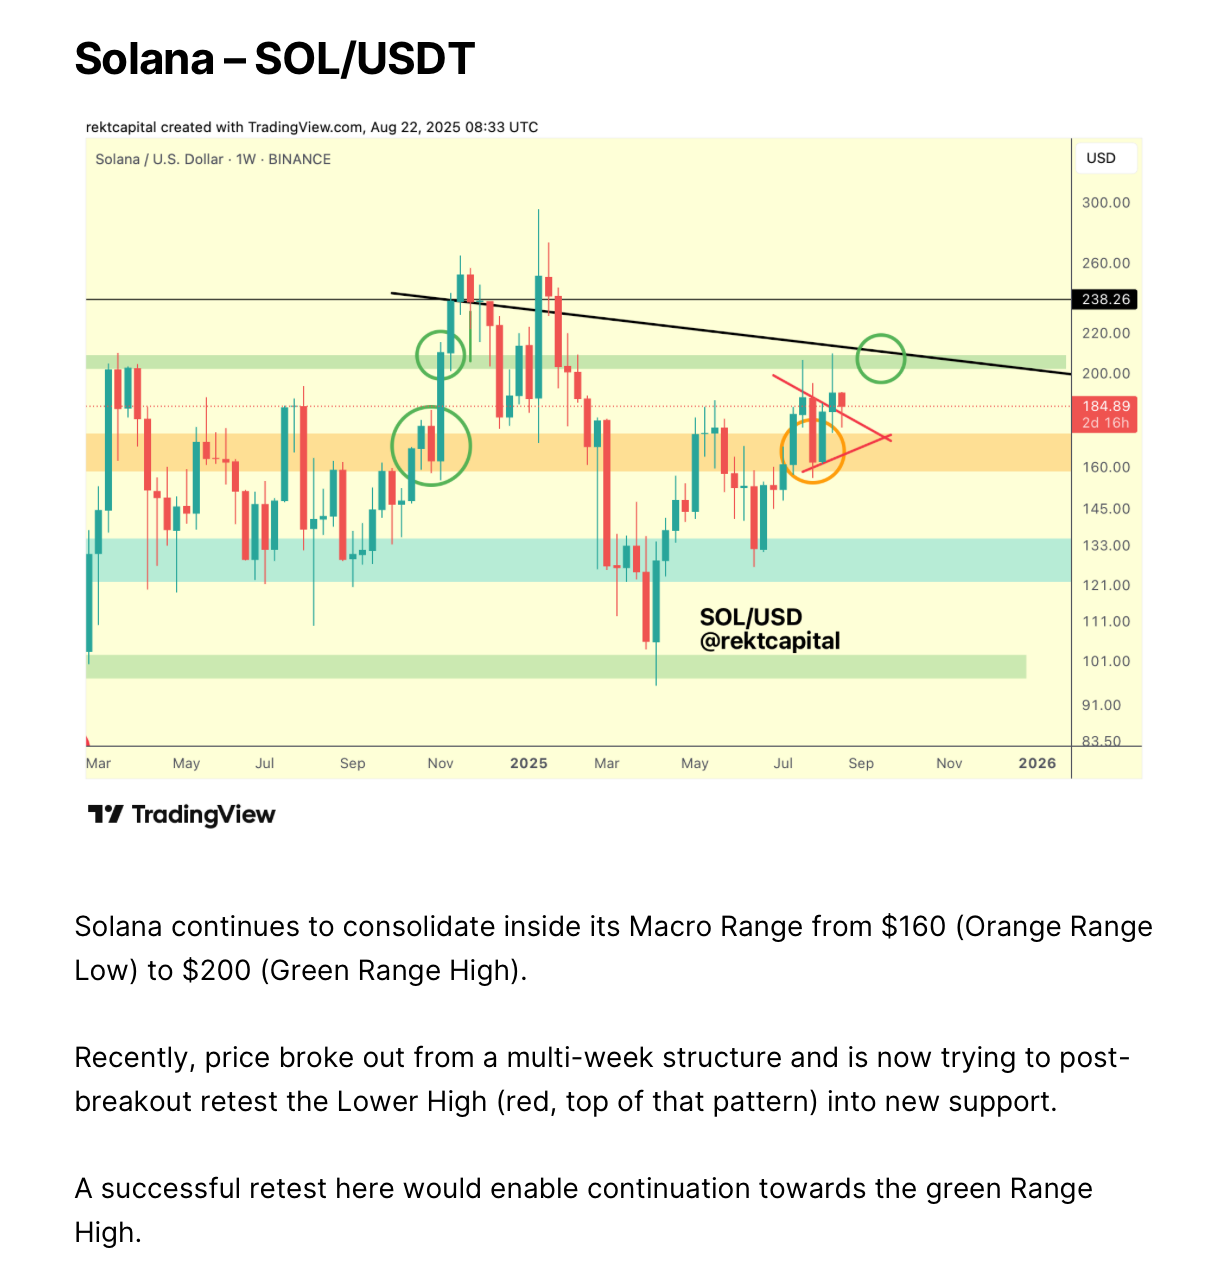
Solana - SOL/USDT
Solana has staged one of the more impressive moves in recent weeks, particularly while Ethereum has been retesting its key 13.37% ETH Dominance level. During this brief window of ETH consolidation, Solana has been able to outperform.
In fact, in late August, we highlighted how SOL was trying to post-breakout retest its Triangular Market Structure into the Macro Downtrend, and that retest was crucial to replicate past green-circled retests that preceded major trend continuations:
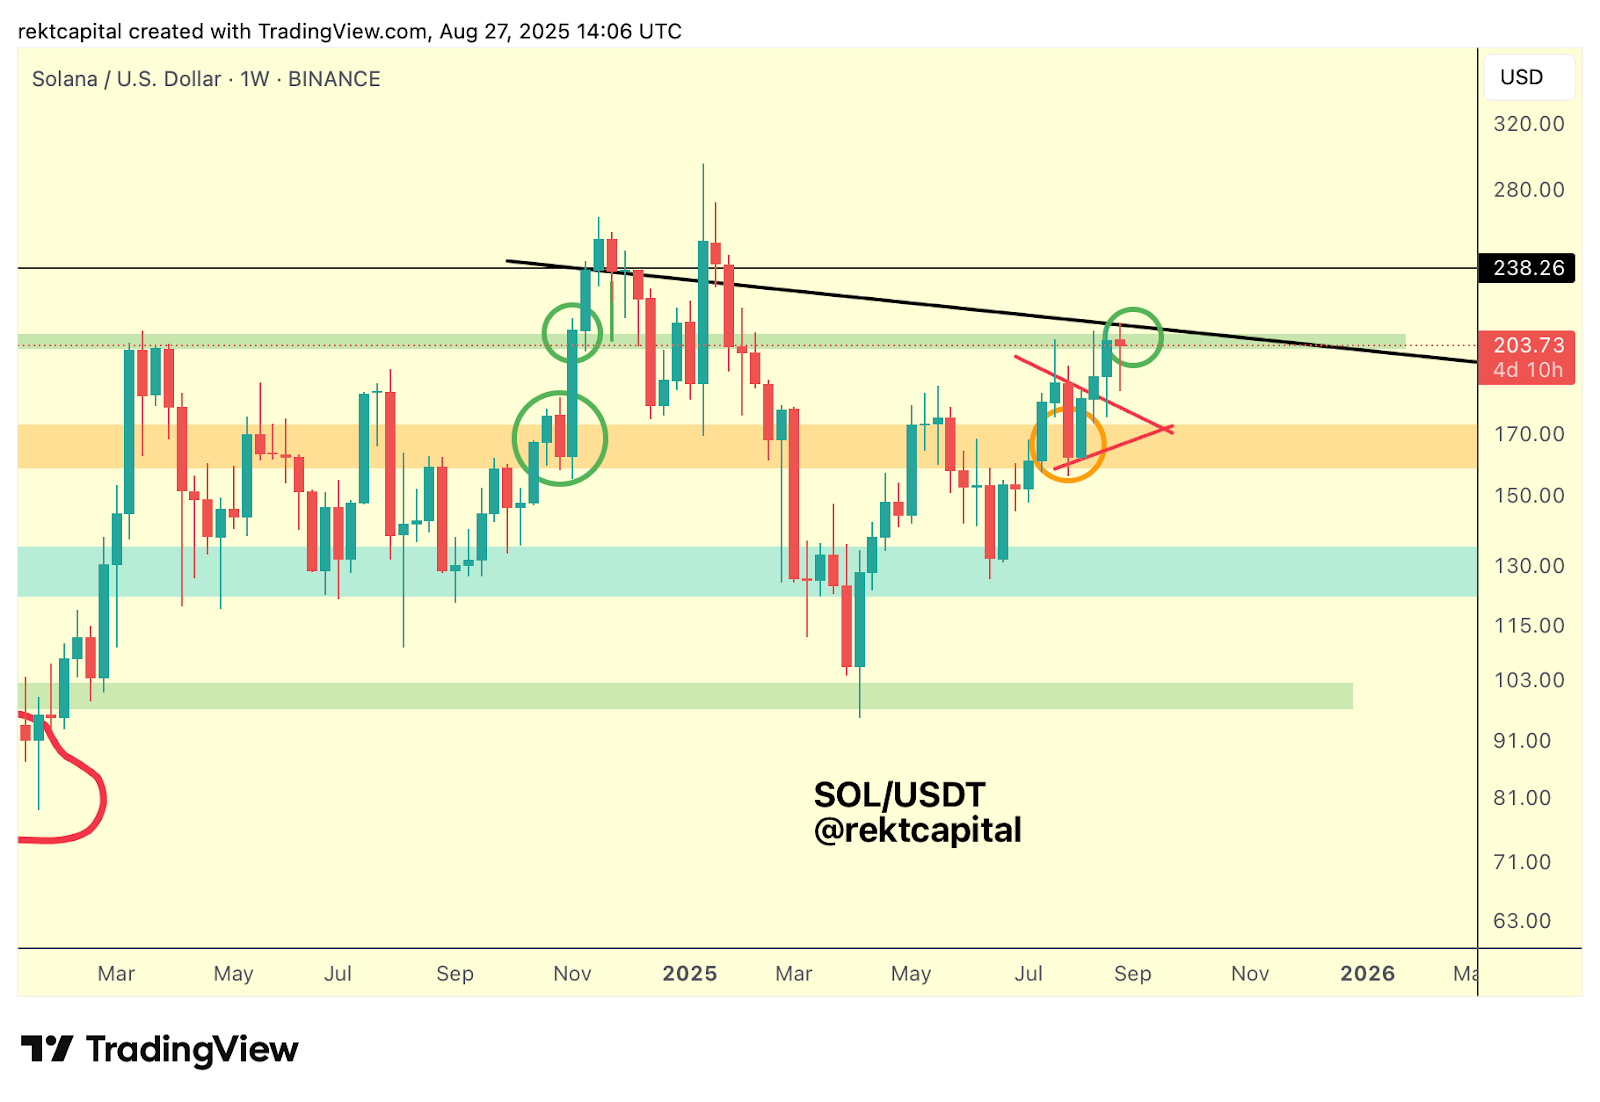
Less than a week later in August, that weekly retest indeed took place as price reached the Macro Downtrend.
Early retesting signs at the green region of historical demand suggested SOL could establish the same constructive base as in prior cycles:
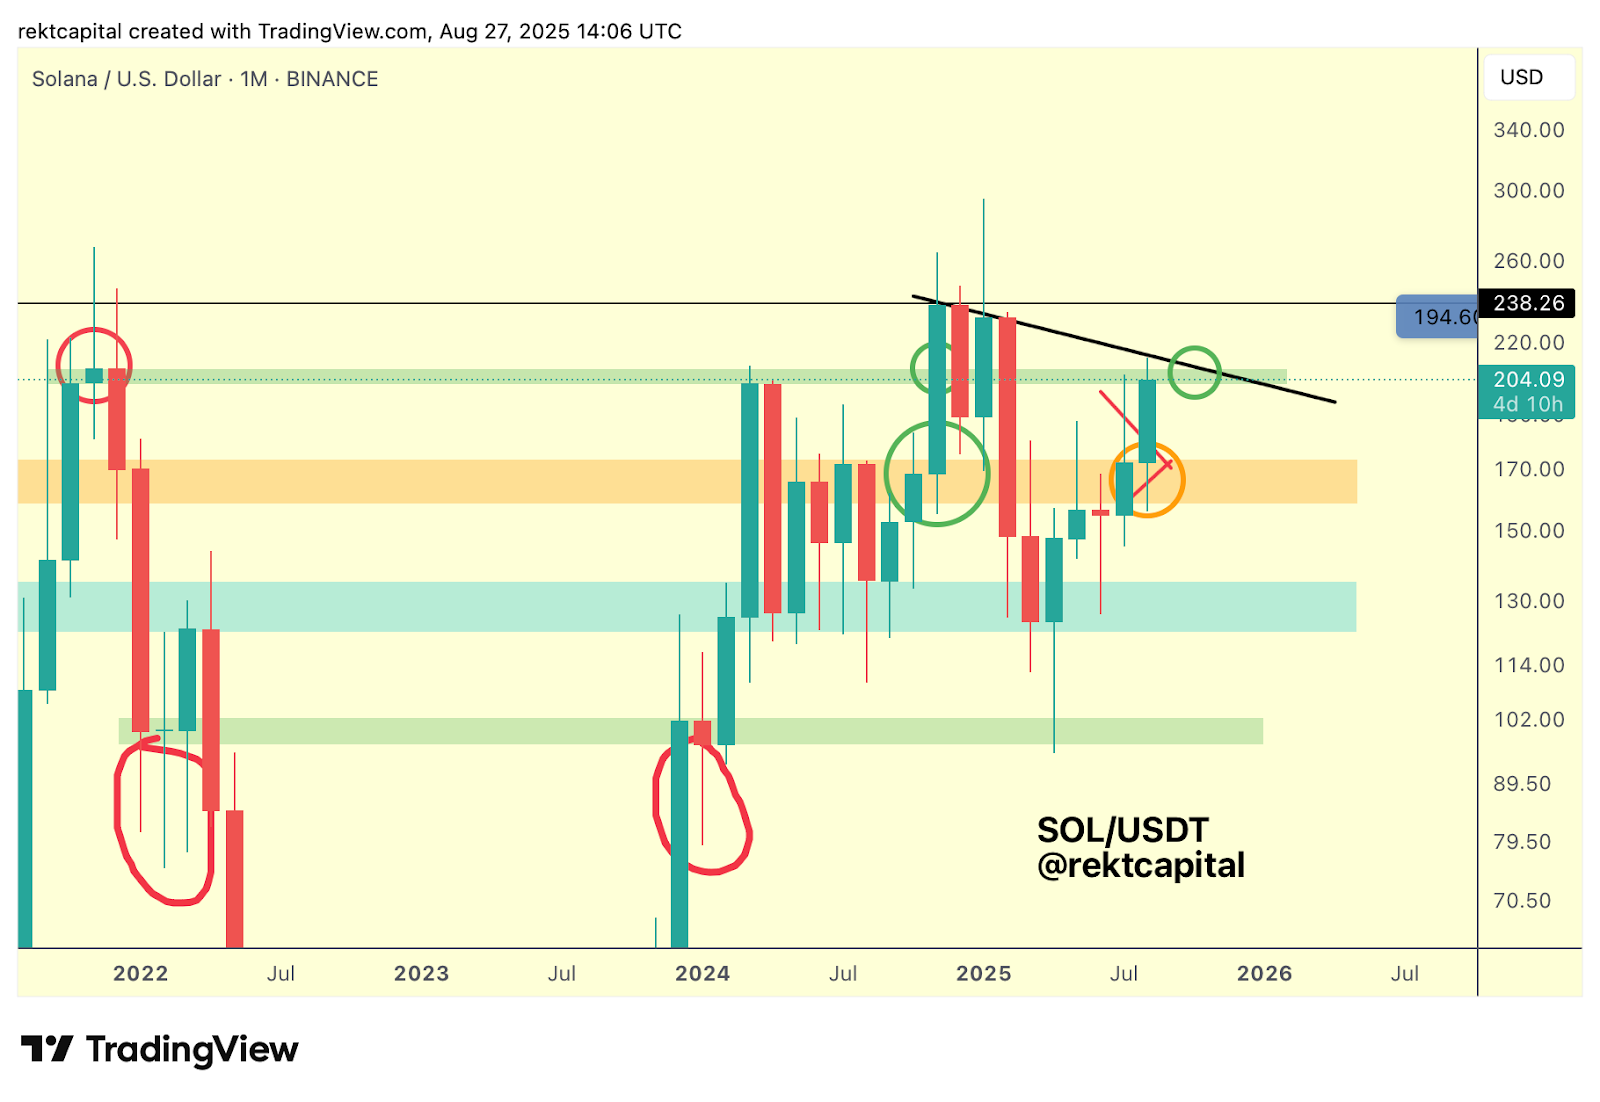
On the Monthly timeframe back then, initial rejections from the downtrend line did occur, but the repeated Weekly retesting process became vital in positioning SOL for continuation:
With that all said, here's today's update:
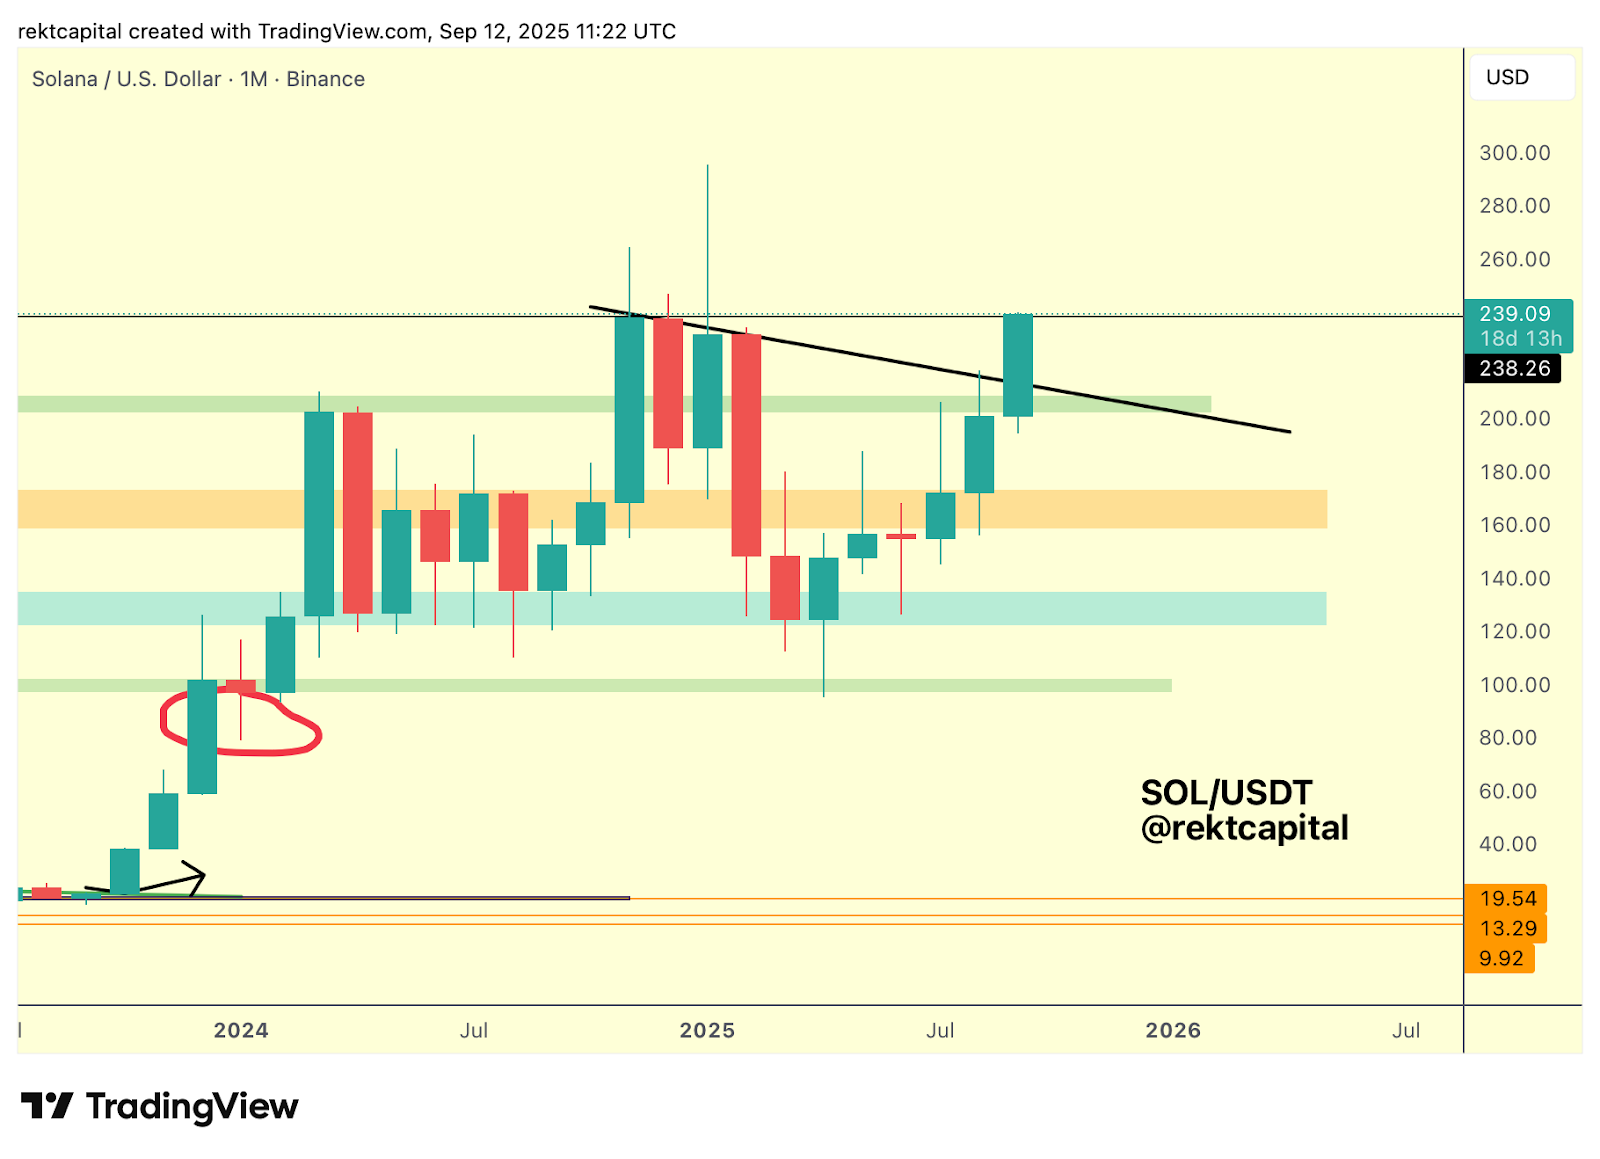
Now, price has broken beyond the multi-month downtrend that has capped rallies since November 2024.
This is a significant development, as every prior upside wick above this trendline has failed without follow-through, sending price back below the Downtrend.
At the same time, SOL faces its final major horizontal Monthly resistance at $238.26 (black).
Clearing this resistance stack step by step, first the downtrend, then $238.26, and finally the wick highs, is necessary before Solana can fully open the door to potential new All Time Highs:
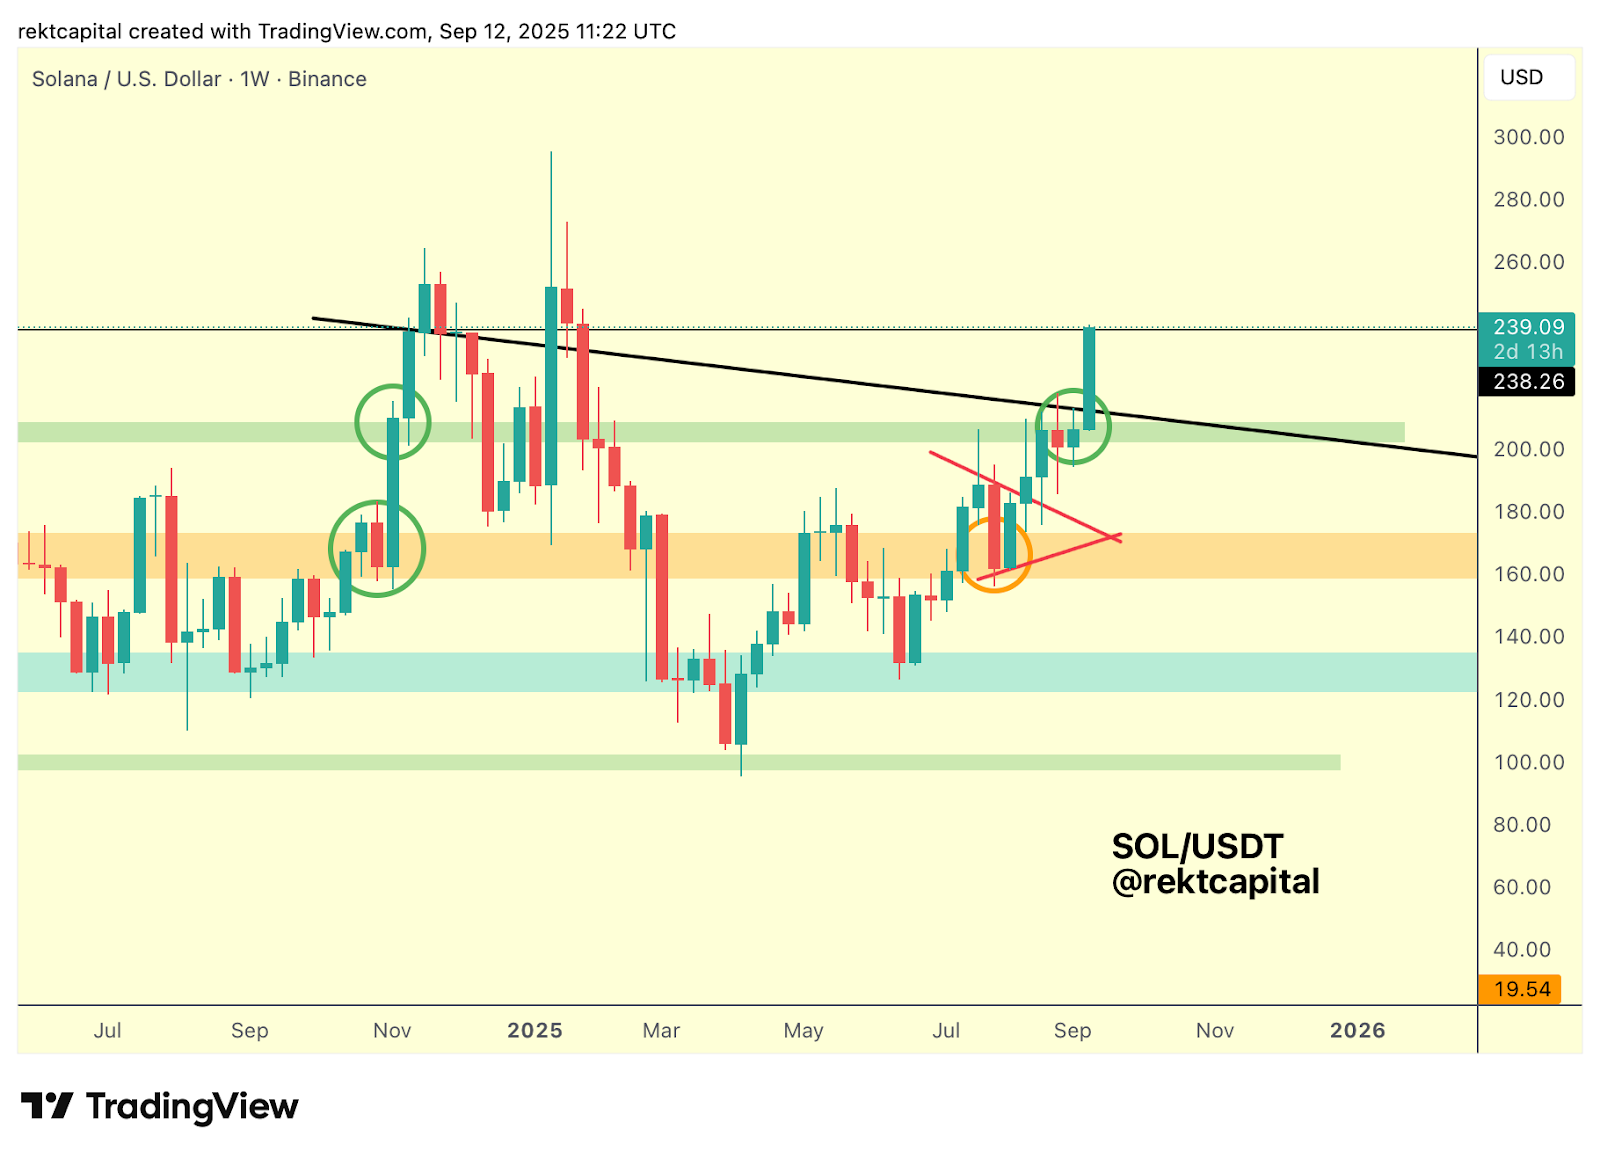
On the Weekly timeframe, what matters most is not just a single Weekly Close above the black Downtrend, but sustained stability above it over multiple weeks.
Past attempts showed that one Weekly Close, or even an initial retest in the subsequent week was not sufficient, as upside wicks above the trendline quickly failed.
This time, SOL needs to consolidate above the Downtrend, ideally with prolonged retesting of the Downtrend as new support, to invite stronger buy-side momentum.
If a Weekly Close is secured above $238.26 (black), subsequent pullbacks into the $224–$232 region could act as constructive volatility that effectively cements the breakout.
However, should SOL fail to Weekly Close above, price would remain trapped between the Downtrend and $238.26, leaving open the possibility of another deeper retest into as low as the Downtrend itself.
Virtuals Protocol – VIRTUAL/USDT
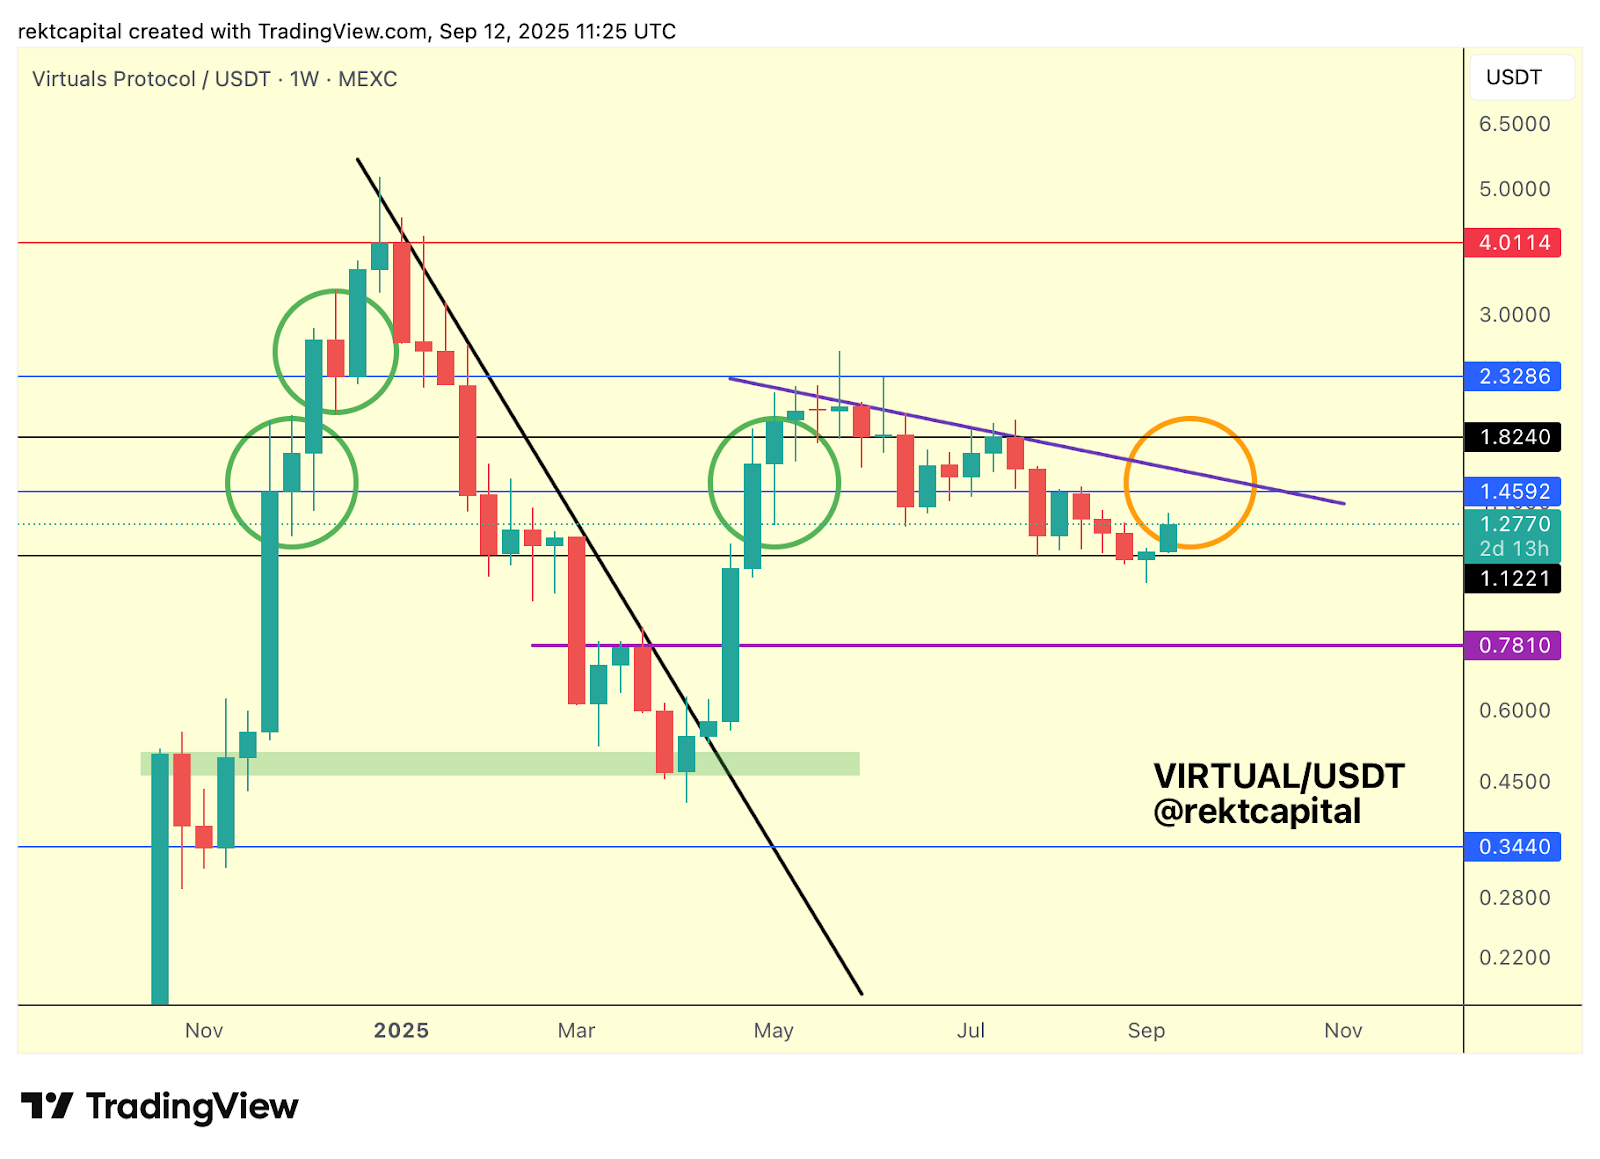
VIRTUAL has been capped by a Lower High resistance (black) dating back to late May, with repeated upside wicks beyond this level failing to generate follow-through.
Each failed attempt has reinforced the importance of securing a Weekly Close and post-breakout retest above the Downtrend, as upside wicks beyond this point have often occurred.
At the same time, price has produced successive Lower Lows, clustering into a narrow band between $1.12 (black) and $1.45 (blue).
Historically, Weekly Closes above $1.45 have been constructive pivot points, though the June attempt failed under broader Downtrend pressure.
If Virtual can now reclaim $1.45 as new support, buy-side interest could re-emerge to mount another challenge of the Lower High resistance.
In saying that, on the Daily timeframe momentum is beginning to shift beneath the surface:
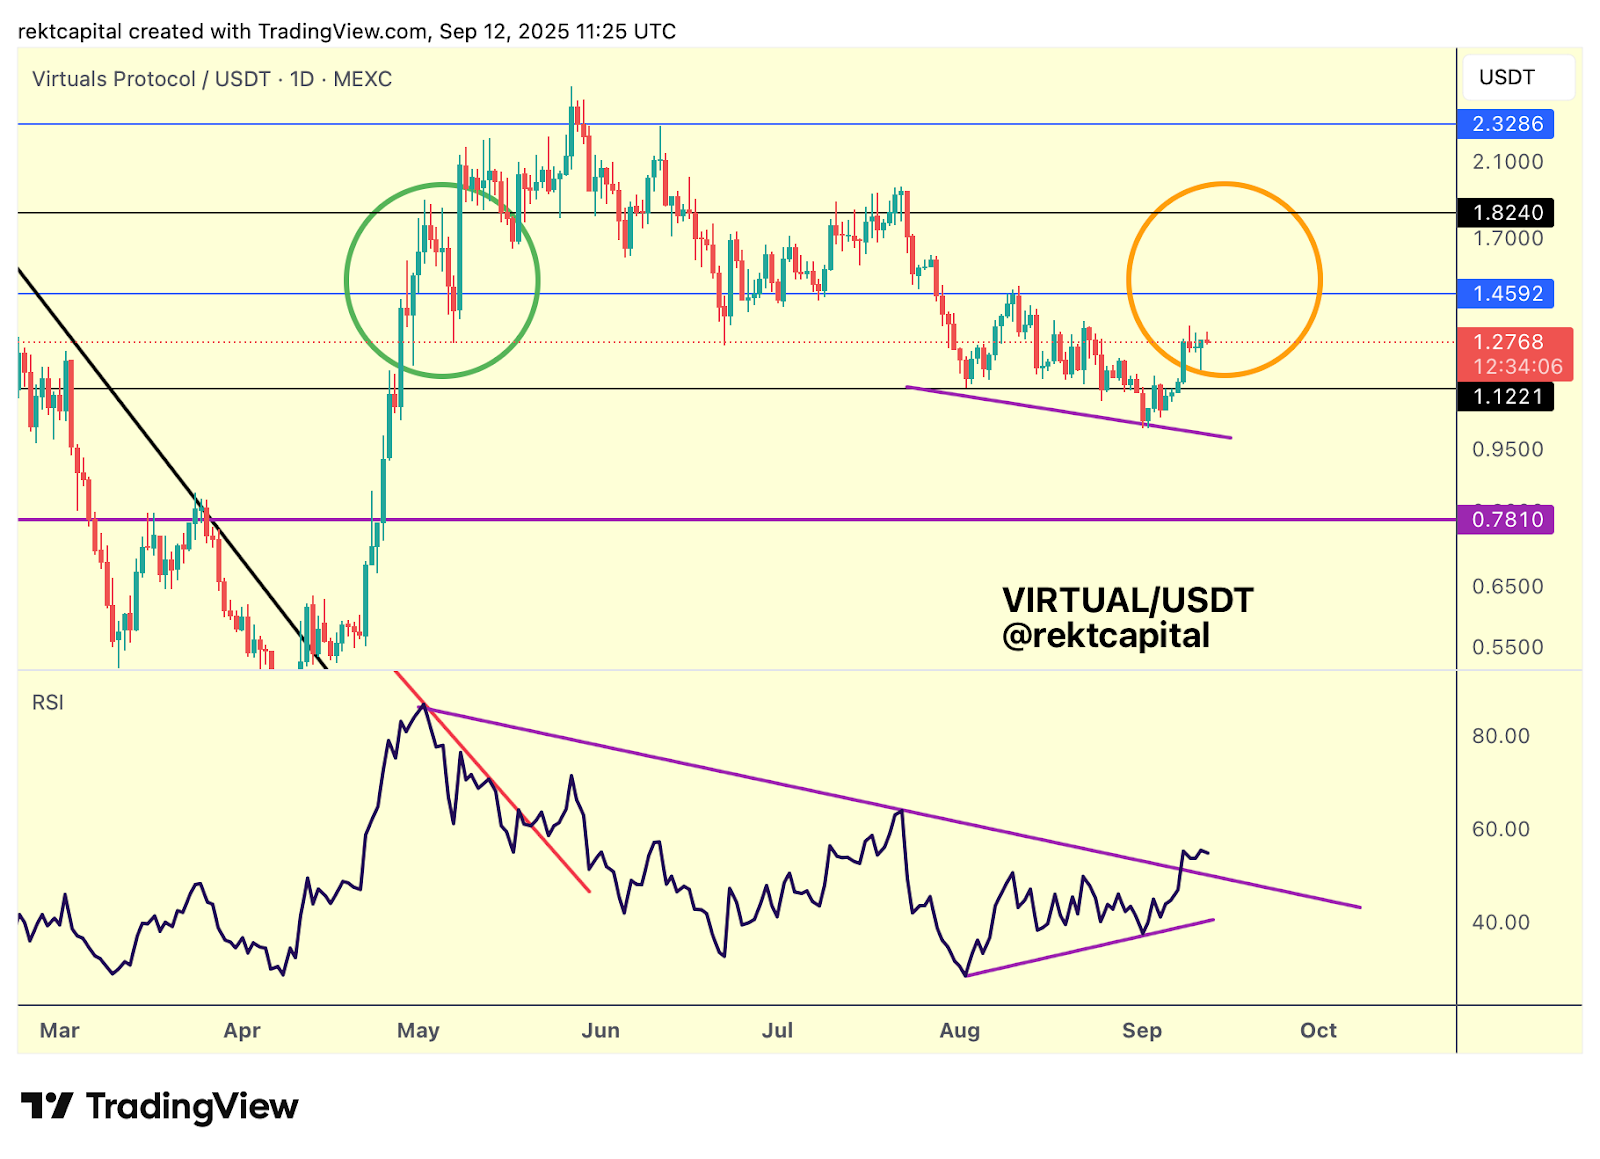
While price action has carved Lower Lows, RSI has begun forming Higher Lows, producing an early Bullish Divergence that hints at improving strength.
This divergence has already enabled the RSI to break its own Downtrend from May (purple), a development that often foreshadows similar behaviour in price action.
If the RSI stability holds above its broken trendline, probability of price breaking its Daily Downtrend improves.
From there, the sequence could unfold: first a daily price downtrend break, then an eventual test of the Weekly Downtrend that has capped rallies for months.
Each step depends on continued RSI resilience, but the early signals are encouraging.
Collectively, VIRTUAL is approaching a critical inflection.
Reclaiming $1.45 as support while maintaining RSI strength would align both price action and momentum, setting the stage for a breakout attempt beyond the Weekly Downtrend.