Altcoin Newsletter #221
Features FARTCOIN HBAR POPCAT TIA NEAR RENDER
Welcome to the Rekt Capital Newsletter, a resource for investors who want to better navigate the crypto markets with the help of cutting-edge crypto research and unbiased market analysis.
In today’s Altcoin newsletter I cover the following Altcoins - specifically:
- Fartcoin (FARTCOIN)
- Hedera Hashgraph (HBAR)
- Popcat (POPCAT)
- Celestia (TIA)
- Near Protocol (NEAR)
- Render (RENDER)
These Altcoin TA requests are made by valued readers of the Rekt Capital Premium Newsletter.
Let’s dive in...
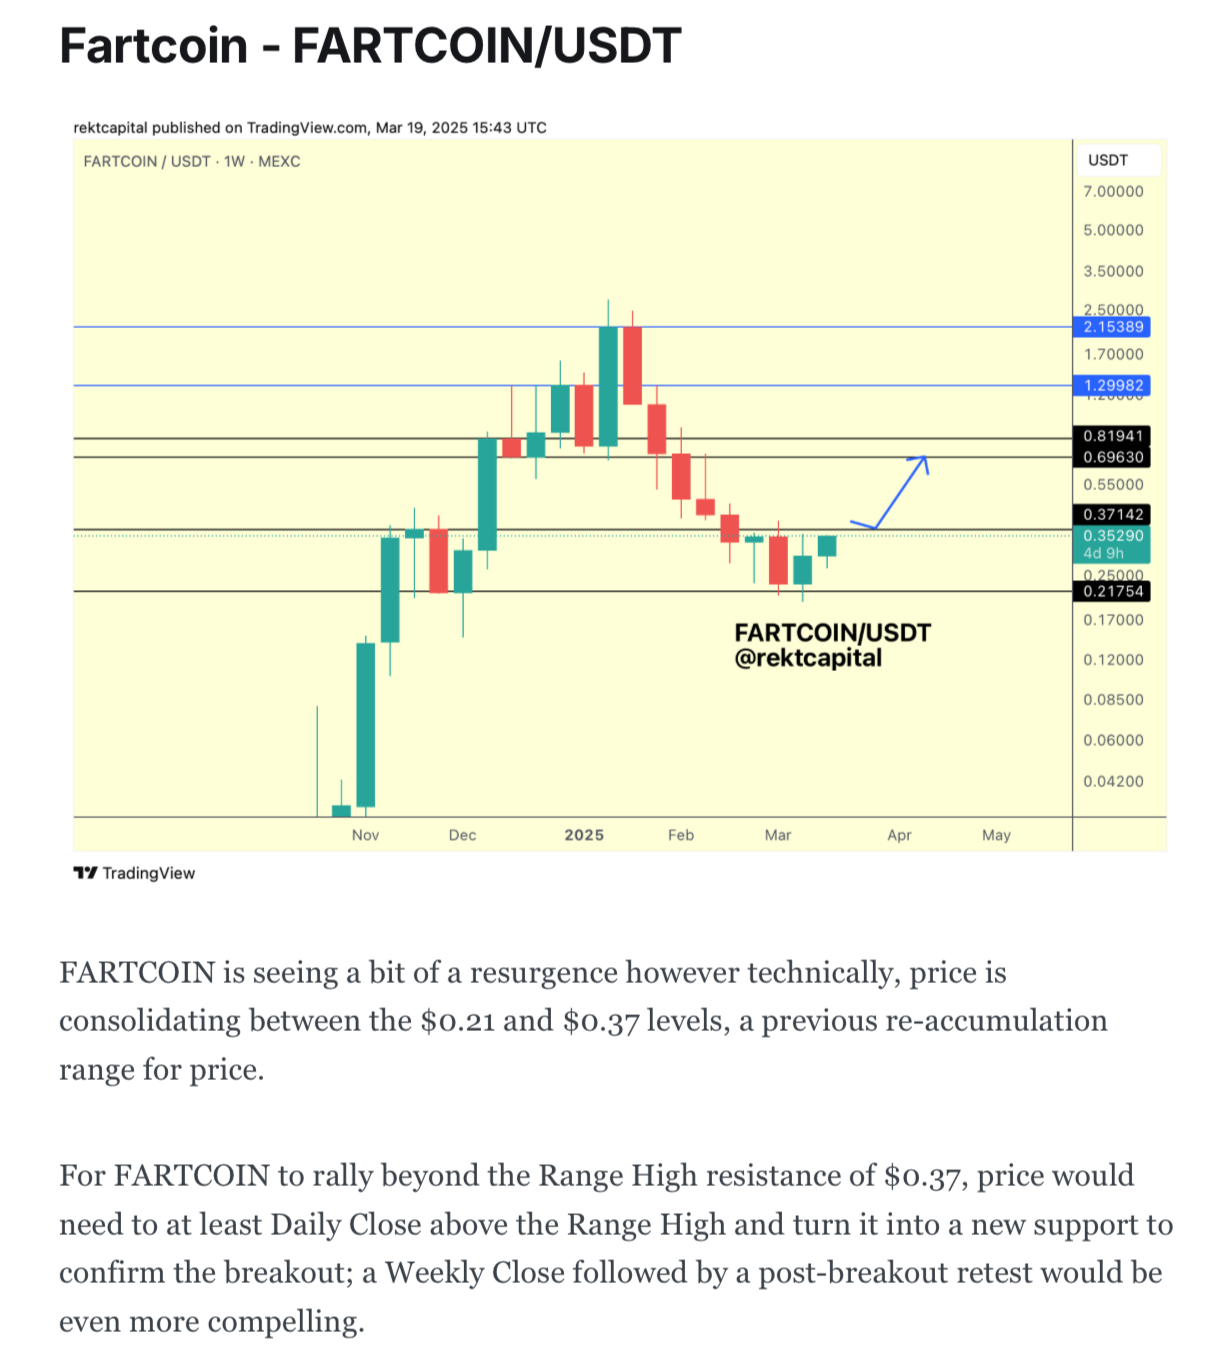
Fartcoin - FARTCOIN/USDT
FARTCOIN has been an coin we've been covering for weeks now - and with good reason.
Here is the analysis from mid-March:
Since then, FARTCOIN has progressively followed through on that path.
In following the that, price formed a Bull Flag:
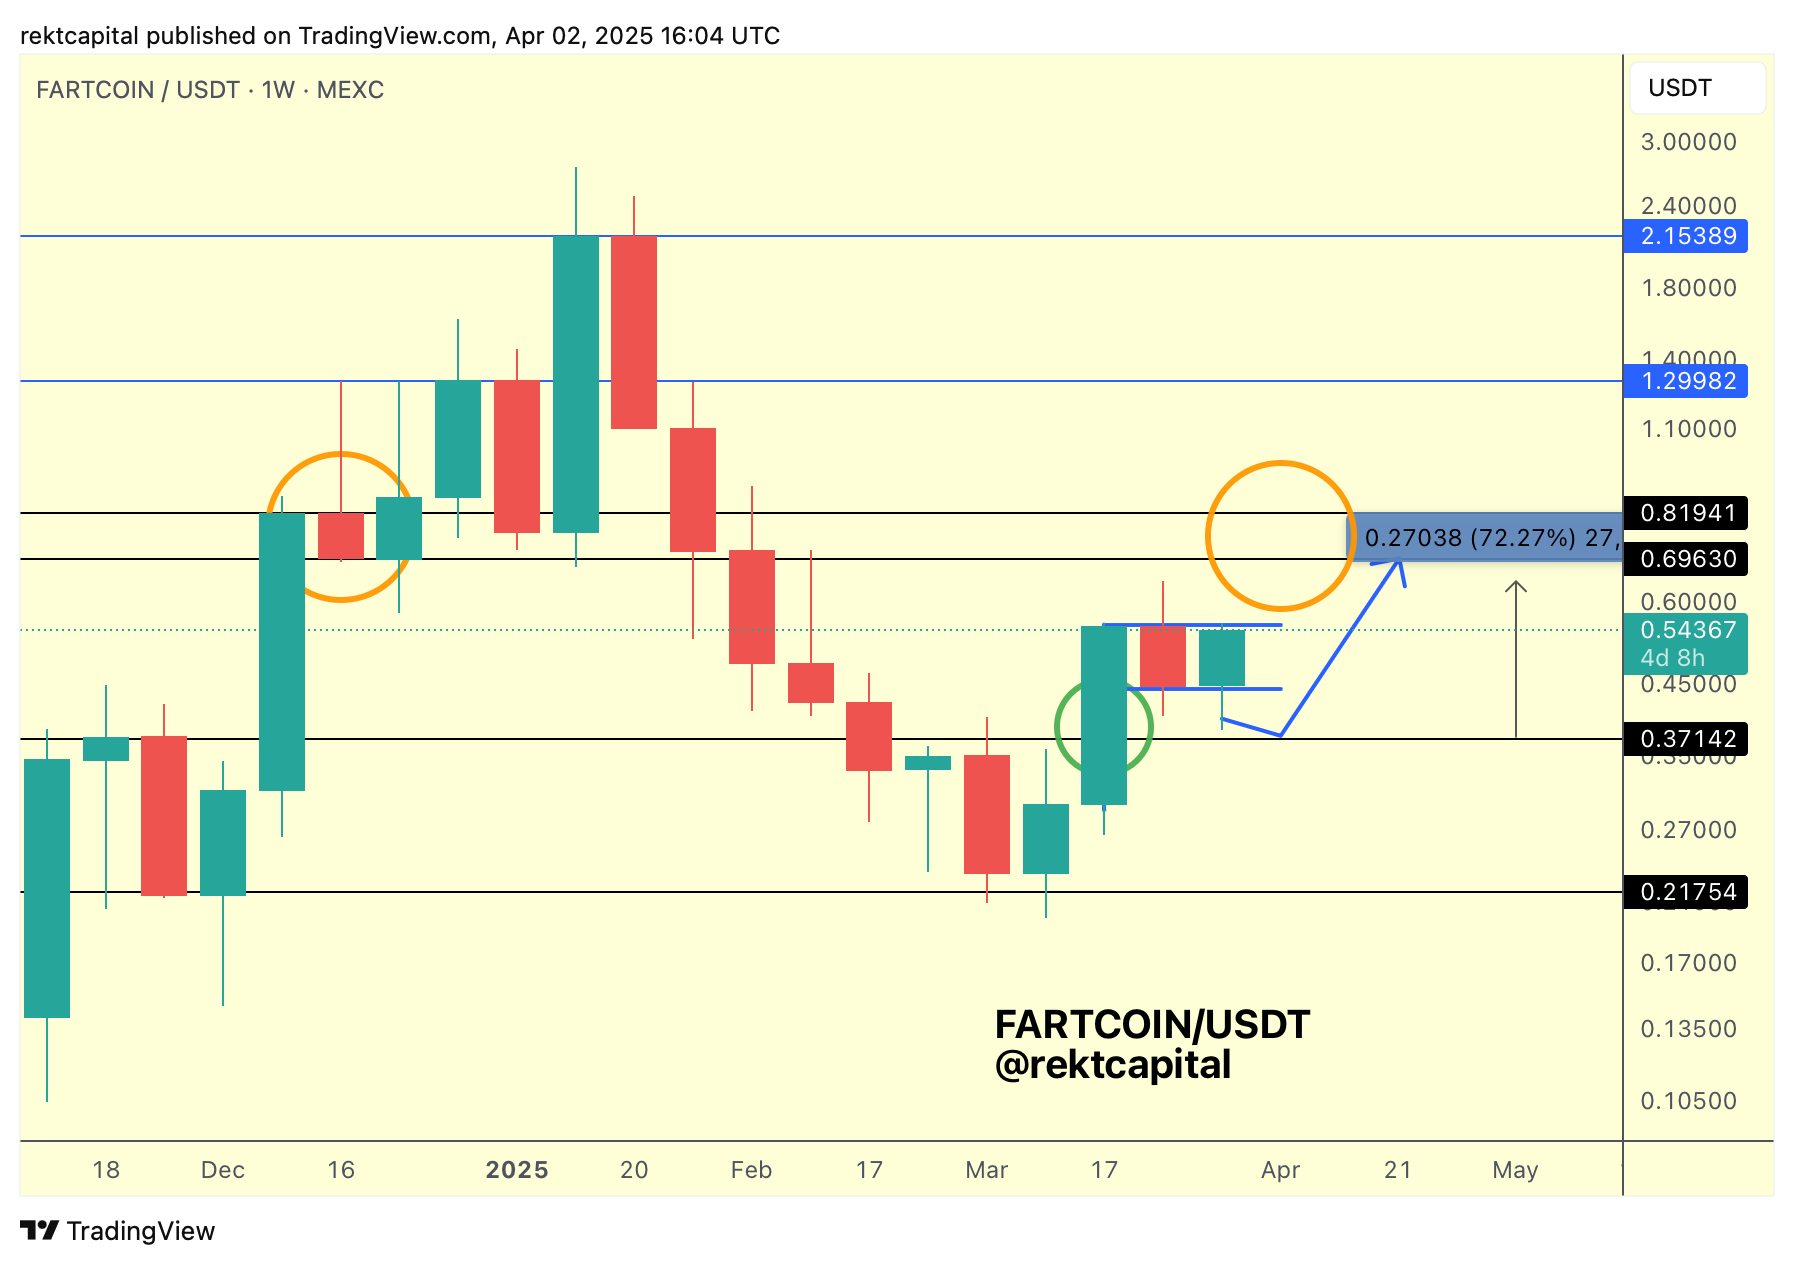
And inside that Bull Flag, price pulled back into the origin point of the blue path for a successful retest via a downside wick.
A since that successful retest, price rallied over +140% to the upside:
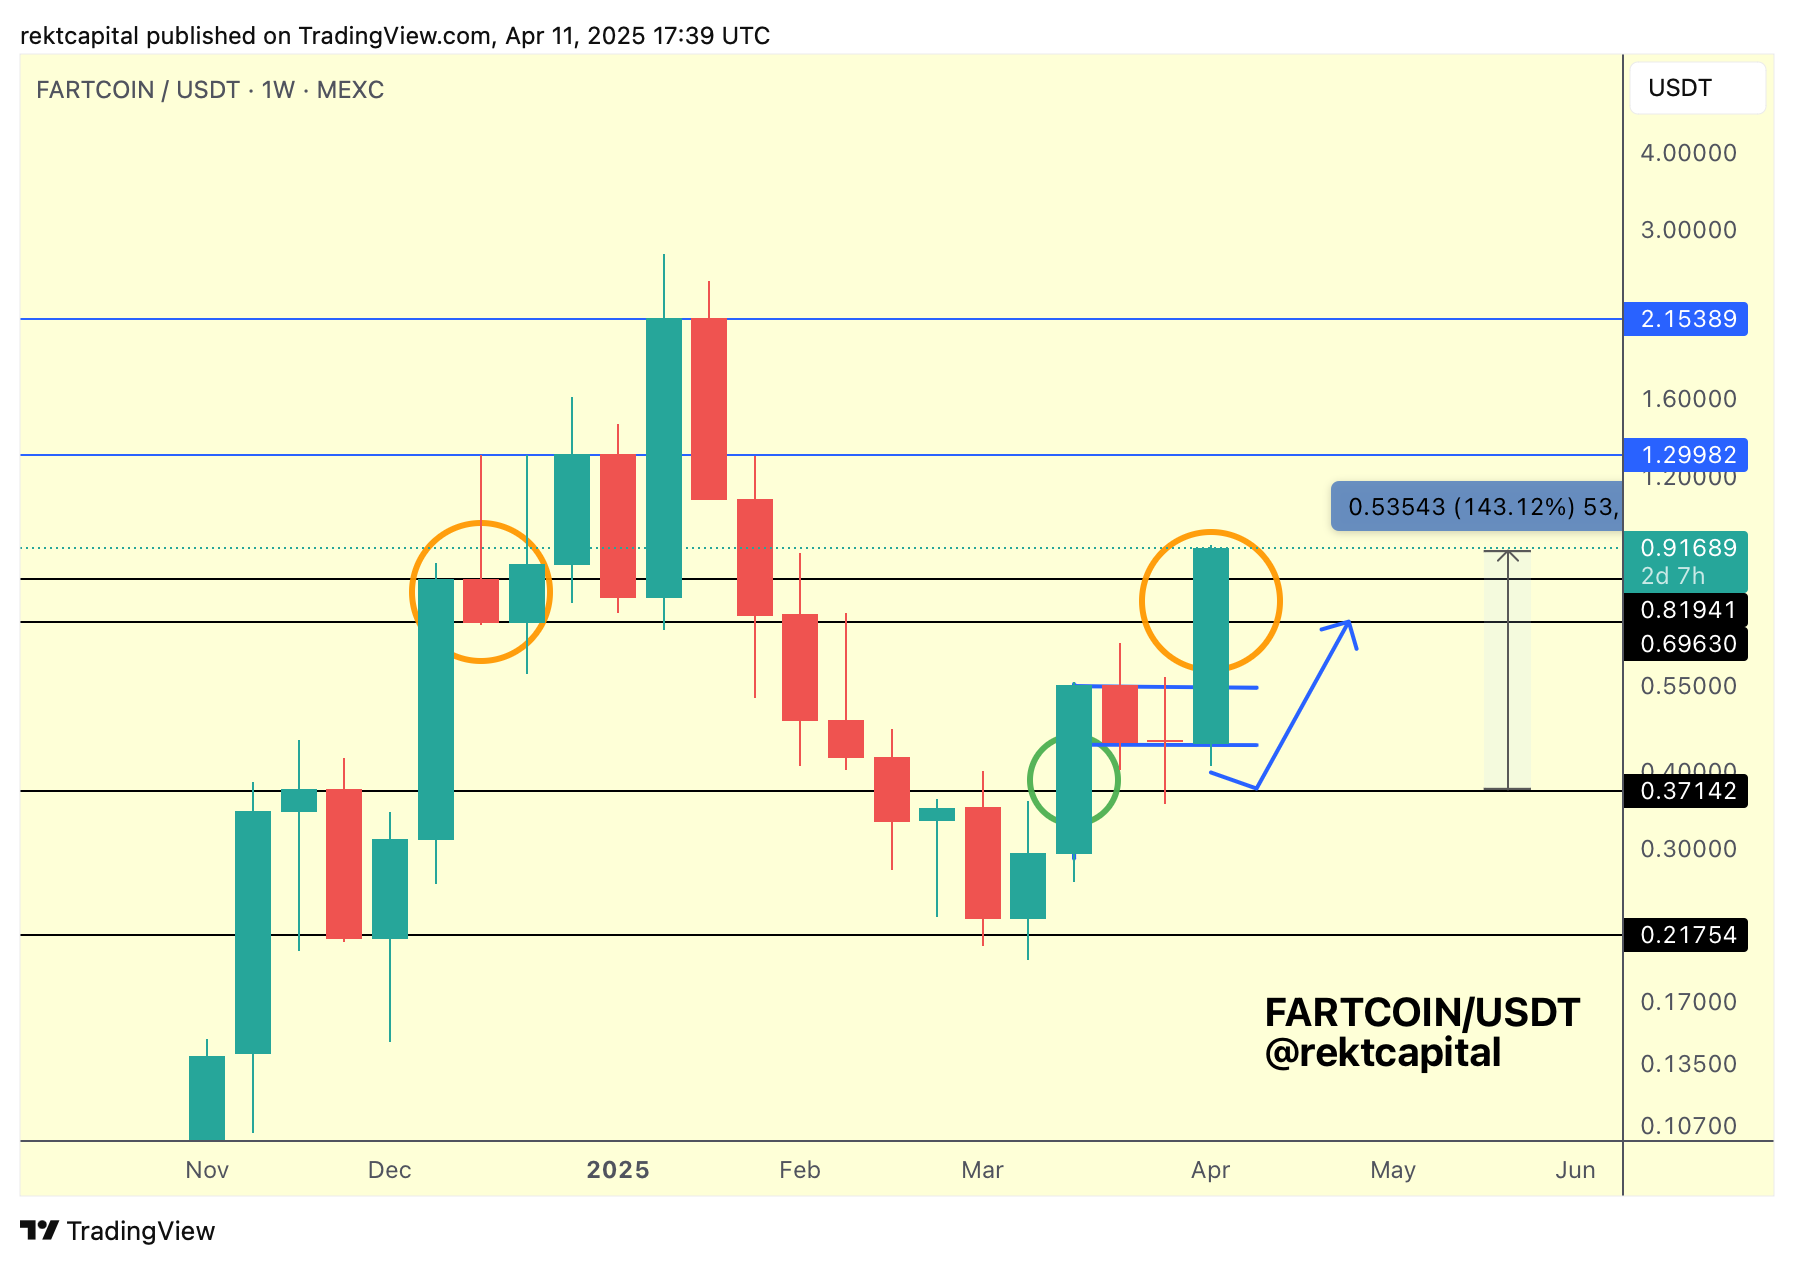
If FARTCOIN Weekly Closes inside the black-black range, encircled by the orange circle, then there would be scope for a re-accumulation within the range.
Weekly Close above the black Range High of ~$0.82 and in fact price could post-breakout retest that level into new support to actually confirm additional upside into the $1.29 resistance above (blue)
After all, a past Weekly Close above the ~$0.82 level has enabled upside in the past, as per the green circle:
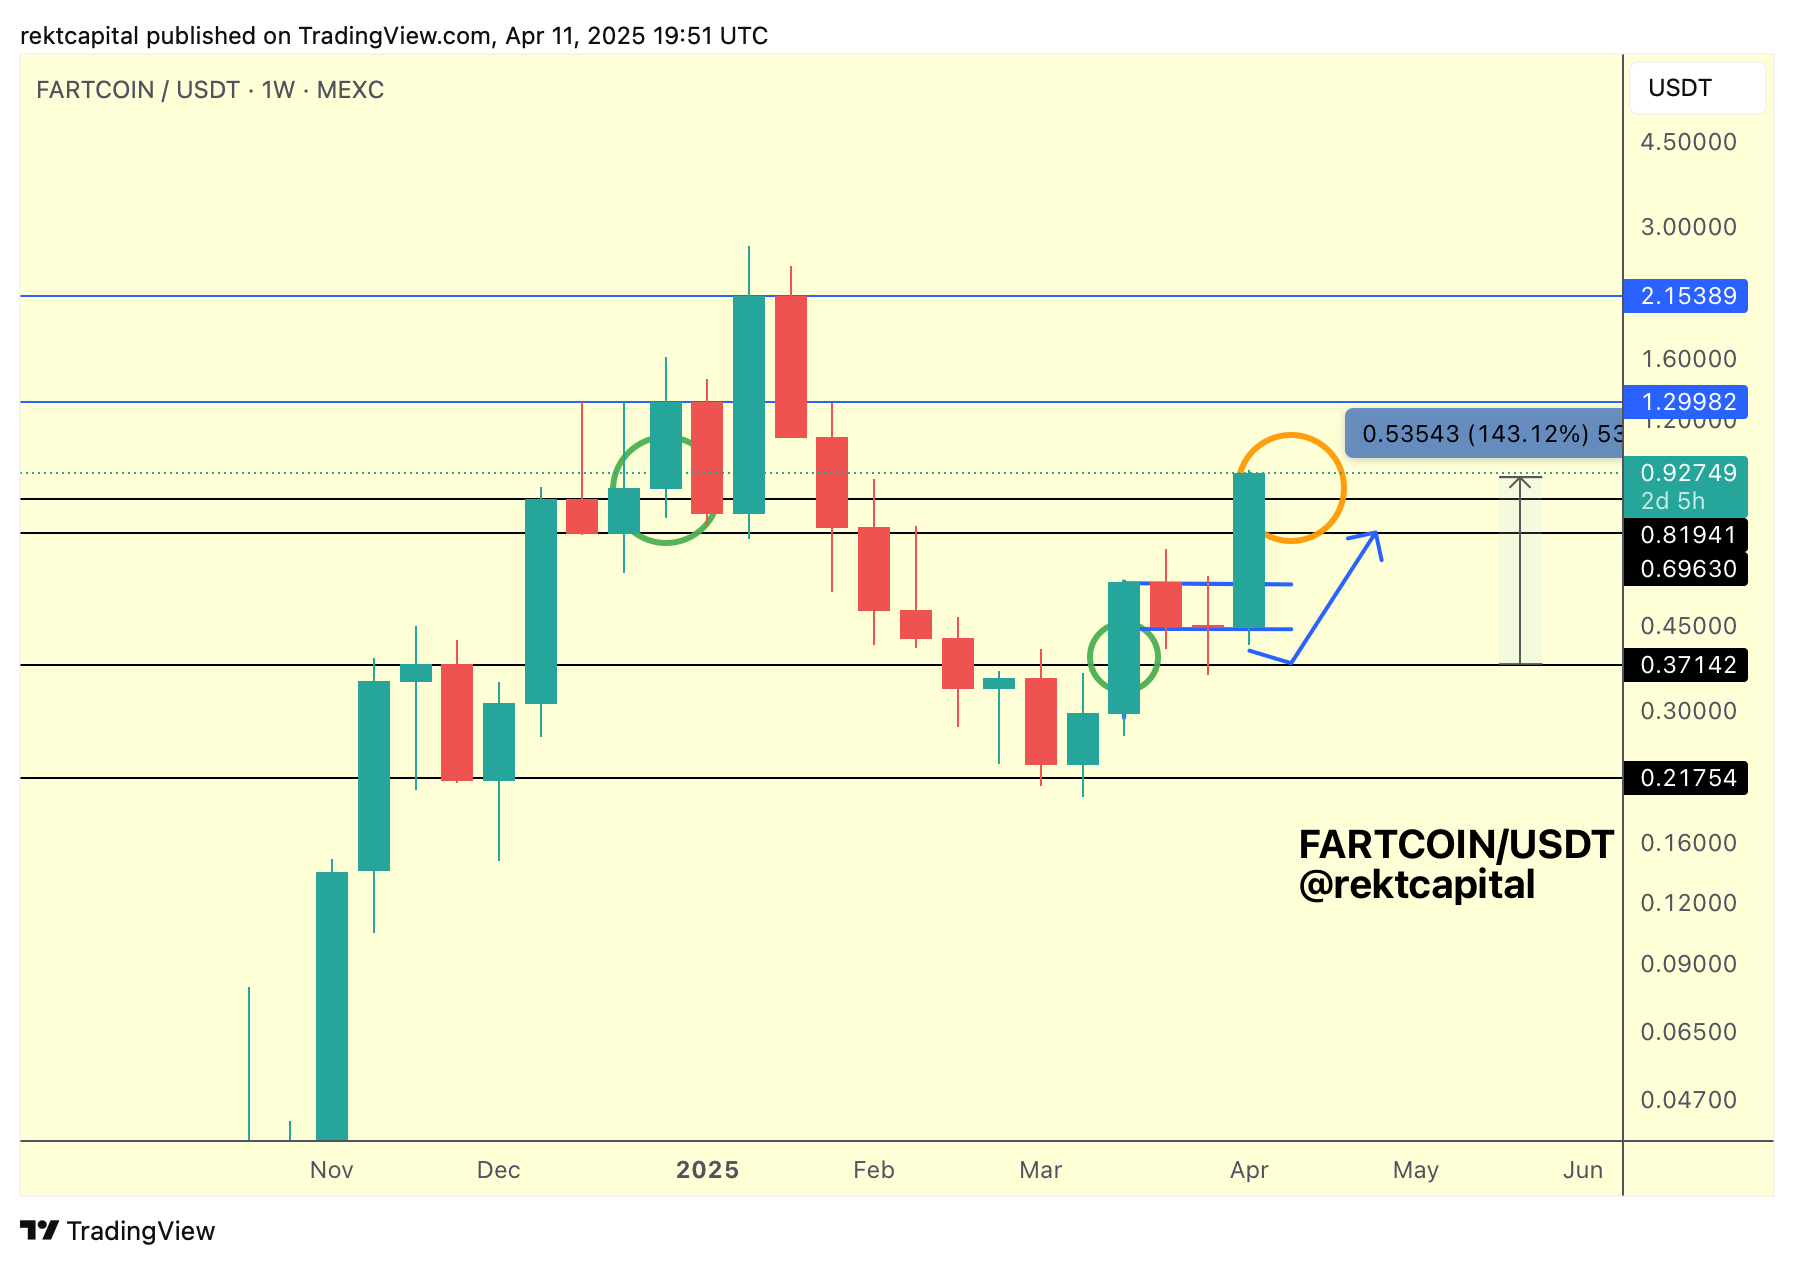
Overall, FARTCOIN simply needs to hold either of the black levels as support on any potential pullback and just that condition would position price for a revisit of $1.29 (blue highs) over time.
Hedera Hashgraph - HBAR/USDT
In late January, I spoke about how HBAR was showcasing so many signs of positioning itself for a retrace based on historical tendencies.
Here's that initial analysis:
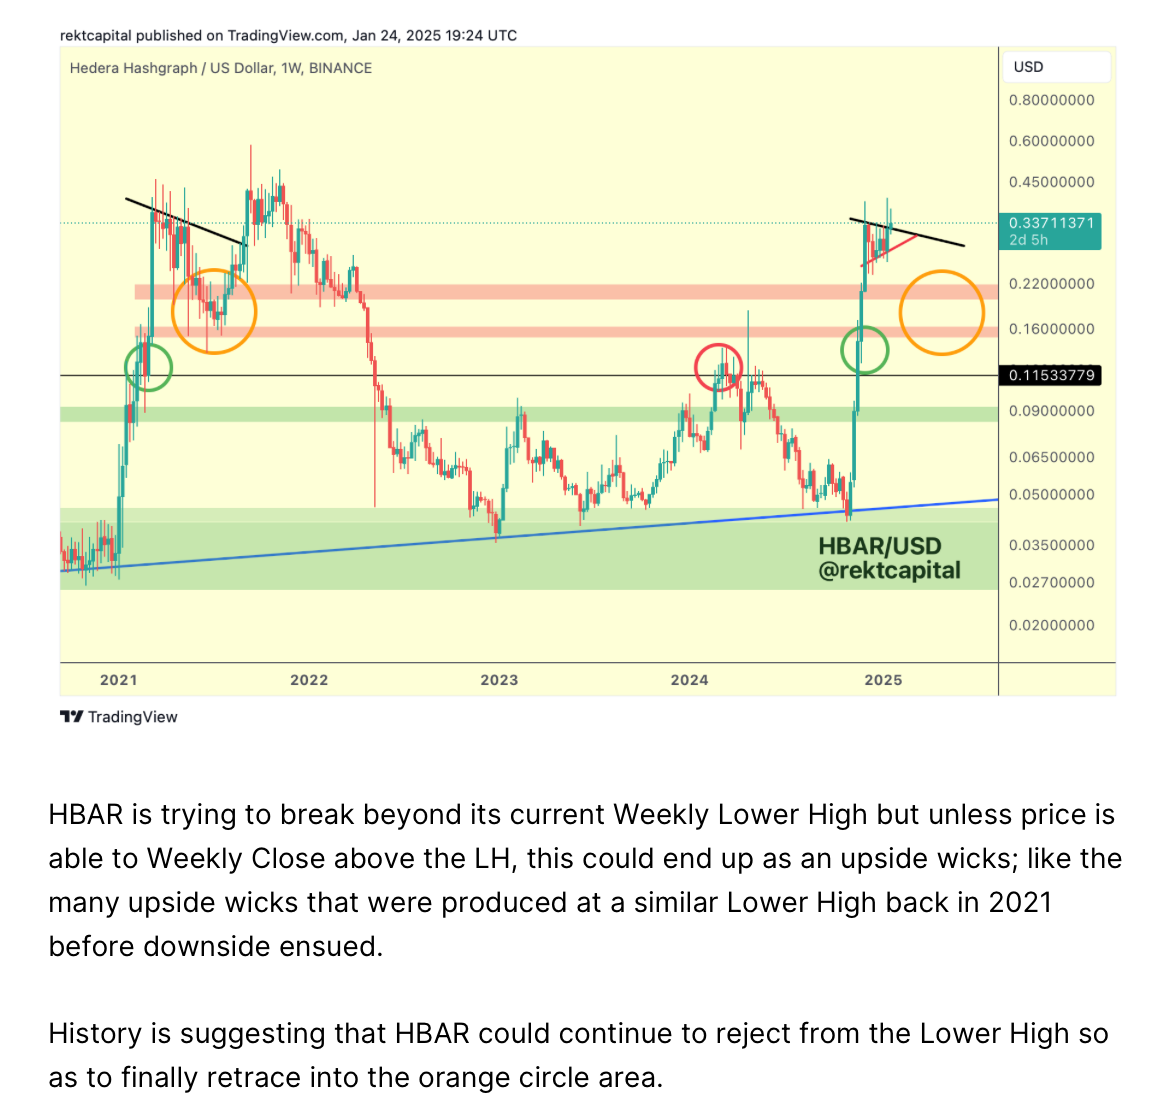
But it wasn't just because of HBAR's price history that things were looking a little unstable at highs.
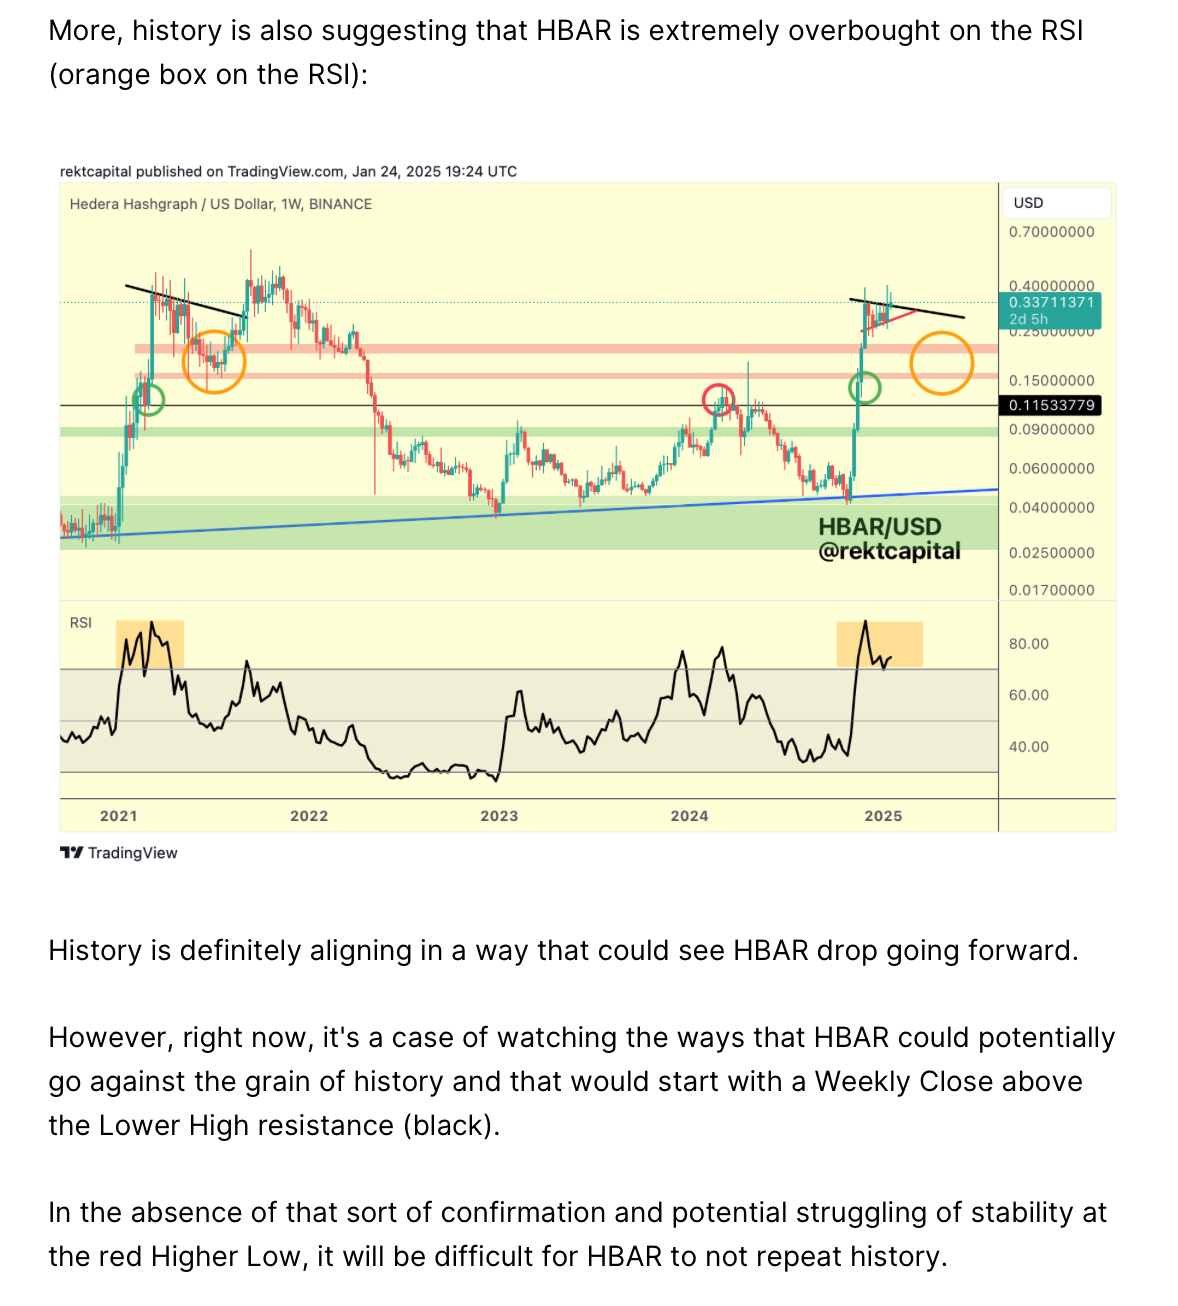
It was also because of the overbought nature of HBAR on the RSI.
Here's that analysis highlighting that:
Fast forward a few months and HBAR has certainly followed through on its historical price tendencies:
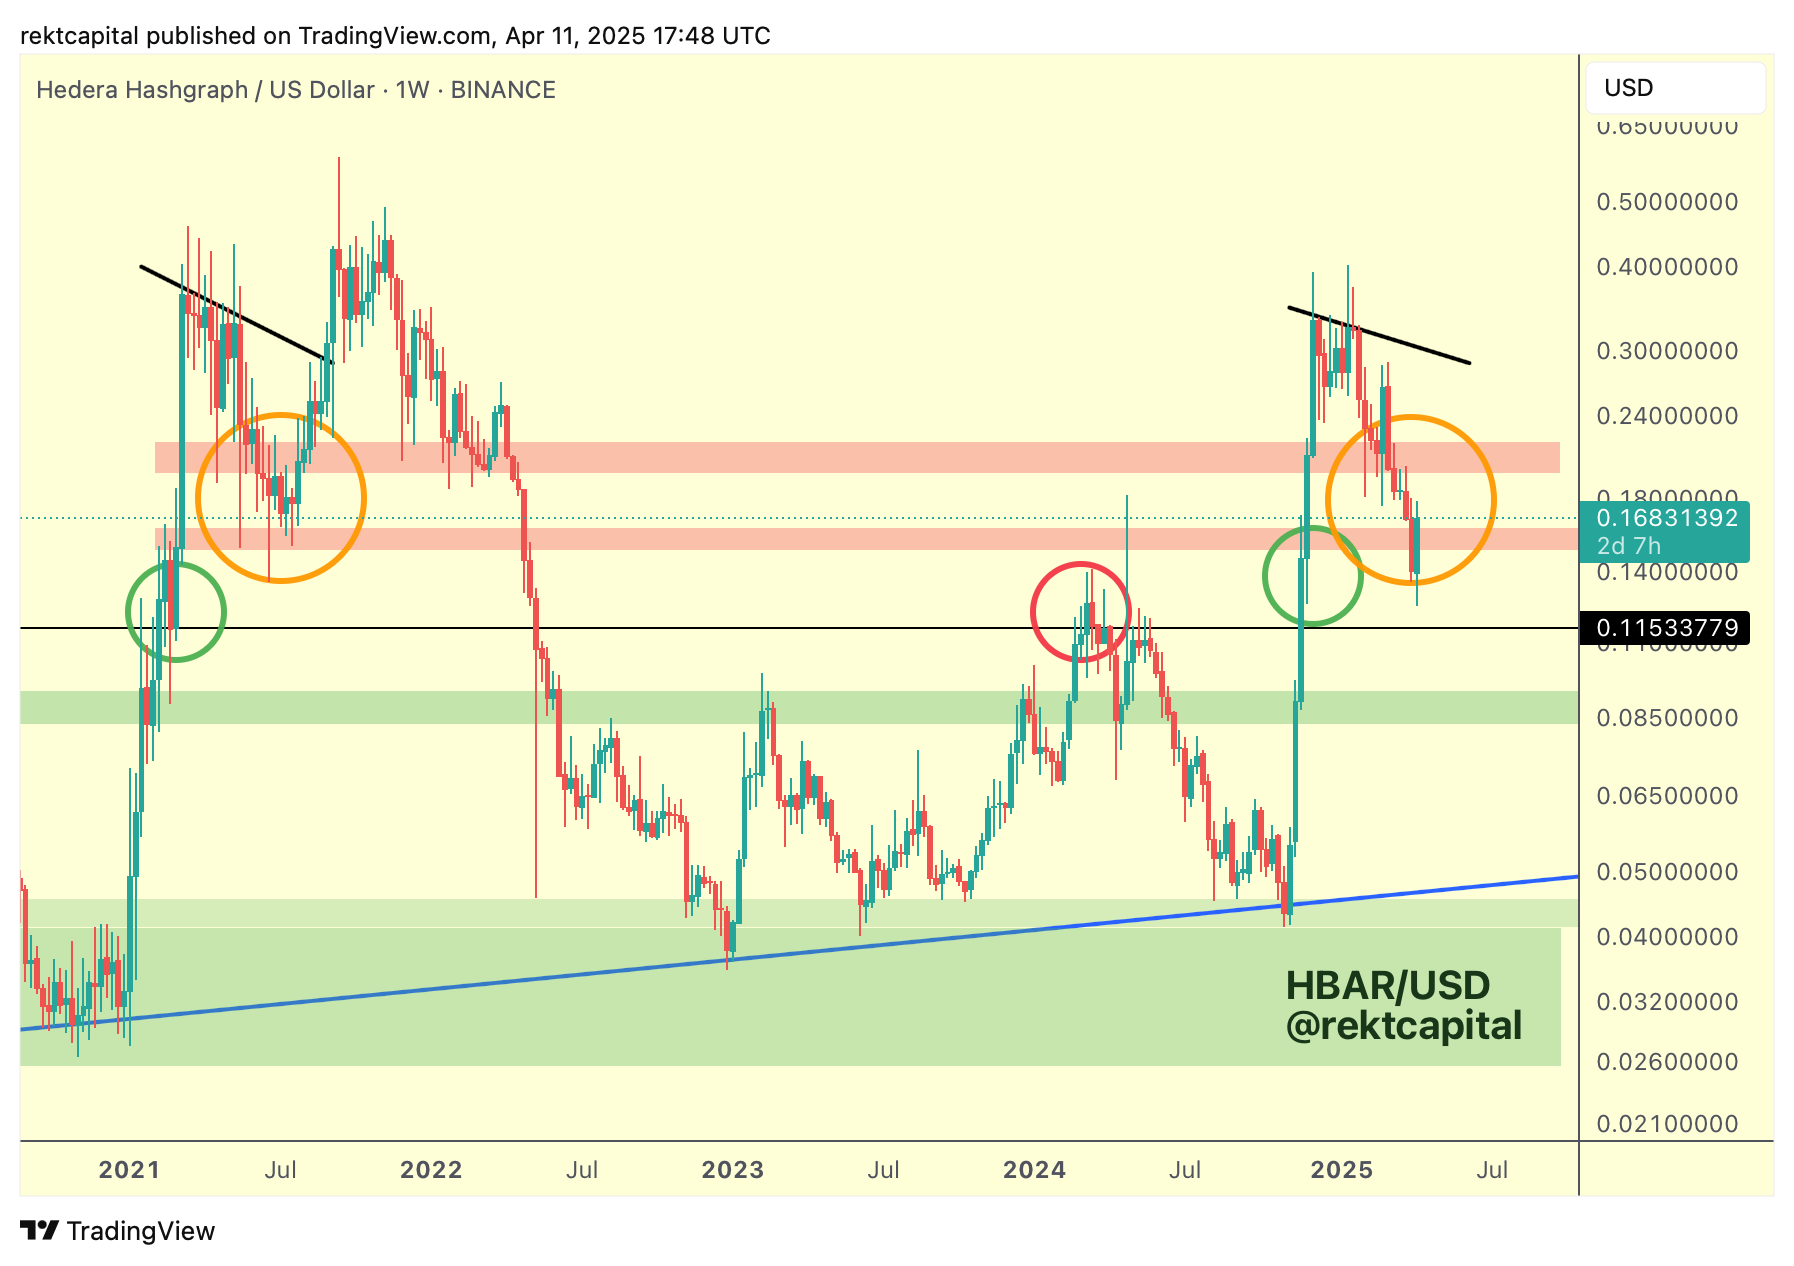
HBAR has indeed followed through and retraced right into the orange circled region, repeating history.
Now, it's all about HBAR maintaining itself at this local red area and holding it as support, after briefly losing it last week.
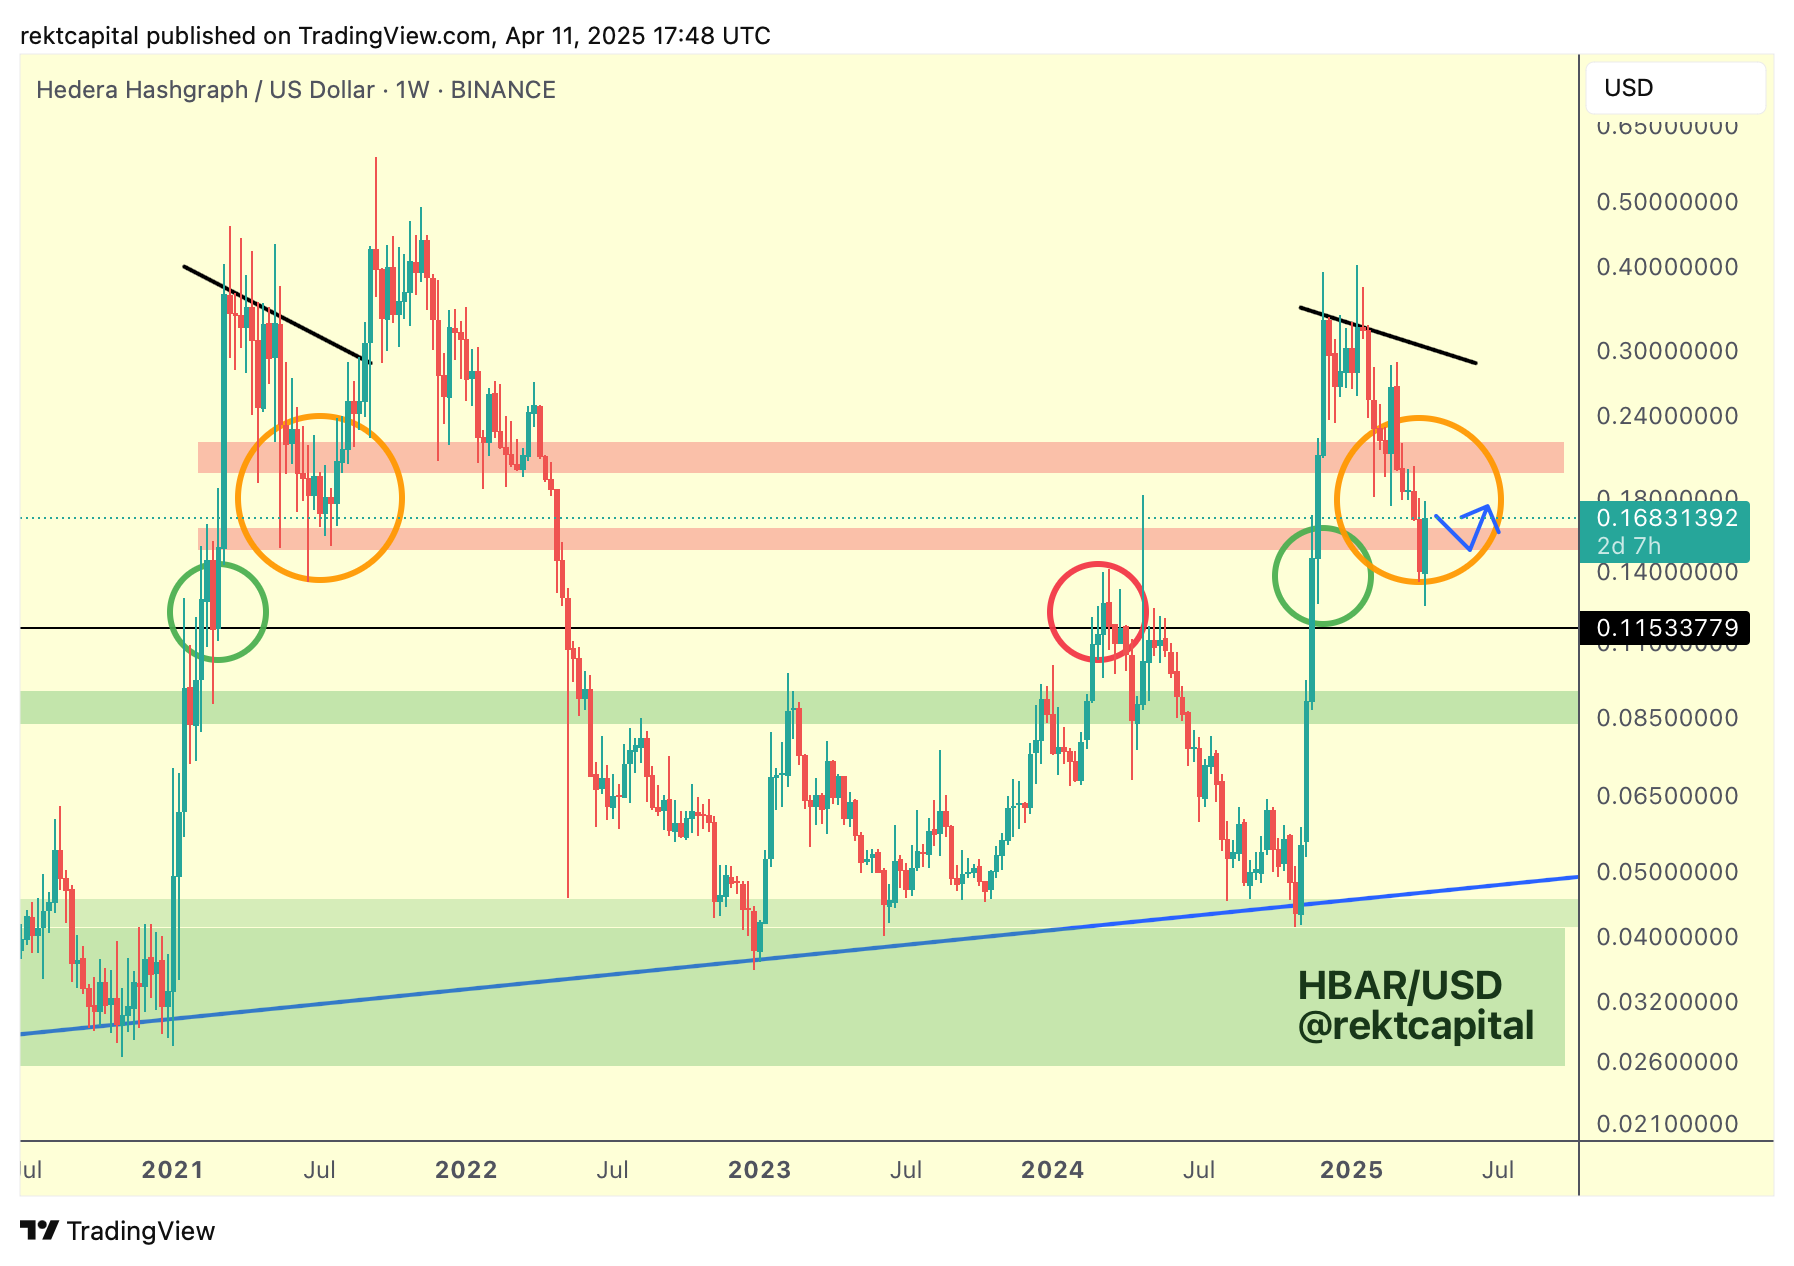
So effectively, HBAR needs to Weekly Close just like this to position itself for a post-breakout pullback to confirm a reclaim of this red area back into support:
HBAR needs to do this in the context of the following situation on the RSI:
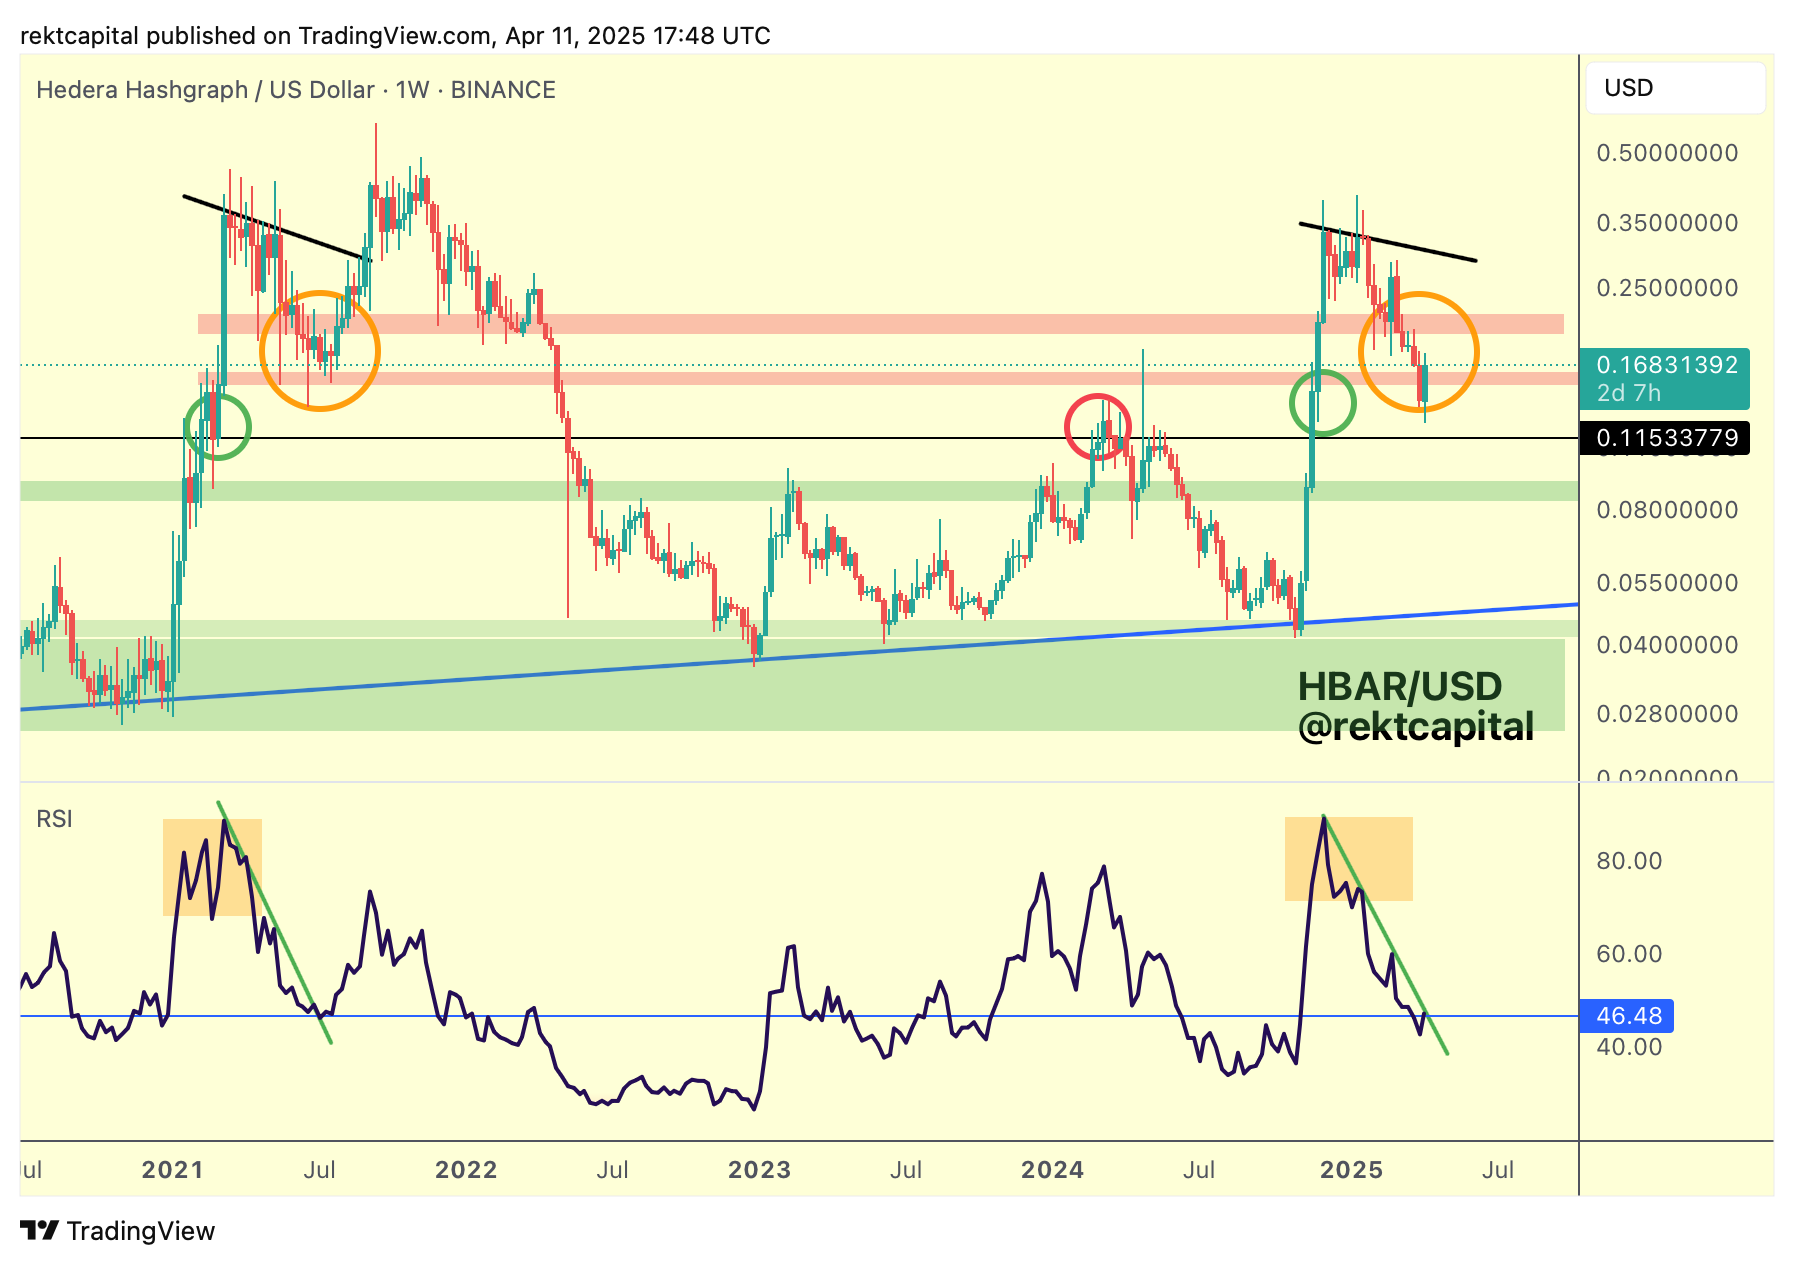
The RSI has dropped from tremendously Overbought (orange box) right into the blue 46 RSI level which back in mid-2021 was a reversal zone, especially confirmed after breaching the multi-month RSI Downtrend (green).
So history isn't just repeating itself for the price action, but also for the RSI as well.
If HBAR is able to reclaim the red area as support and the RSI is able to break its green Downtrend resistance, then price should start to successfully base at this red region of support from which it will be able to springboard.
That springboard would occur with the goal to revisit the upper red boxed resistance above to try and breakout above and reclaim it as support, as per mid-2021 tendencies.
But that's a story for another day - for now, it's all about building a base here to further enable history to repeat once again.