Altcoin Newsletter #192
Features JUP AKT PEPE DOT GRT ADA ONDO
In today’s Altcoin newsletter I cover the following Altcoins - specifically:
- Jupiter (JUP)
- Akash Network (AKT)
- Pepe (PEPE)
- Polkadot (DOT)
- The Graph (GRT)
- Cardano (ADA)
- Ondo (ONDO)
These Altcoin TA requests are made by valued readers of the Rekt Capital Premium Newsletter.
Let’s dive in...
Jupiter - JUP/USDT
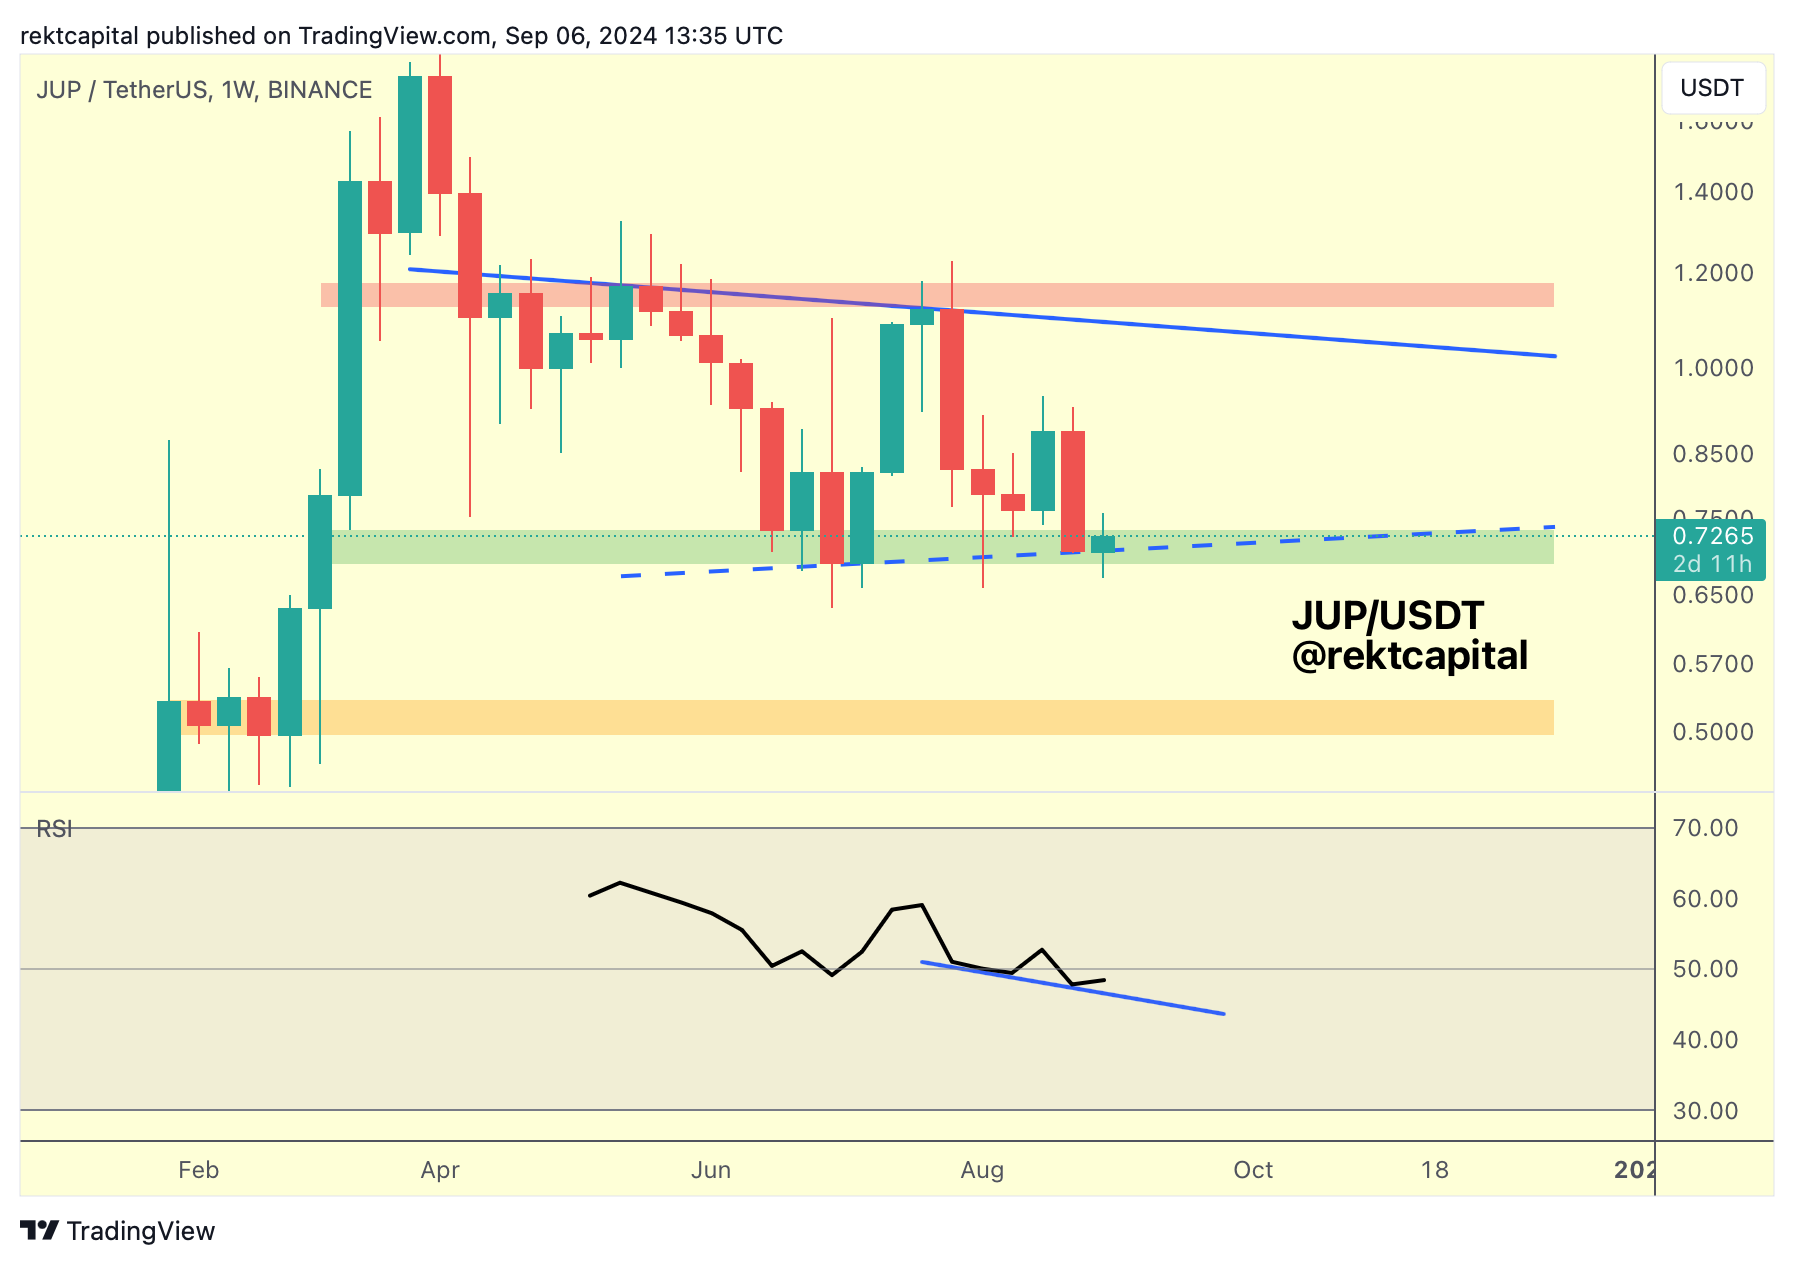
JUP is inside a Macro Range.
The green area is the Range Low and the red area is the Range High resistance.
A blue series of Lower Highs are developing around the Range High area; in the future, these Lower Highs could act as a point of rejection.
However, for the time being, JUP is holding the green Range Low area as support.
In fact, there are early-stage signs that JUP could be forming a new Higher Low (blue dashed trend line).
Meanwhile, the RSI continues to form Lower Lows.
Lower Lows on the RSI along with Higher Lows on the price action bring about a Hidden Bullish Divergence.
For this Bull Div to play out, JUP needs to confirm this new Higher Low and continue holding the green area as support.
A Weekly Close below the green area could kickstart a breakdown process, especially if JUP flips the green area into new resistance afterwards.
Price stability here is crucial for the Bull Div to play out.
One last comment about the Bull Div itself:
Two weeks ago, JUP was forming a Higher Low meanwhile the RSI was developing Lower Lows, so technically the Bull Div existed even back then.
But a breakdown occurred since that time, which just shows that early-stage Higher Lows are not always reliable and Bull Divs take time to fully develop before playing out.
JUP is a good example of how price can continue dwindle while potentially having a Bull Div but at some point in the future, JUP will be able to sustainably reverse to the upside, provided the Bull Div has fully matured and price stability is maintained at crucial support areas (in this case, at the green area).
Akash Network - AKT/USDT
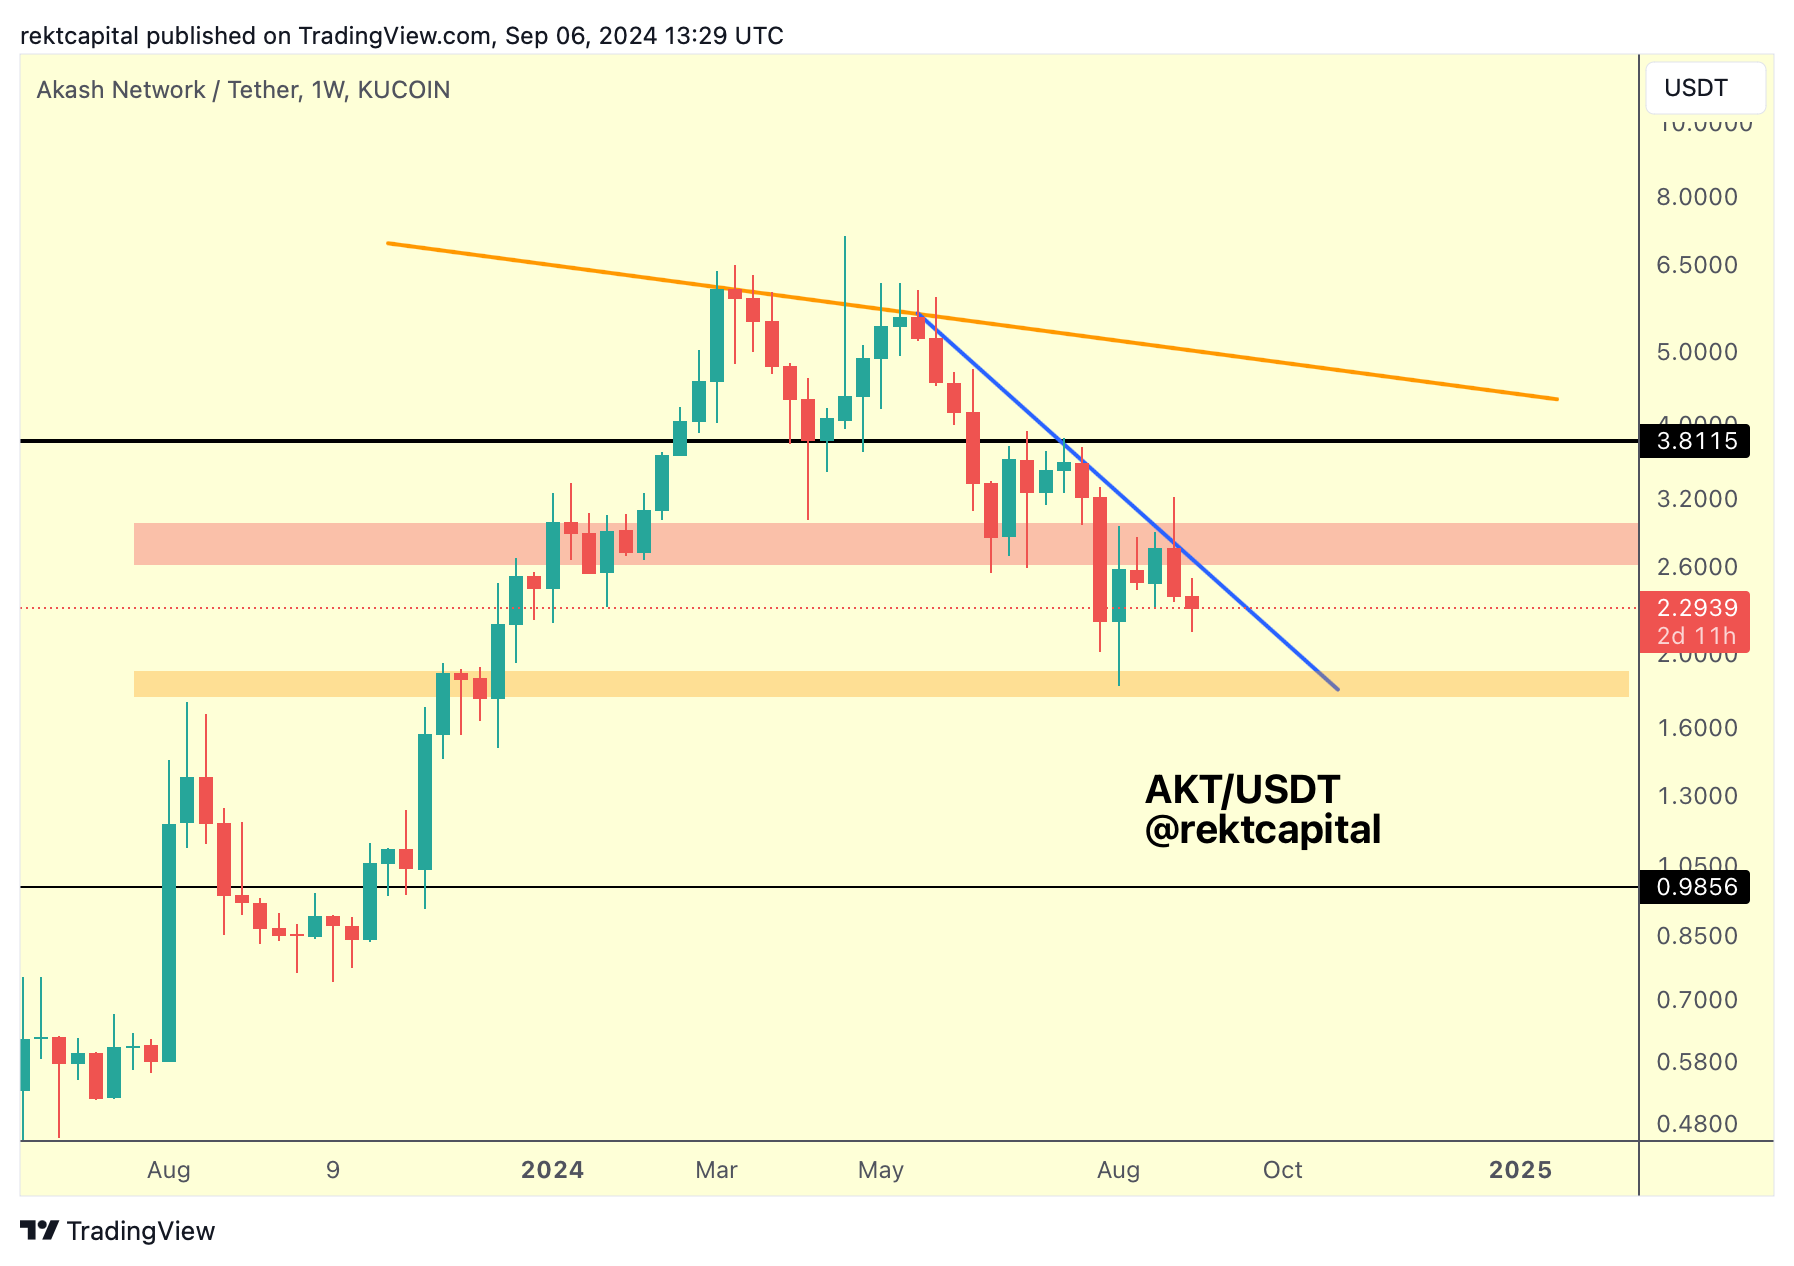
Around early Summer, AKT formed a new Macro Downtrend (orange).
And since then, AKT formed yet another Downtrend (blue) and it is this Downtrend that has been weighing down on price and rejecting AKT to lower and lower lows.
A few weeks ago, the red area acted as support but this blue Downtrend rejected price to the point that AKT lost this area and is showing initial signs of turning it into new resistance.
Interestingly, this red area is acting as confluent resistance with the blue Downtrend; more, this red area may become the new Range High, with the orange area below potentially acting as a new Range Low.
If AKT continues to reject from the blue diagonal then a drop into the orange area could be on the cards.
AKT would need to Weekly Close above the blue diagonal to kickstart a new uptrend but does AKT have the strength to breakout now that the blue Downtrend and red boxed resistance are acting as a confluent rejection zone?