Altcoin Market Update
Features analysis on Altcoins such as FARTCOIN APT TAO CPOOL POPCAT SUI AVAX
Hello and welcome back to the Rekt Capital Newsletter.
In today’s edition, the following cryptocurrencies will be analysed & discussed:
- Aptos (APT)
- Fartcoin (FARTCOIN)
- Bittensor (TAO)
- Clearpool (CPOOL)
- Popcat (POPCAT)
- Sui (SUI)
- Avalanche (AVAX)
But before we dive in, this Friday I’ll chart your Altcoin picks in an exclusive subscriber-only TA newsletter and will cover as many as I can
So if you’d like to have an Altcoin charted, feel free to share max. two TA requests each in the comments below.
I’ll chart the Altcoins that get mentioned and ‘Liked’ the most
Click the button below to leave a comment with your TA request!
Let's dive in to today's Altcoin Market Update.
Aptos - APT/USDT
Last week we spoke about the dangers of a higher timeframe bearish retest for APT, even though price was showcasing initial signs of trying to form a lower timeframe bullish divergence:
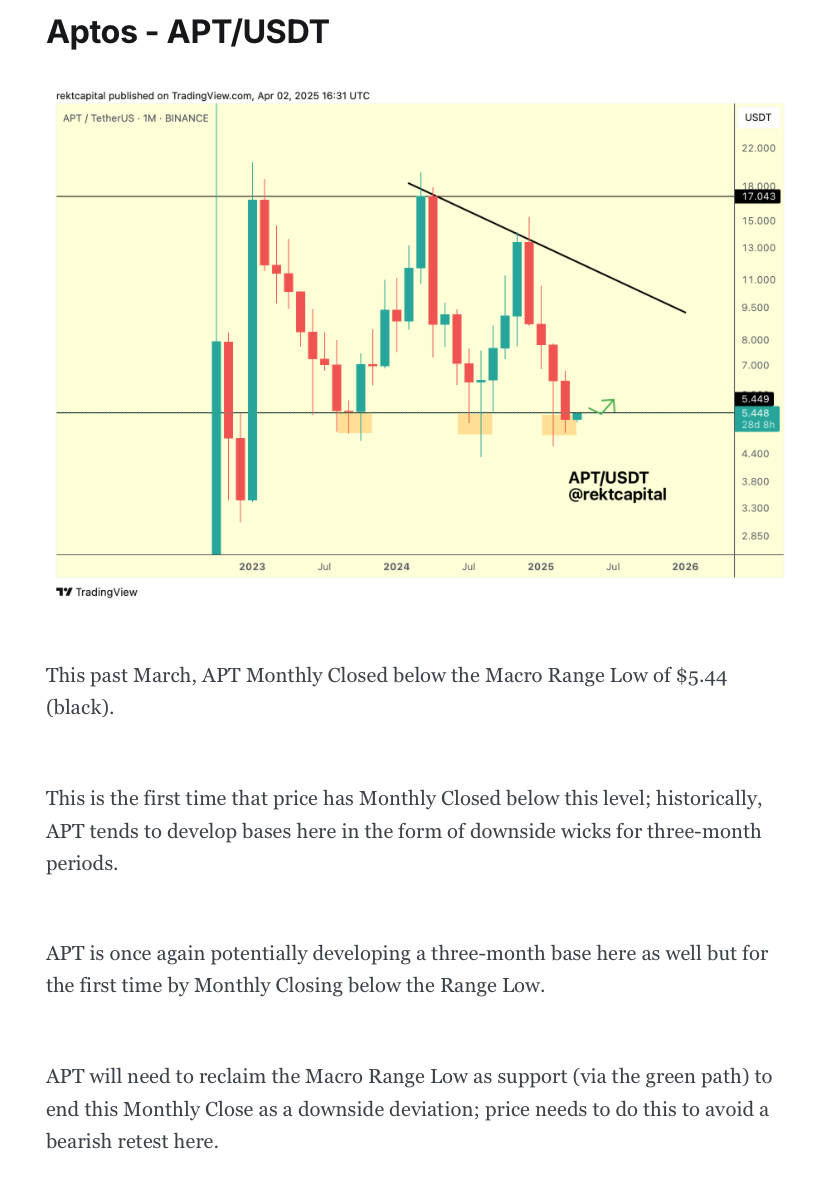
Ultimately, APT has followed through on that bearish retest and rejected from the previous Macro Range Low, treating it as resistance:
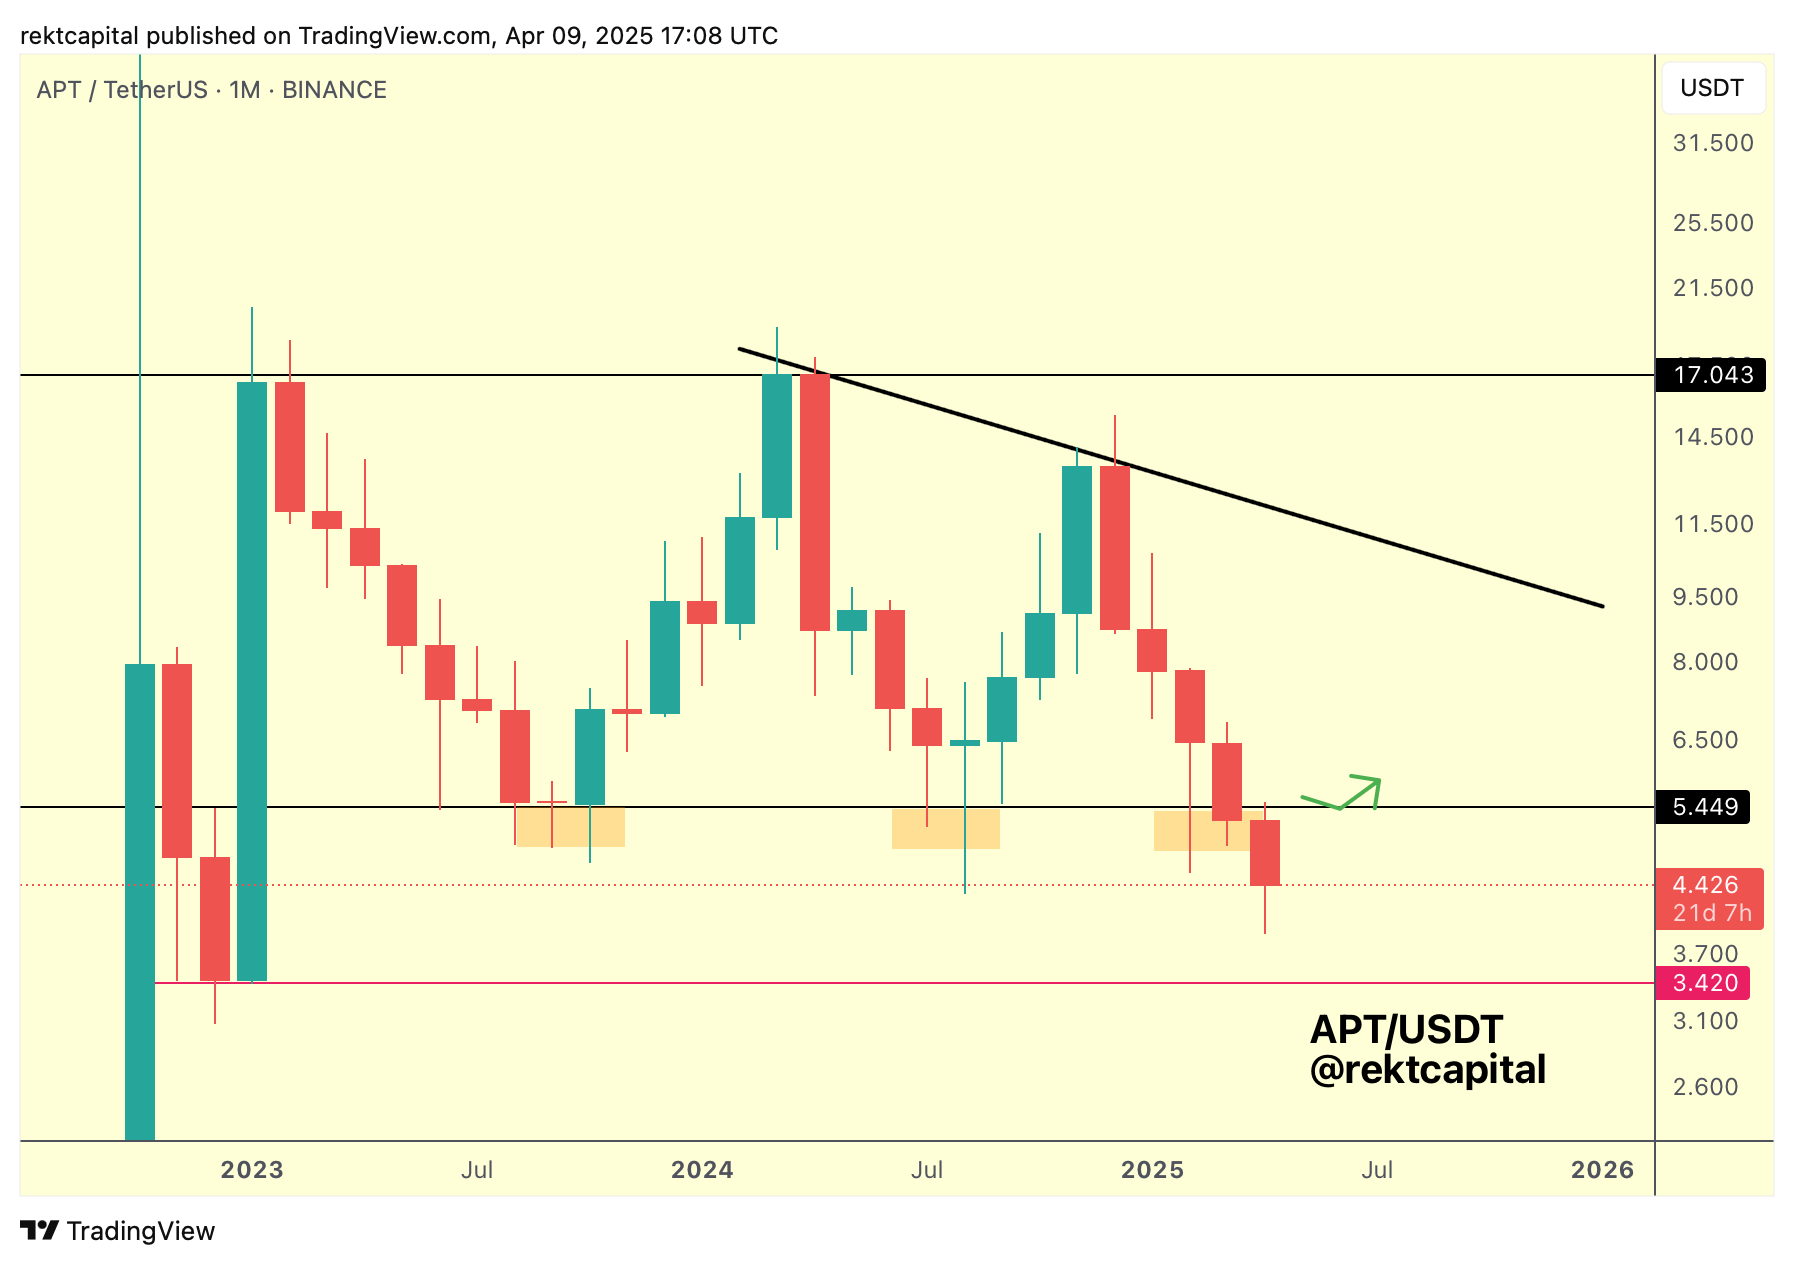
Of course, technically, APT still has an entire month to reclaim the previous Macro Range Low, but in the meantime price is deviating below the general range.
That being said, APT has reached the Weekly RSI of 35.66 for the first time since mid-2024 (green):
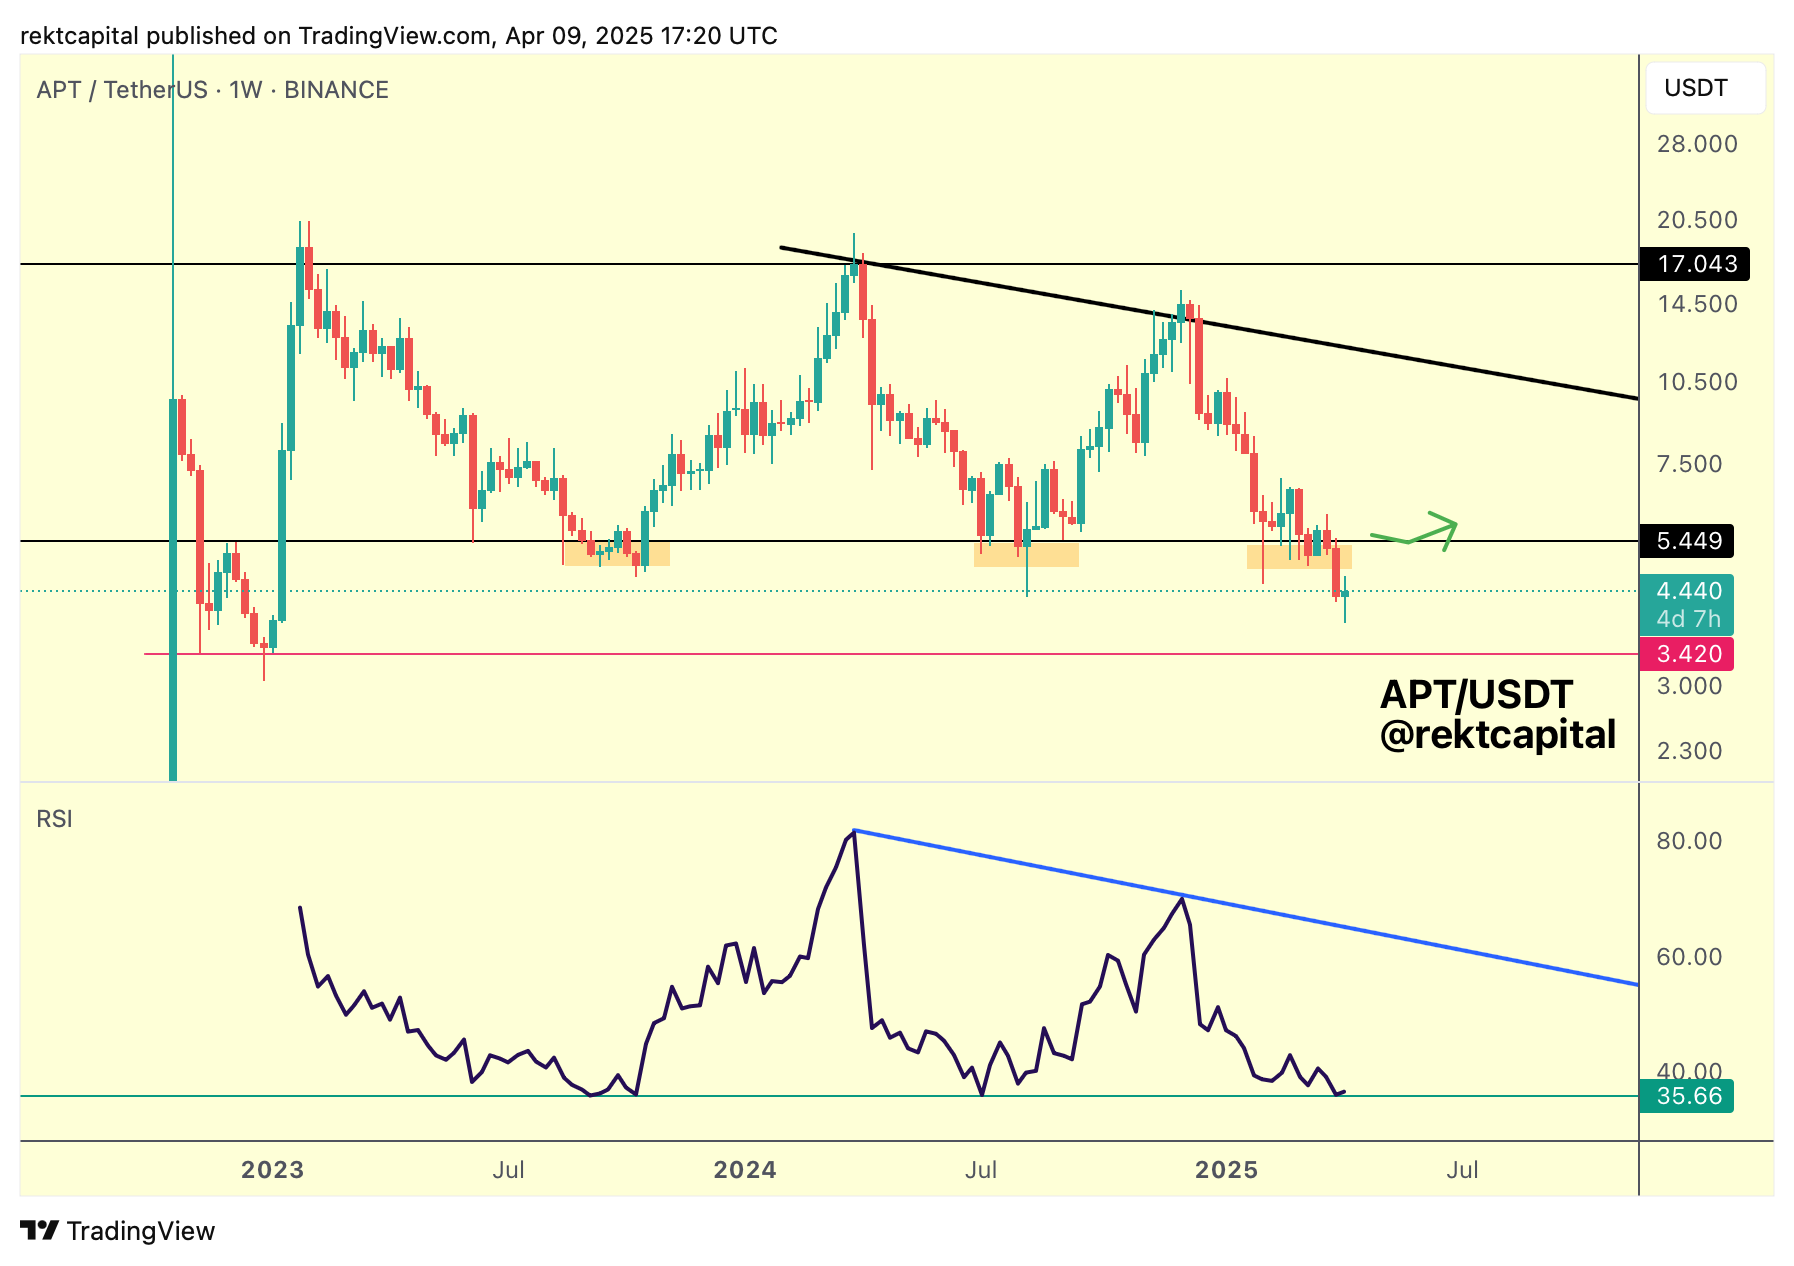
Historically, this RSI level has supported a trend reversal in price over time; the RSI reaching this level still saw price drop lower but touching this RSI has meant that a bottoming formation was not far away from formulating overall.
For example, in late 2023 the RSI double bottomed while price formed a Lower Low (i.e. Bullish Divergence).
In mid-2024, the RSI formed Higher Lows against this RSI=35.66 level (green) whereas price developed Lower Lows and then Higher Lows later on (i.e. Bullish Divergence).
Can APT form another Bull Div around these levels once again?
At the moment, both price and the RSI are forming Lower Lows (i.e. no divergence, in fact convergence as both are doing the same thing).
However, if history is any indication, this RSI touch of the 35.66 level may be the very beginnings of a bottoming out formation.
It's key to emphasise that APT's price can still dwindle during this time; after all, on all previous occasions price action formed Lower Lows while the RSI double bottomed or formed Higher Lows.
But if APT can at least slowly start to dwindle into Lower Lows but within the emerging context of a bottoming out RSI or an RSI that is forming Higher Lows, then the general bottoming out formation should not be too far away.
Fartcoin - FARTCOIN/USDT
In mid-March, we spoke about how FARTCOIN was on the cusp of breaking out from an old ReAccumulation Range:
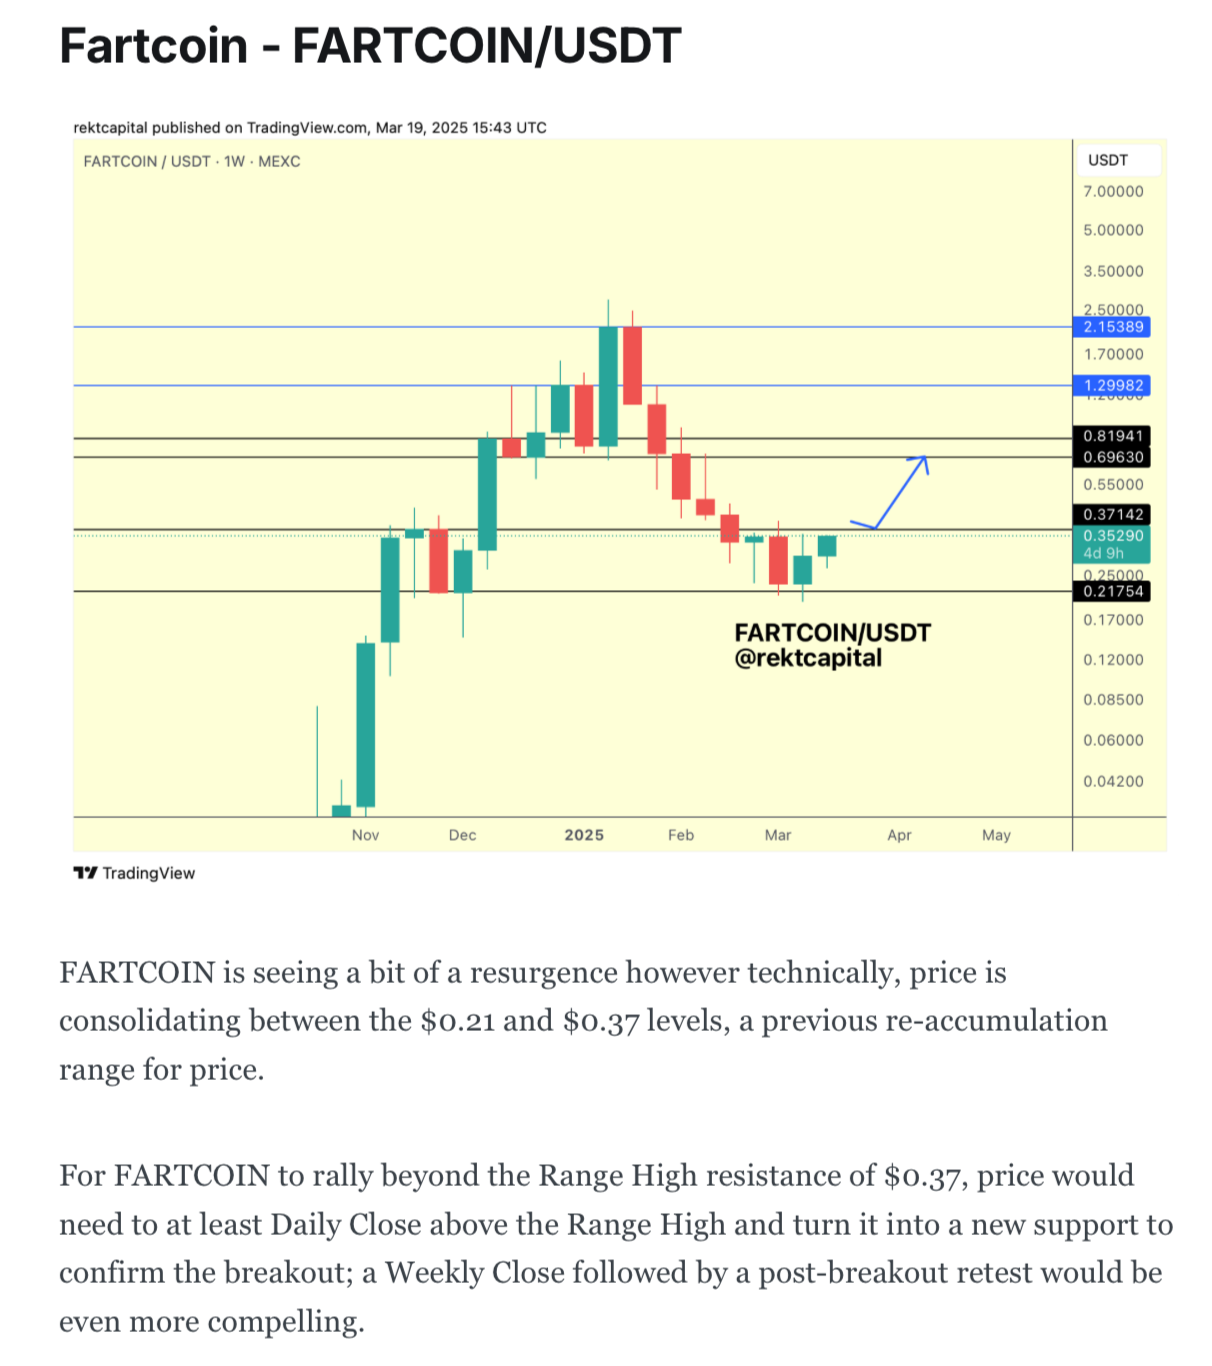
And since then, FARTCOIN indeed broke out from the Re-Accumulation range.
In doing so, price post-breakout retested the top of that Range and even developed a Bull Flagging structure on top of said Range:
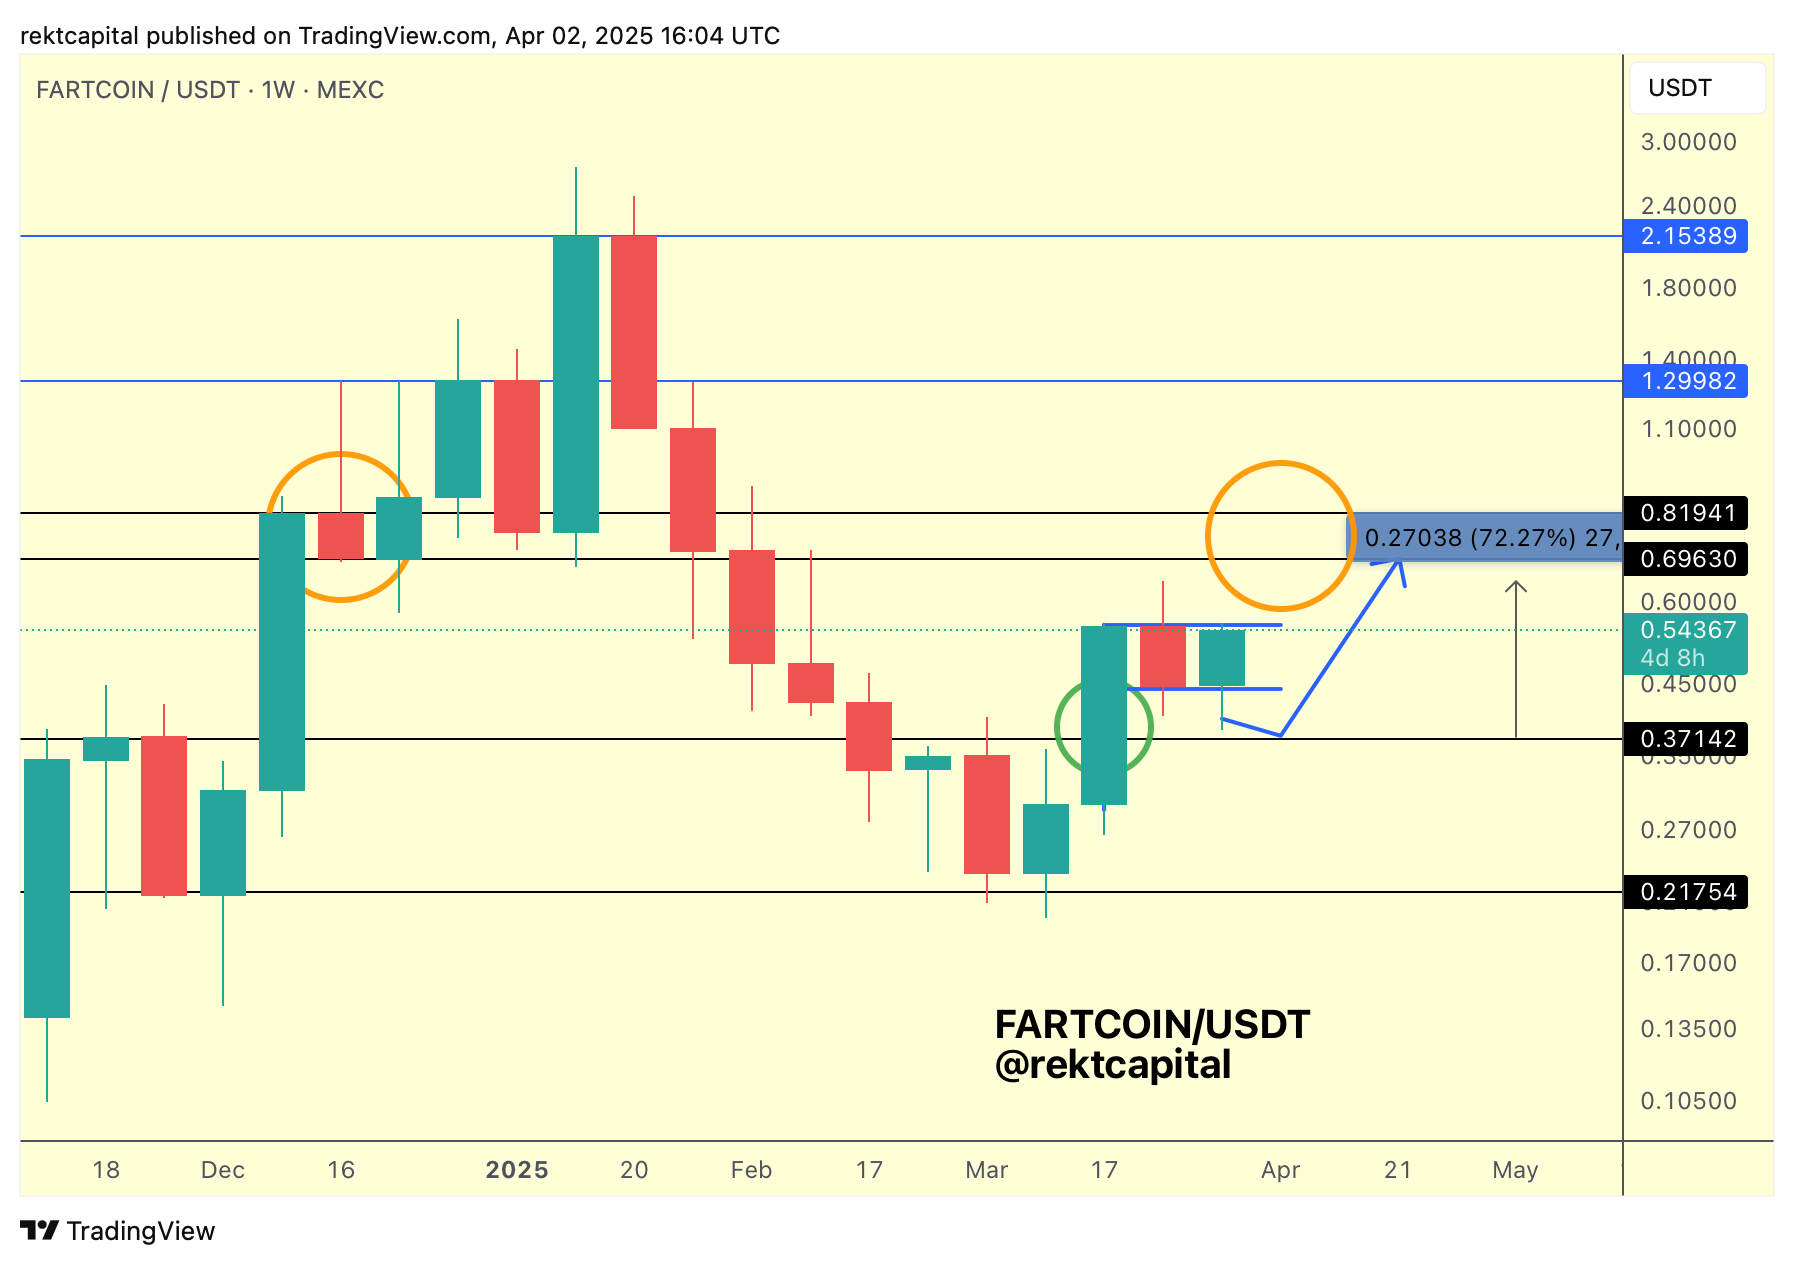
And this is the pattern that FARTCOIN has broken out from most recently:
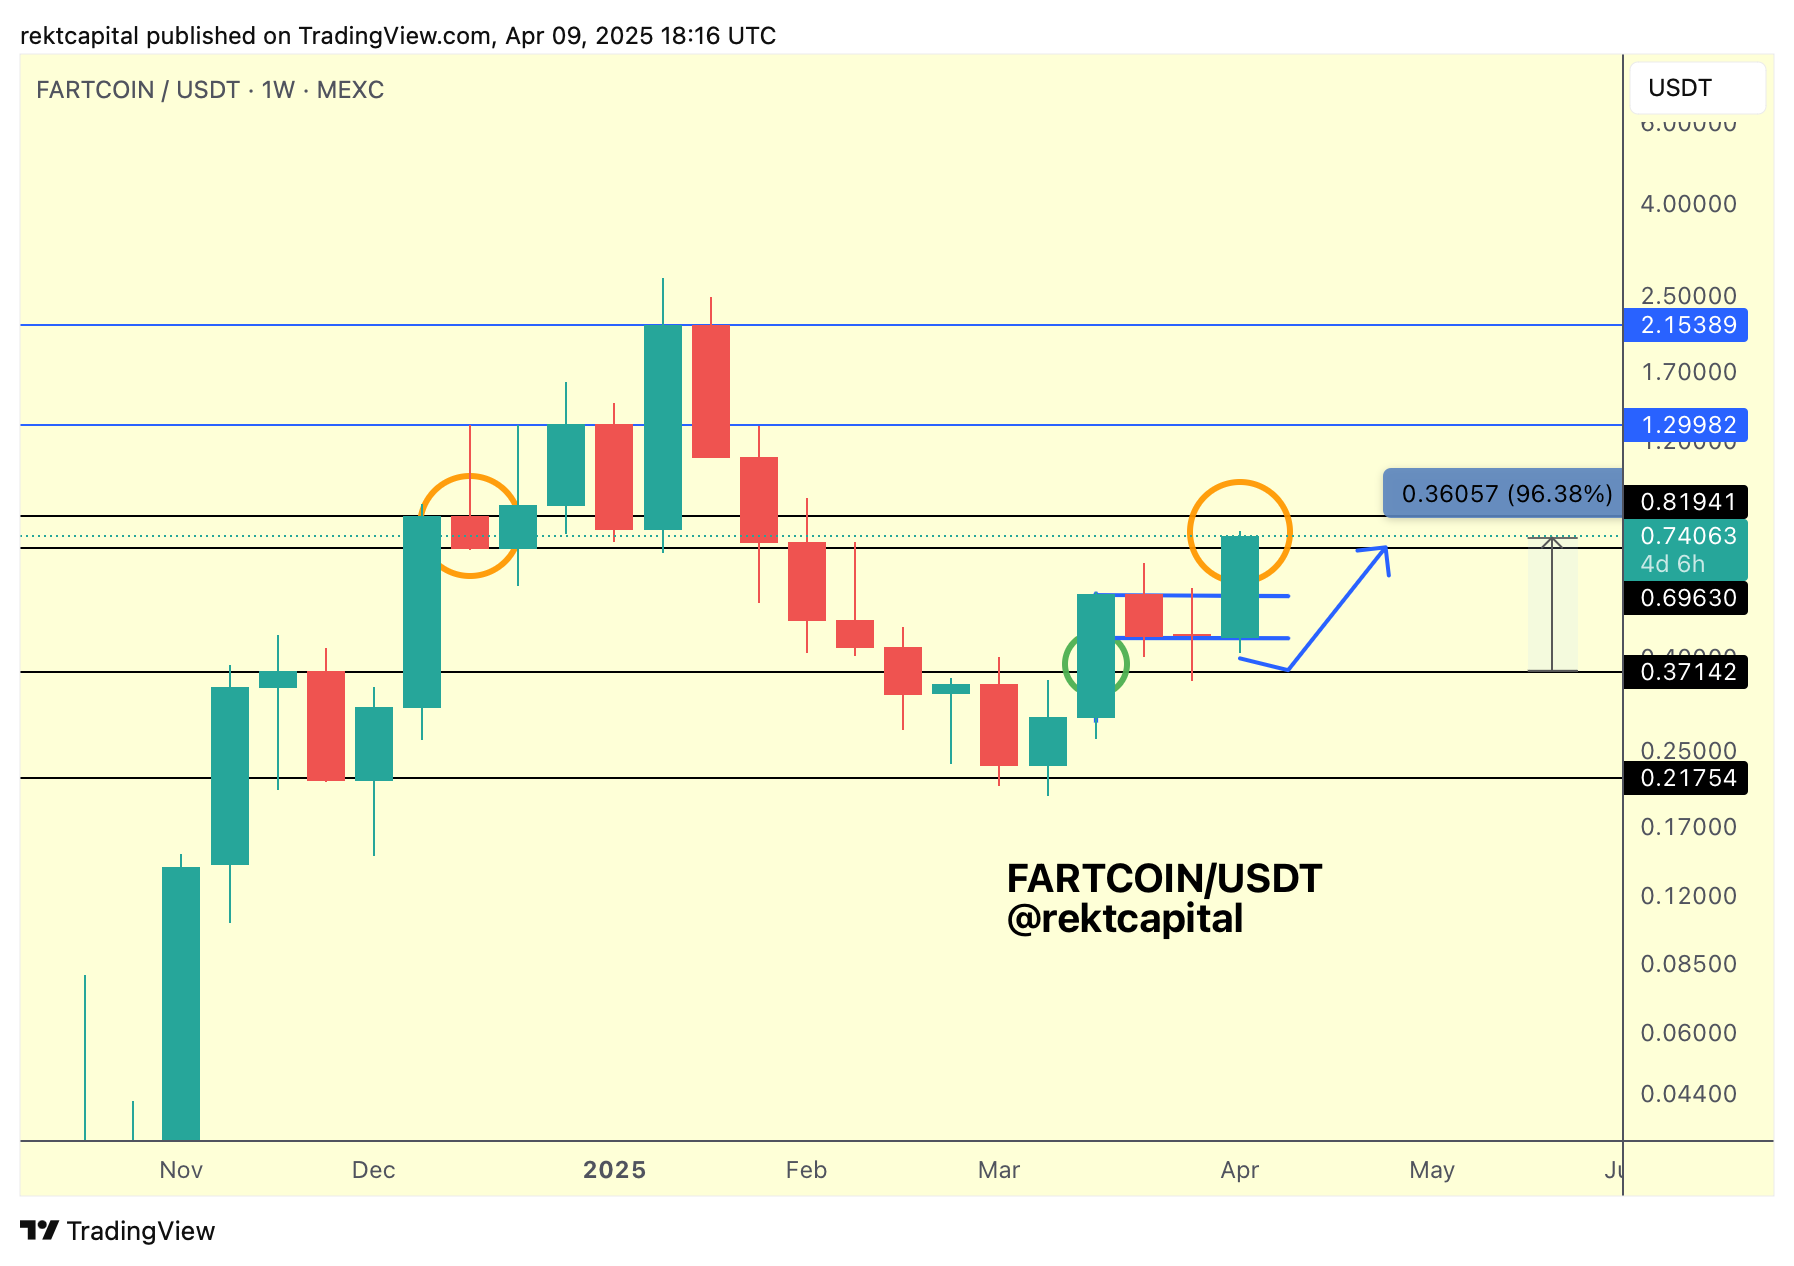
FARTCOIN has completely followed through on the blue path move to the orange circled resistance area, rallying +96% in the process:
Going forward, FARTCOIN would need to Weekly Close inside this orange circled area if price is to try to repeat the re-accumulation of late 2024.
But failure to Weekly Close inside the orange circled area and FARTCOIN could drop back into the Bull Flag top for a post-breakout retest.