Altcoin Market Update
Features analysis on Altcoins such as DOGE SOL ALGO APT CPOOL GALA JUP ONDO
Hello and welcome back to the Rekt Capital Newsletter.
In today’s edition, the following cryptocurrencies will be analysed & discussed:
- Dogecoin (DOGE), Solana (SOL) and Algorand (ALGO
- Aptos (APT)
- Clearpool (CPOOL)
- Gala Games (GALA)
- Jupiter (JUP)
- Ondo (ONDO)
But before we dive in, this Friday I’ll chart your Altcoin picks in an exclusive subscriber-only TA newsletter and will cover as many as I can
So if you’d like to have an Altcoin charted, feel free to share max. two TA requests each in the comments below.
I’ll chart the Altcoins that get mentioned and ‘Liked’ the most
Click the button below to leave a comment with your TA request!
Let's dive in to today's Altcoin Market Update.
Solana - SOL/USD
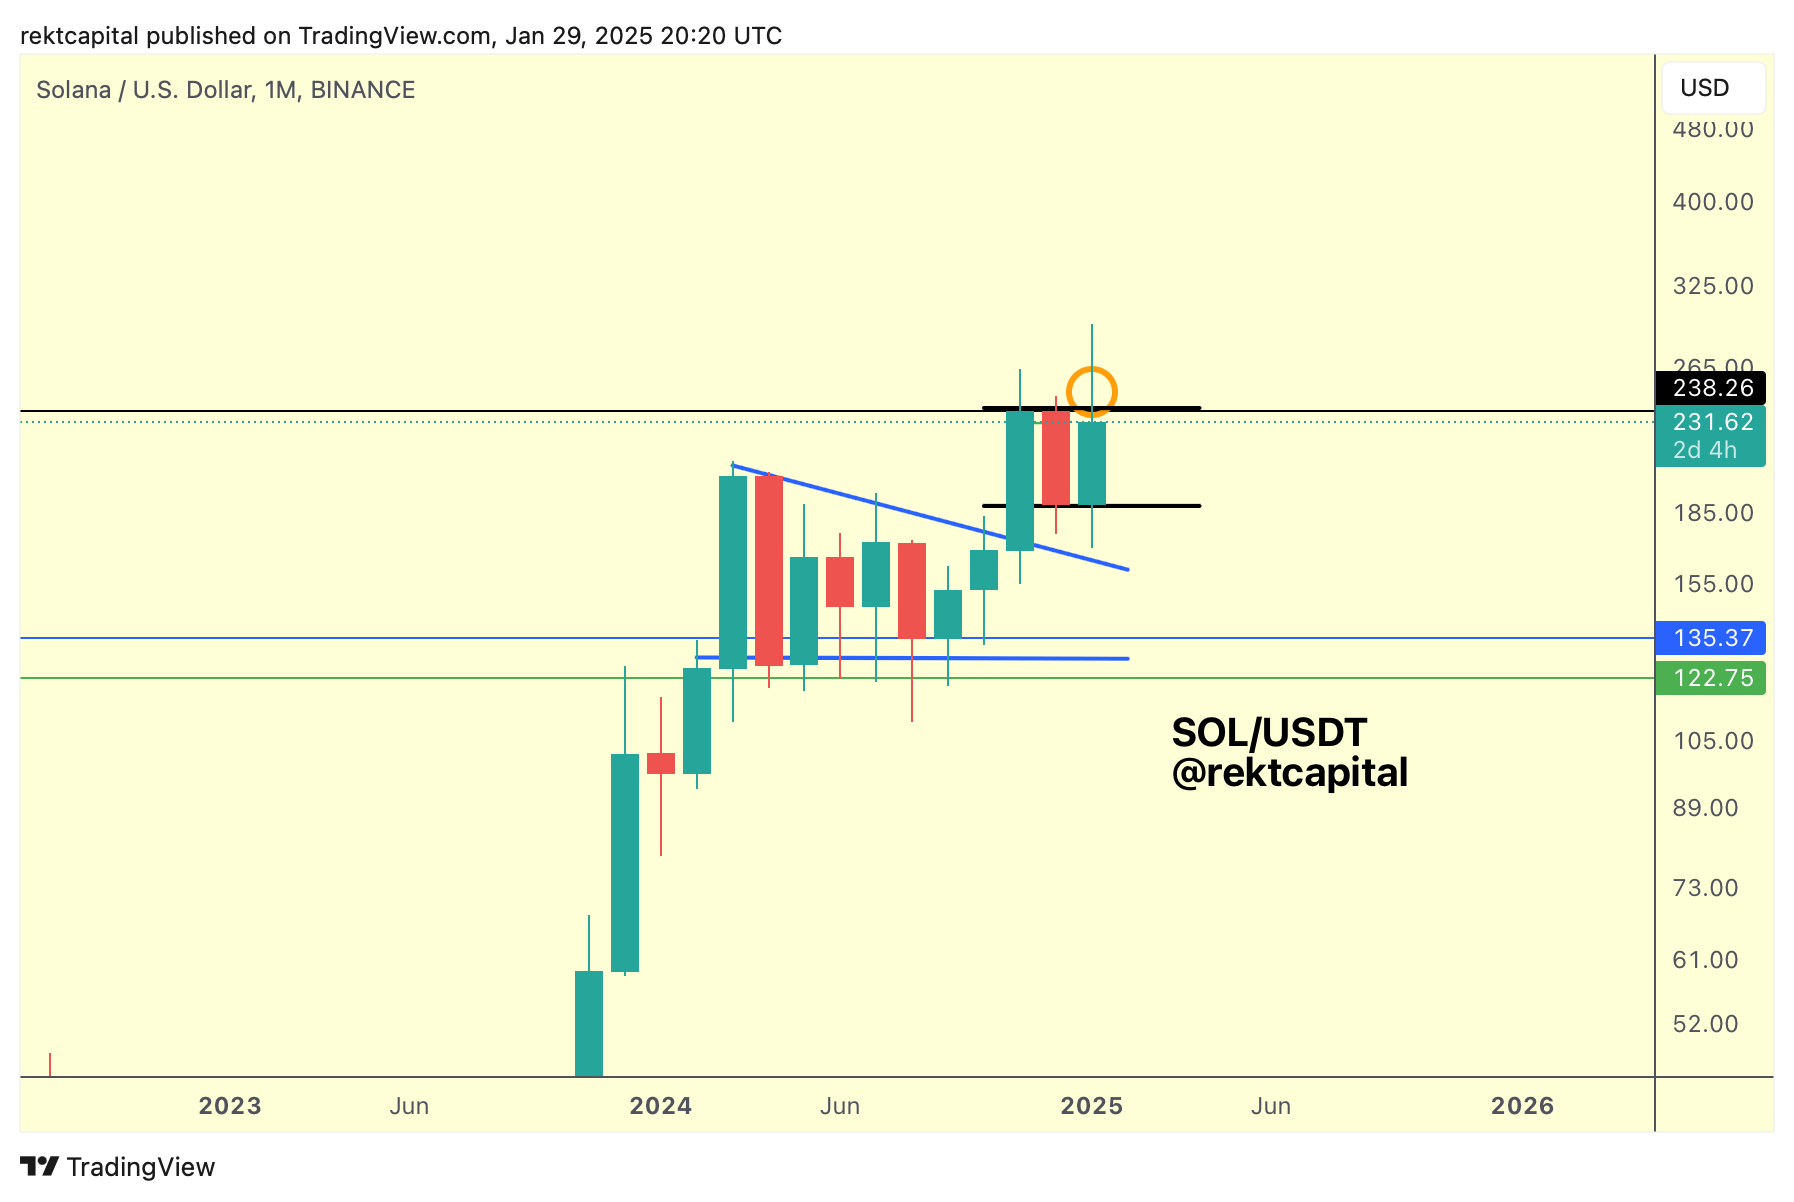
Ever since breaking out from its triangular Re-Accumulation structure (blue), Solana has transitioned into a Monthly Bull Flagging pattern (black).
SOL is just beneath the Bull Flag top resistance which is a confluent resistance with the final Monthly resistance of $238 before new All Time Highs and Price Discovery.
Dogecoin is also mimicking Solana with a Monthly Bull Flag:
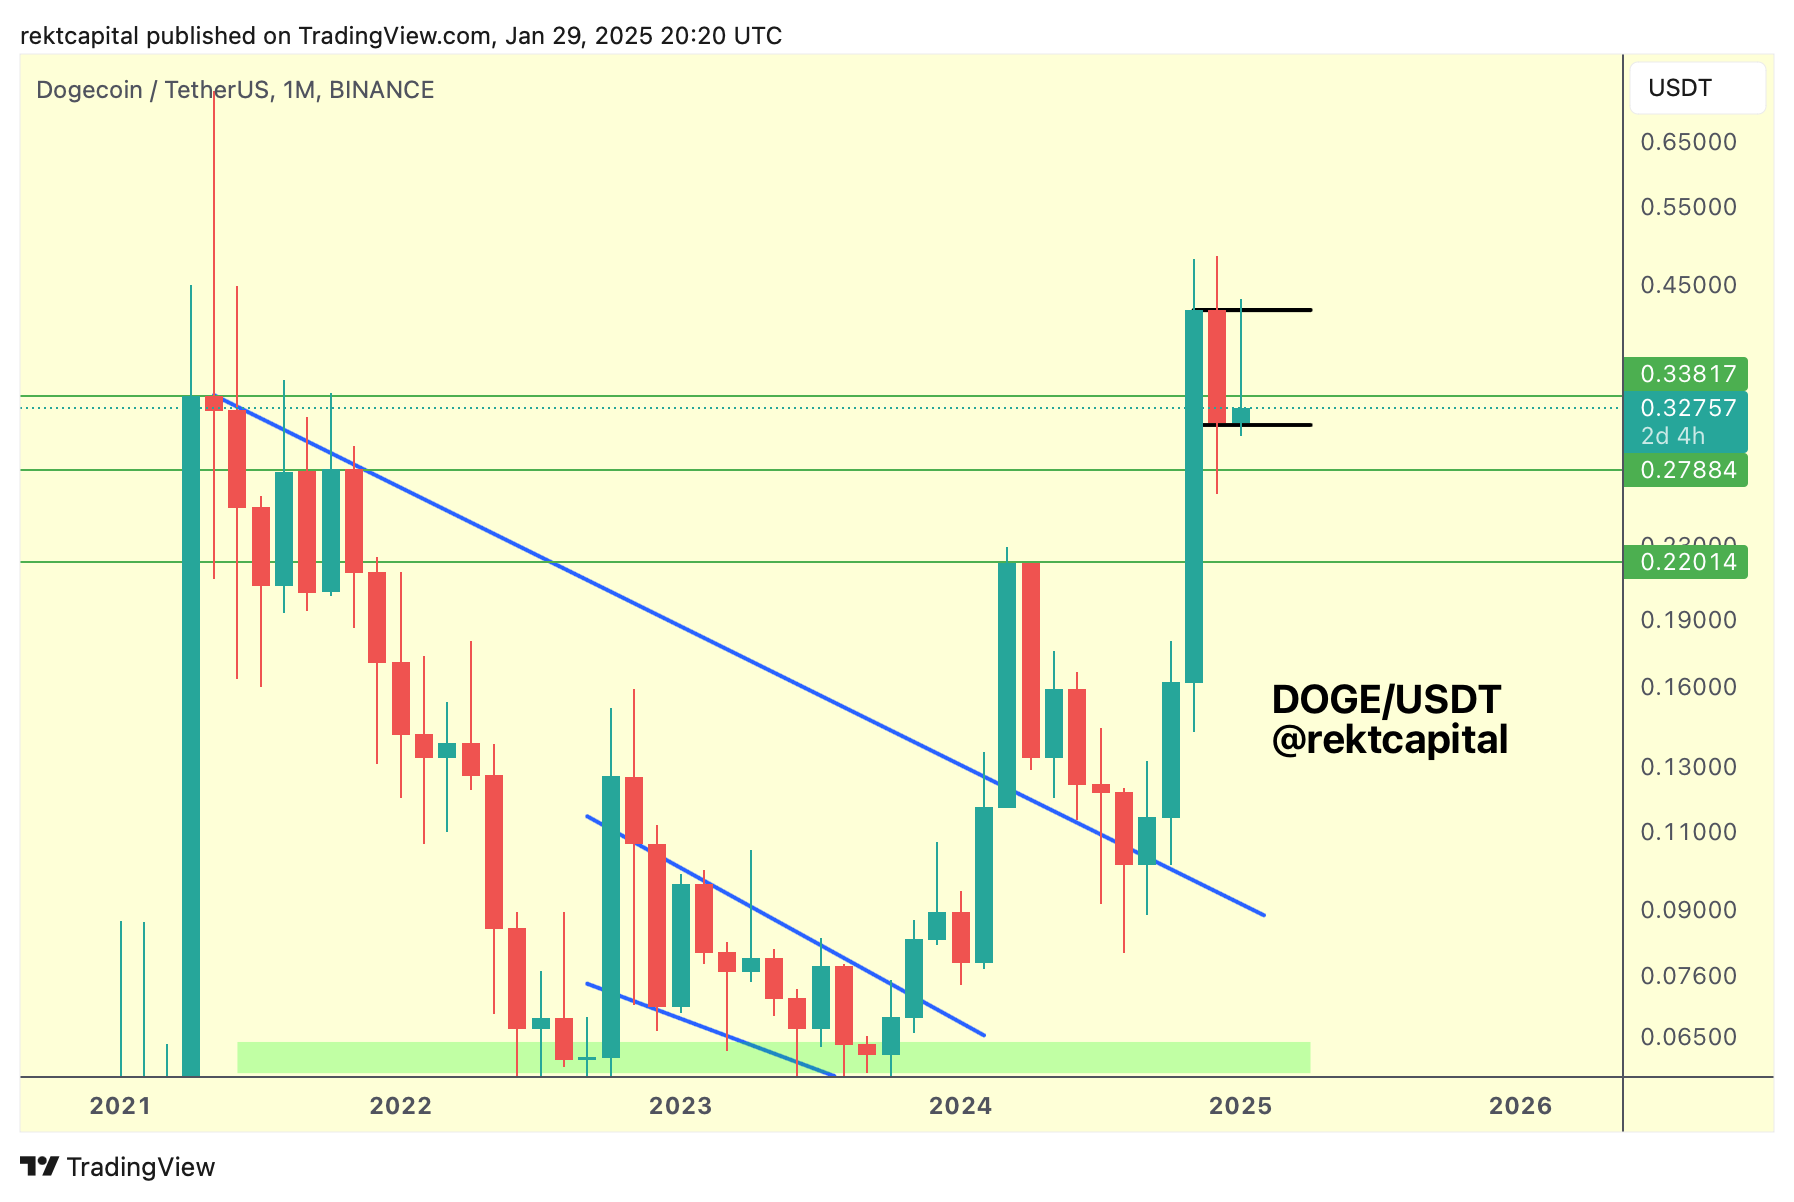
Granted, DOGE is lagging behind SOL within its respective Bull Flag.
SOL is just below its Bull Flag whereas DOGE is hovering just above its respective Bull Flag bottom.
So both coins are in similar structures, but in varying phases of the intra-pattern movements.
Algorand is also forming a Bull Flag:

And at this time, ALGO is a little further along that DOGE, but lagging behind SOL when it comes to a cross-comparison of all three of these patterns.
Nonetheless, all three are building continuation structures and Monthly Closes above the Bull Flag tops would bring all one step closer to breakouts.
Aptos - APT/USDT
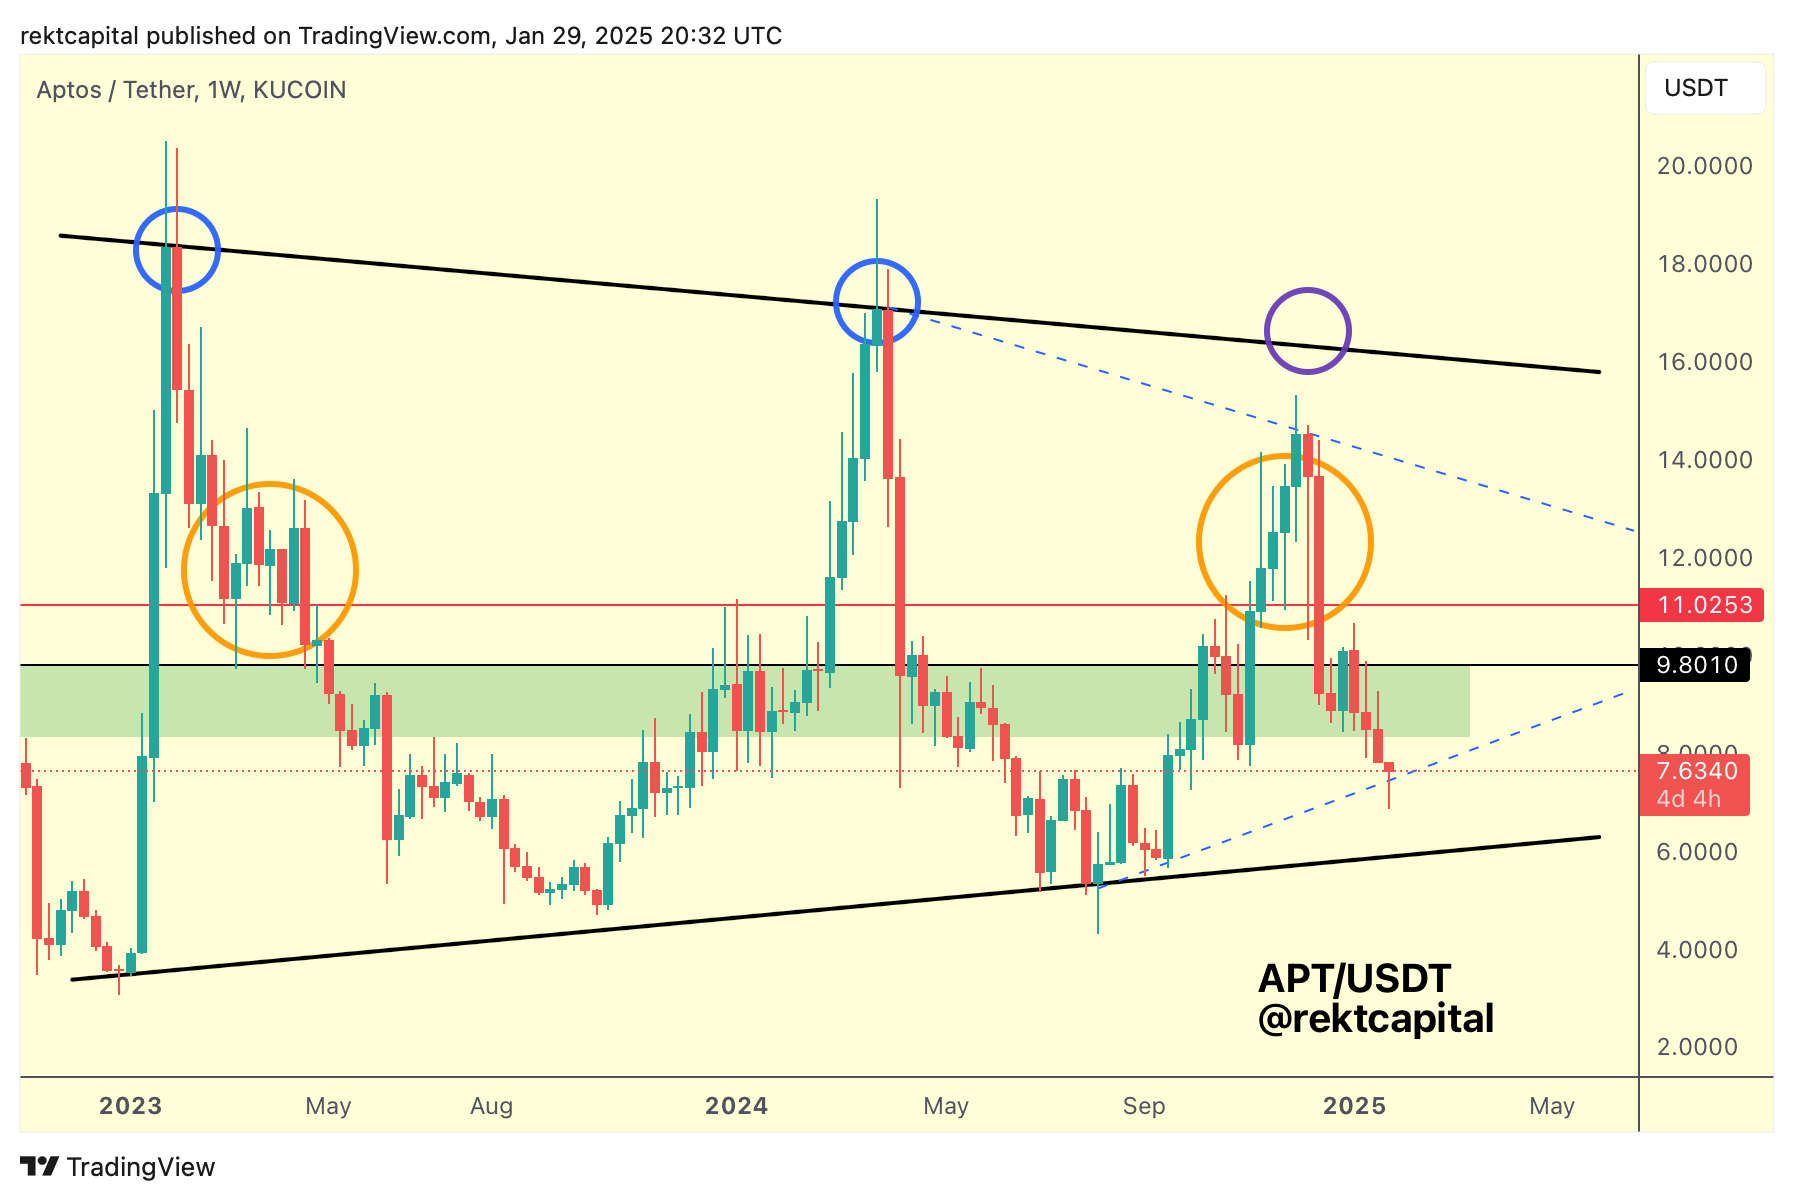
Aptos is located within a very clear Macro Wedging Structure (black).
Over time, APT consolidates from the bottom of the pattern to the top before dropping to the bottom of the structure before reversing to the top of it.
Worse-case scenario going forward, APT lapses this local blue dashed Higher Low trendline and price revisits the bottom of the macro pattern once again.
However, this blue trendline is worth spotlighting right now, given how APT local topped at a Lower High (blue dashed trendline).
If a Lower High rejected price before, then could a new Higher Low act as support?
For it to figure as support, APT will need to continue Weekly Close above the blue dashed Higher Low.
However, if the HL holds and price even rebounds straight into the green area above but that green area acts as resistance, then the blue HL may not withstand another retest due to a layering of sell-side orders at the green region.
Let's see how the blue trendline acts and if there's a rebound, the reaction from the green area will be important to watch for as well.