Altcoin Market Update
Features analysis on Altcoins such as VANRY INJ FET EDU OP TIA
Hello and welcome back to the Rekt Capital Newsletter.
In today’s edition, the following cryptocurrencies will be analysed & discussed:
- Vanar Chain (VANRY)
- Injective (INJ)
- Fetch ai (FET)
- Open Campus (EDU)
- Optimism (OP)
- Celestia (TIA)
Vanar Chain - VANRY/USDT
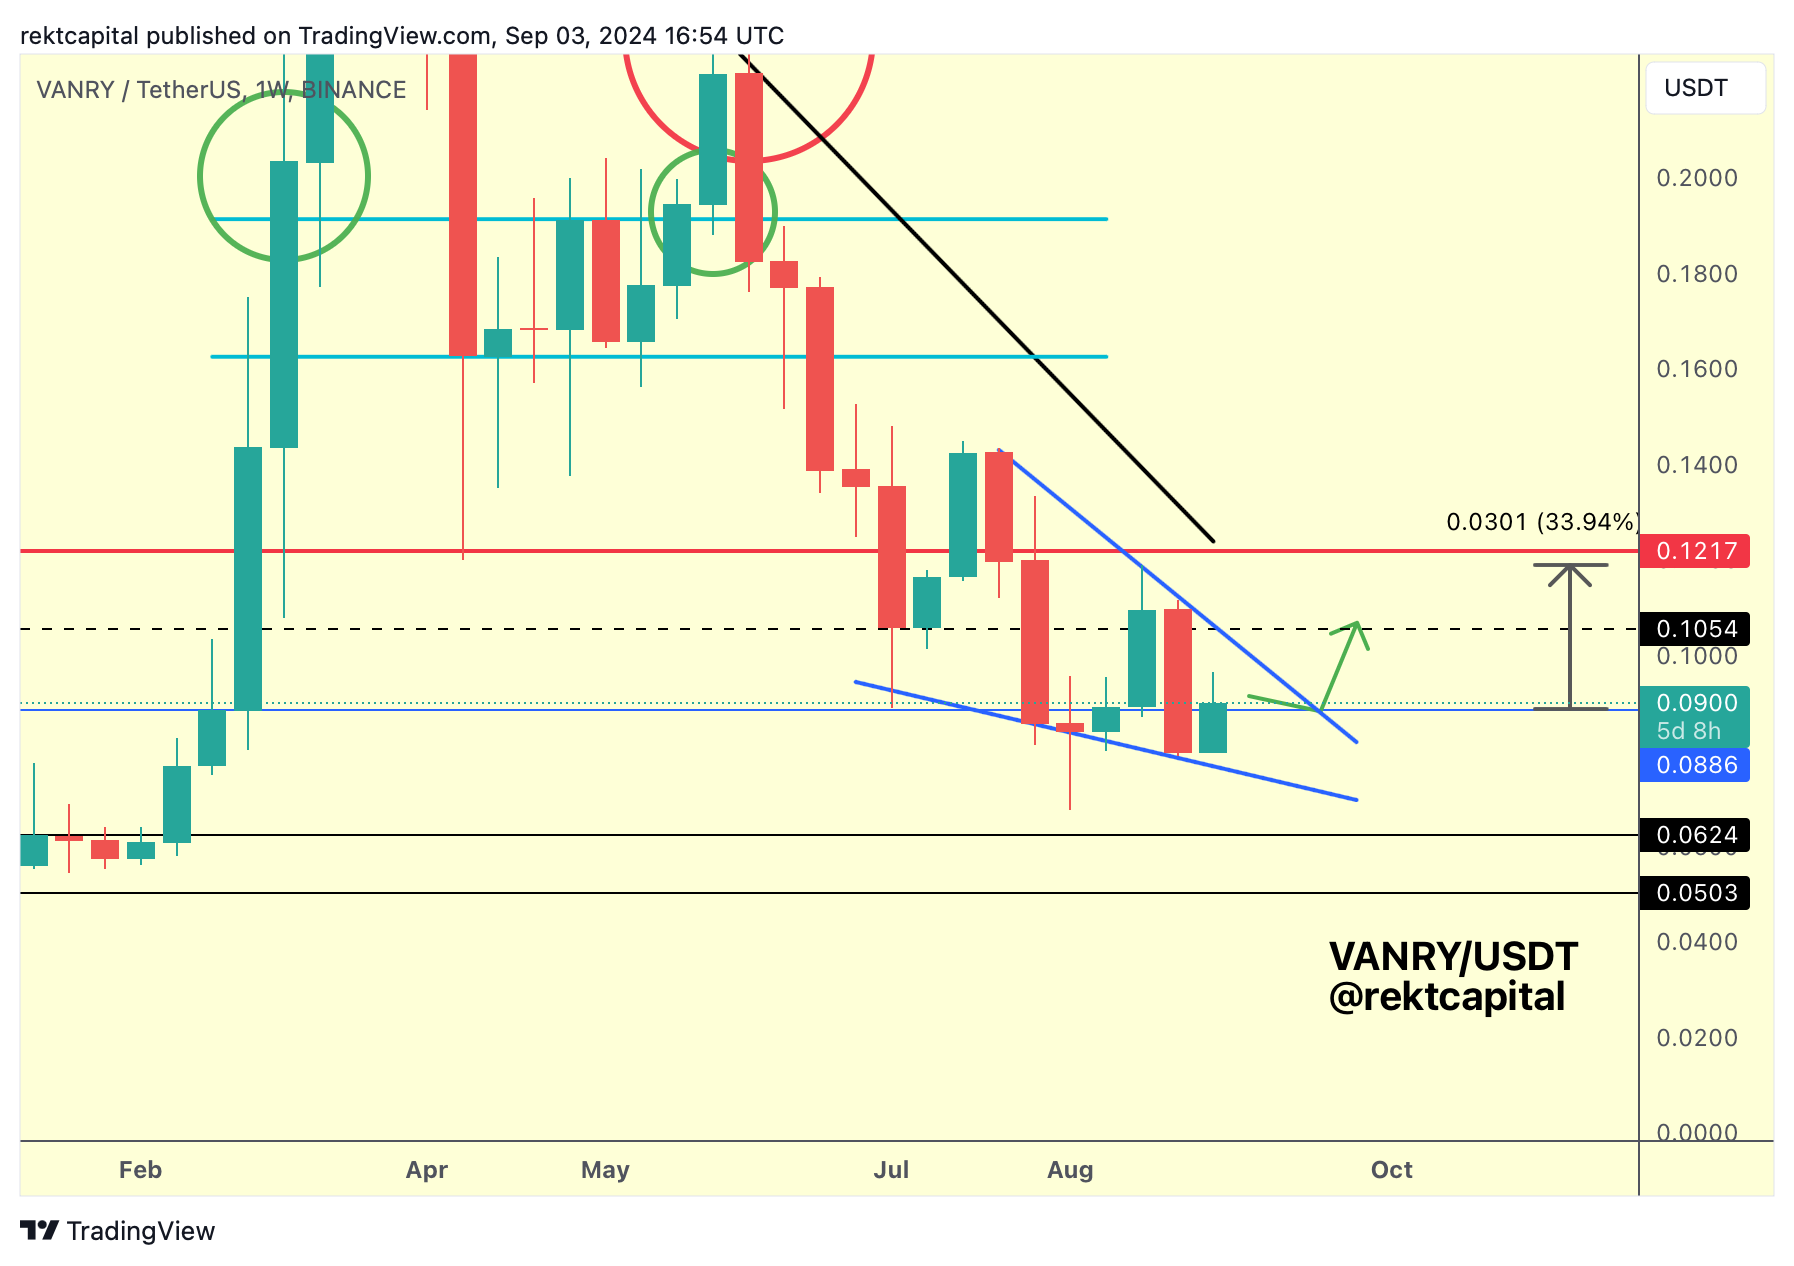
Over the past few weeks, we discussed VANRY and its Falling Wedge-like structure and how it needed to retest the blue level of $0.088 as support to follow through on its green path:
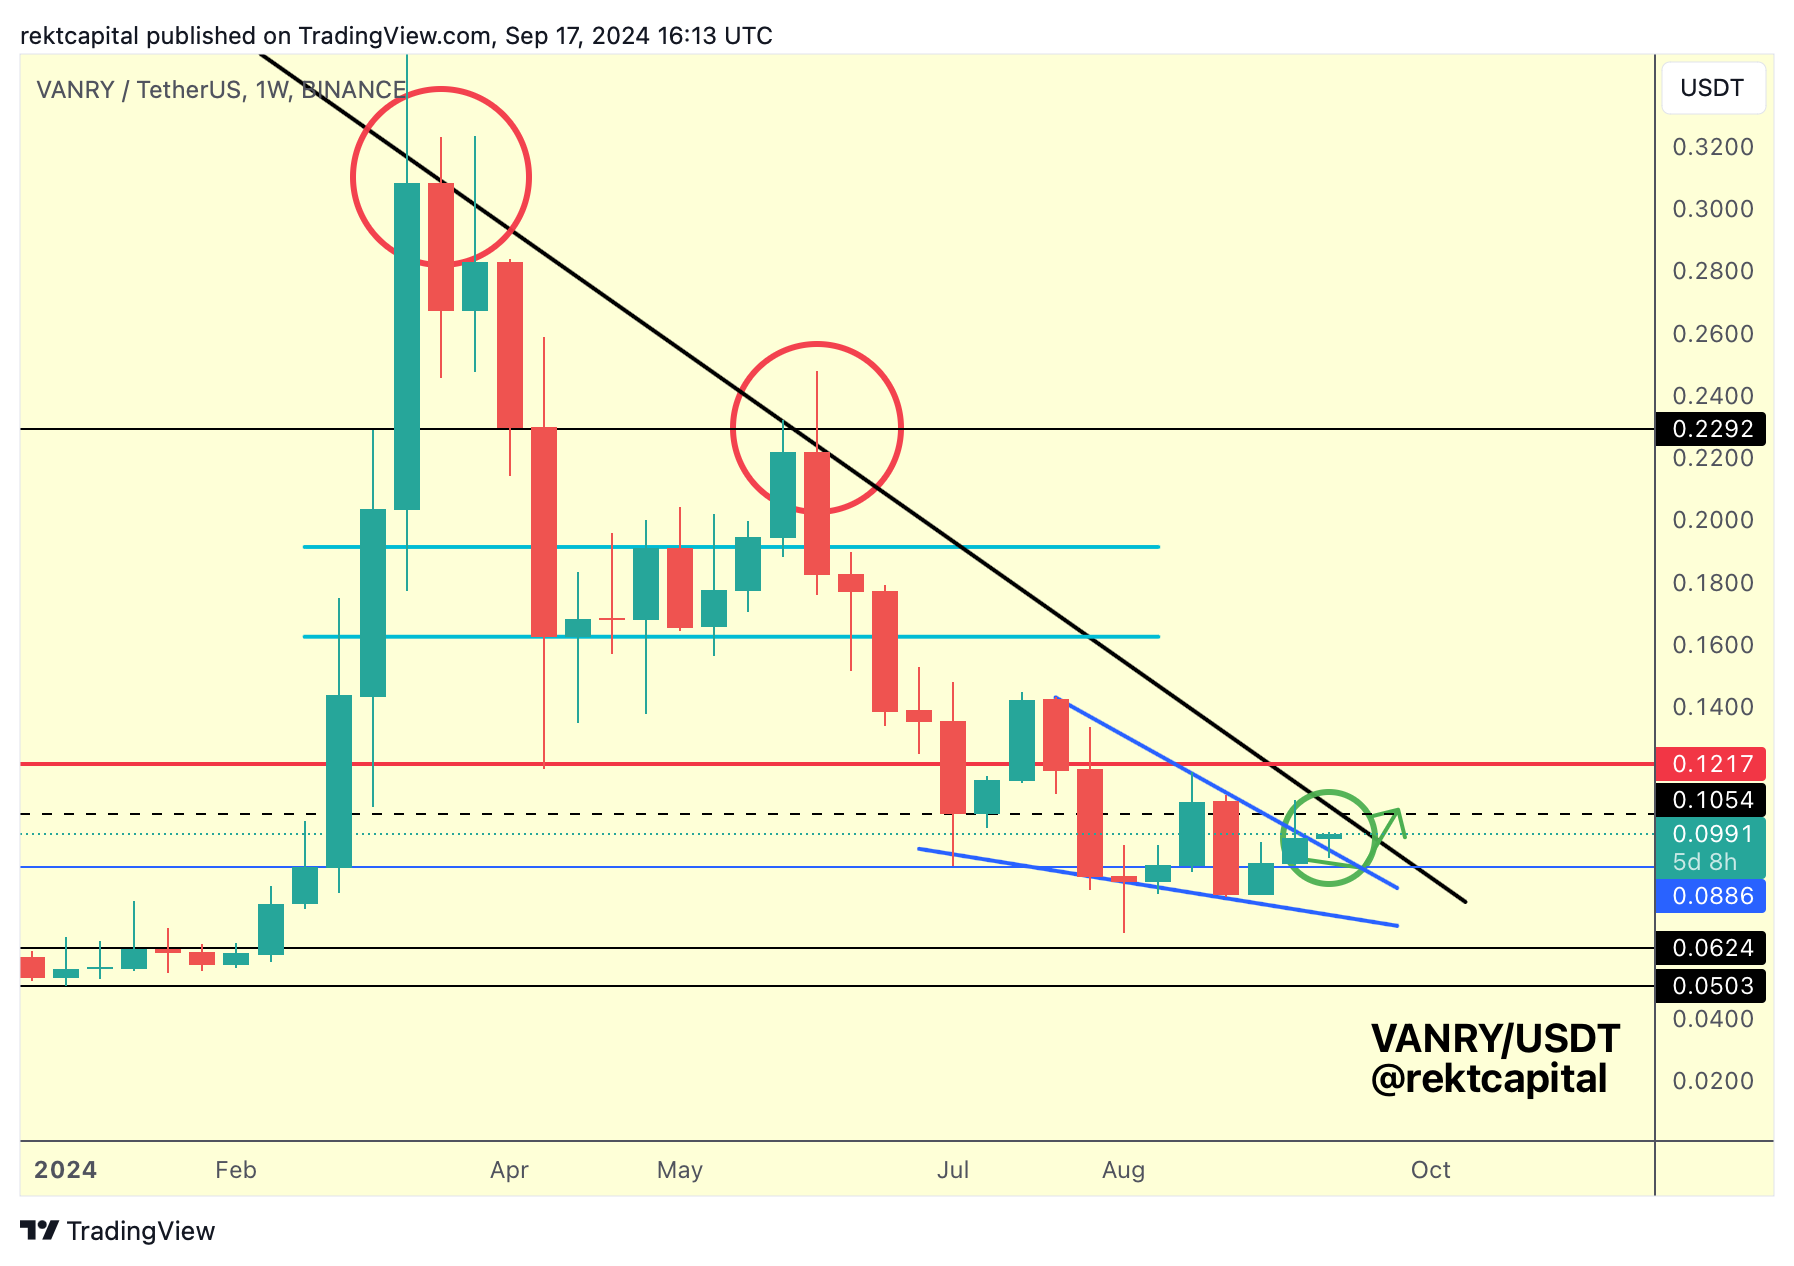
VANRY then Weekly Closed above the top of its blue pattern to retest it as support in an effort to confirm a breakout from it:
And here's today's chart:
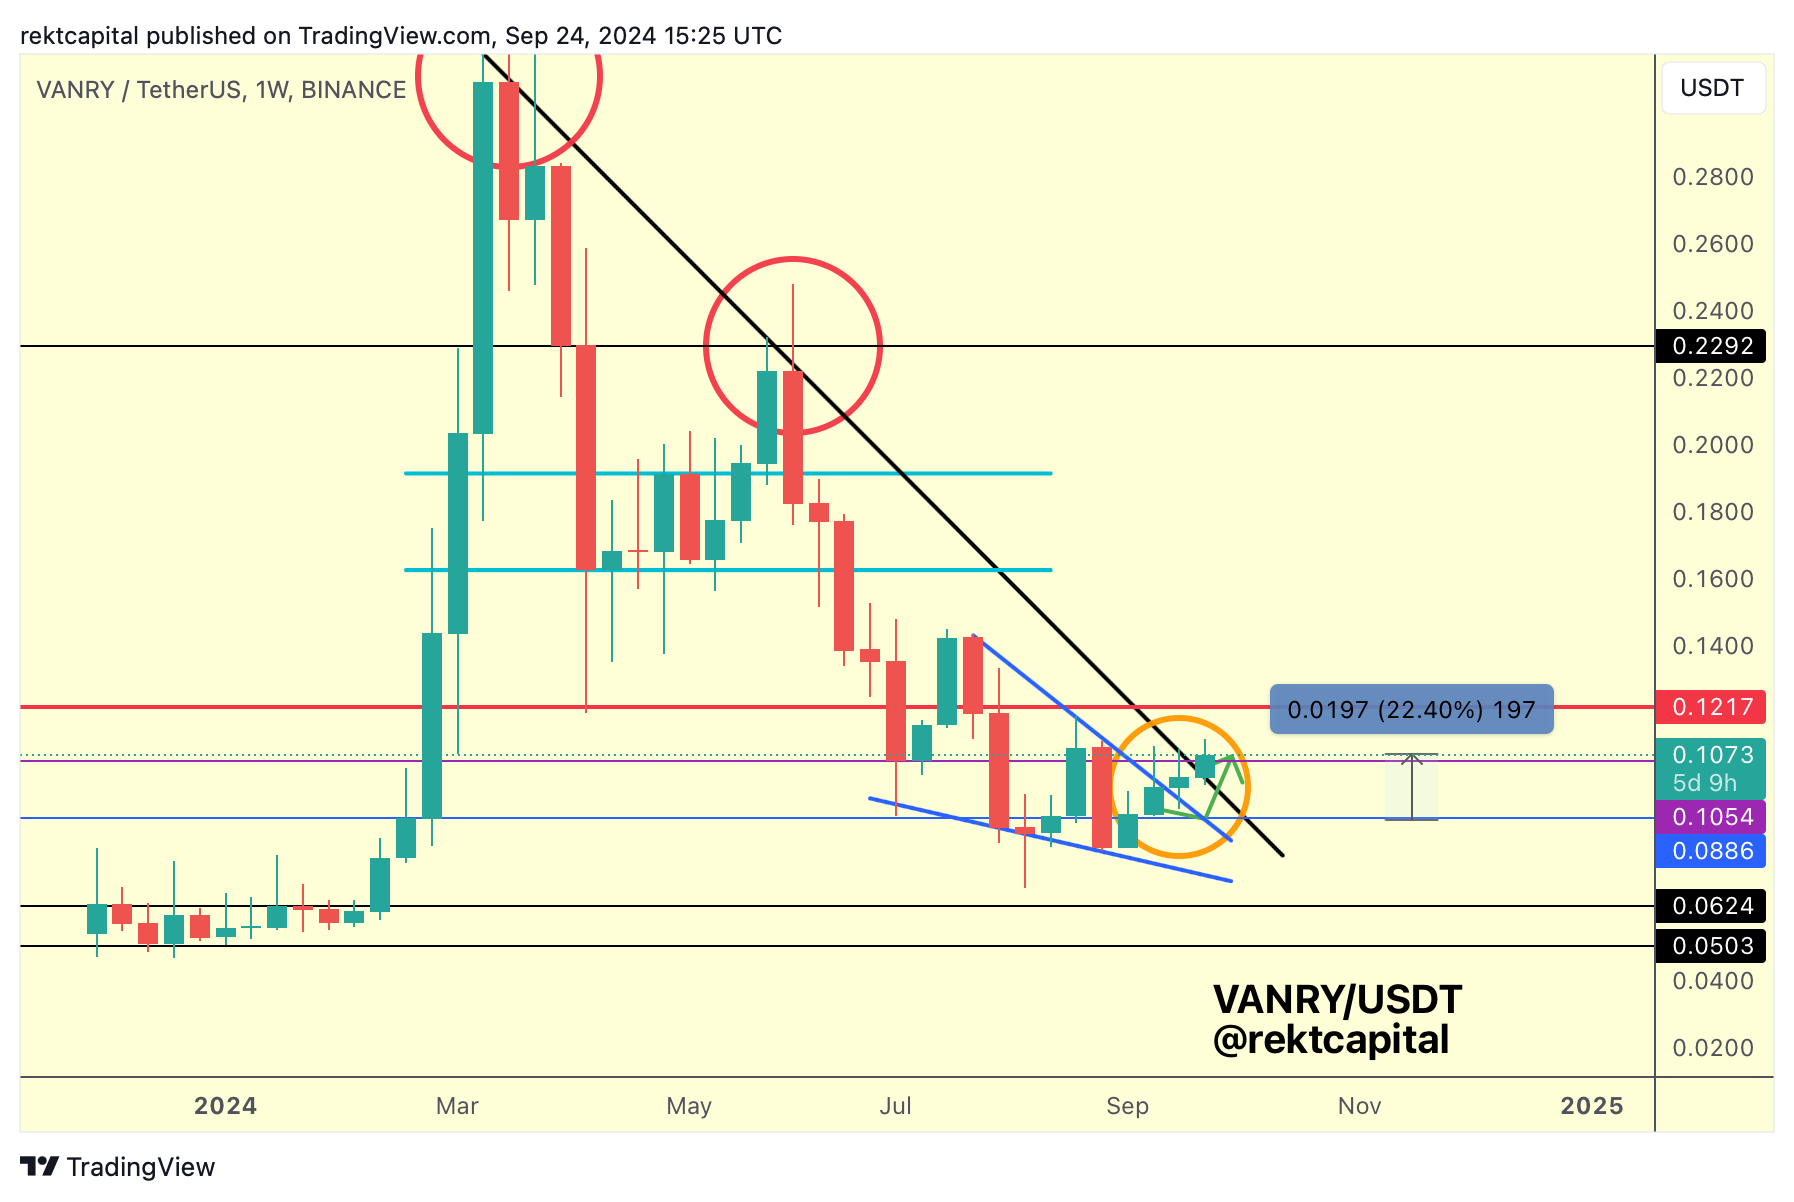
Overall, VANRY followed its green path to completion, allowing for a breakout from the blue downtrending channel.
But perhaps most importantly, this turn of technical events has enabled a challenge of the crucial Macro Downtrend, dating to mid-March 2024.
VANRY is trying to muster its way beyond this Macro Downtrend and a Weekly Close beyond it would be a compelling trigger for price to challenge for a breakout into a new macro uptrend.
VANRY is on the cusp of a new macro uptrend, it just needs to Weekly Close above it to potentially kickstart the process.
Injective - INJ/USDT
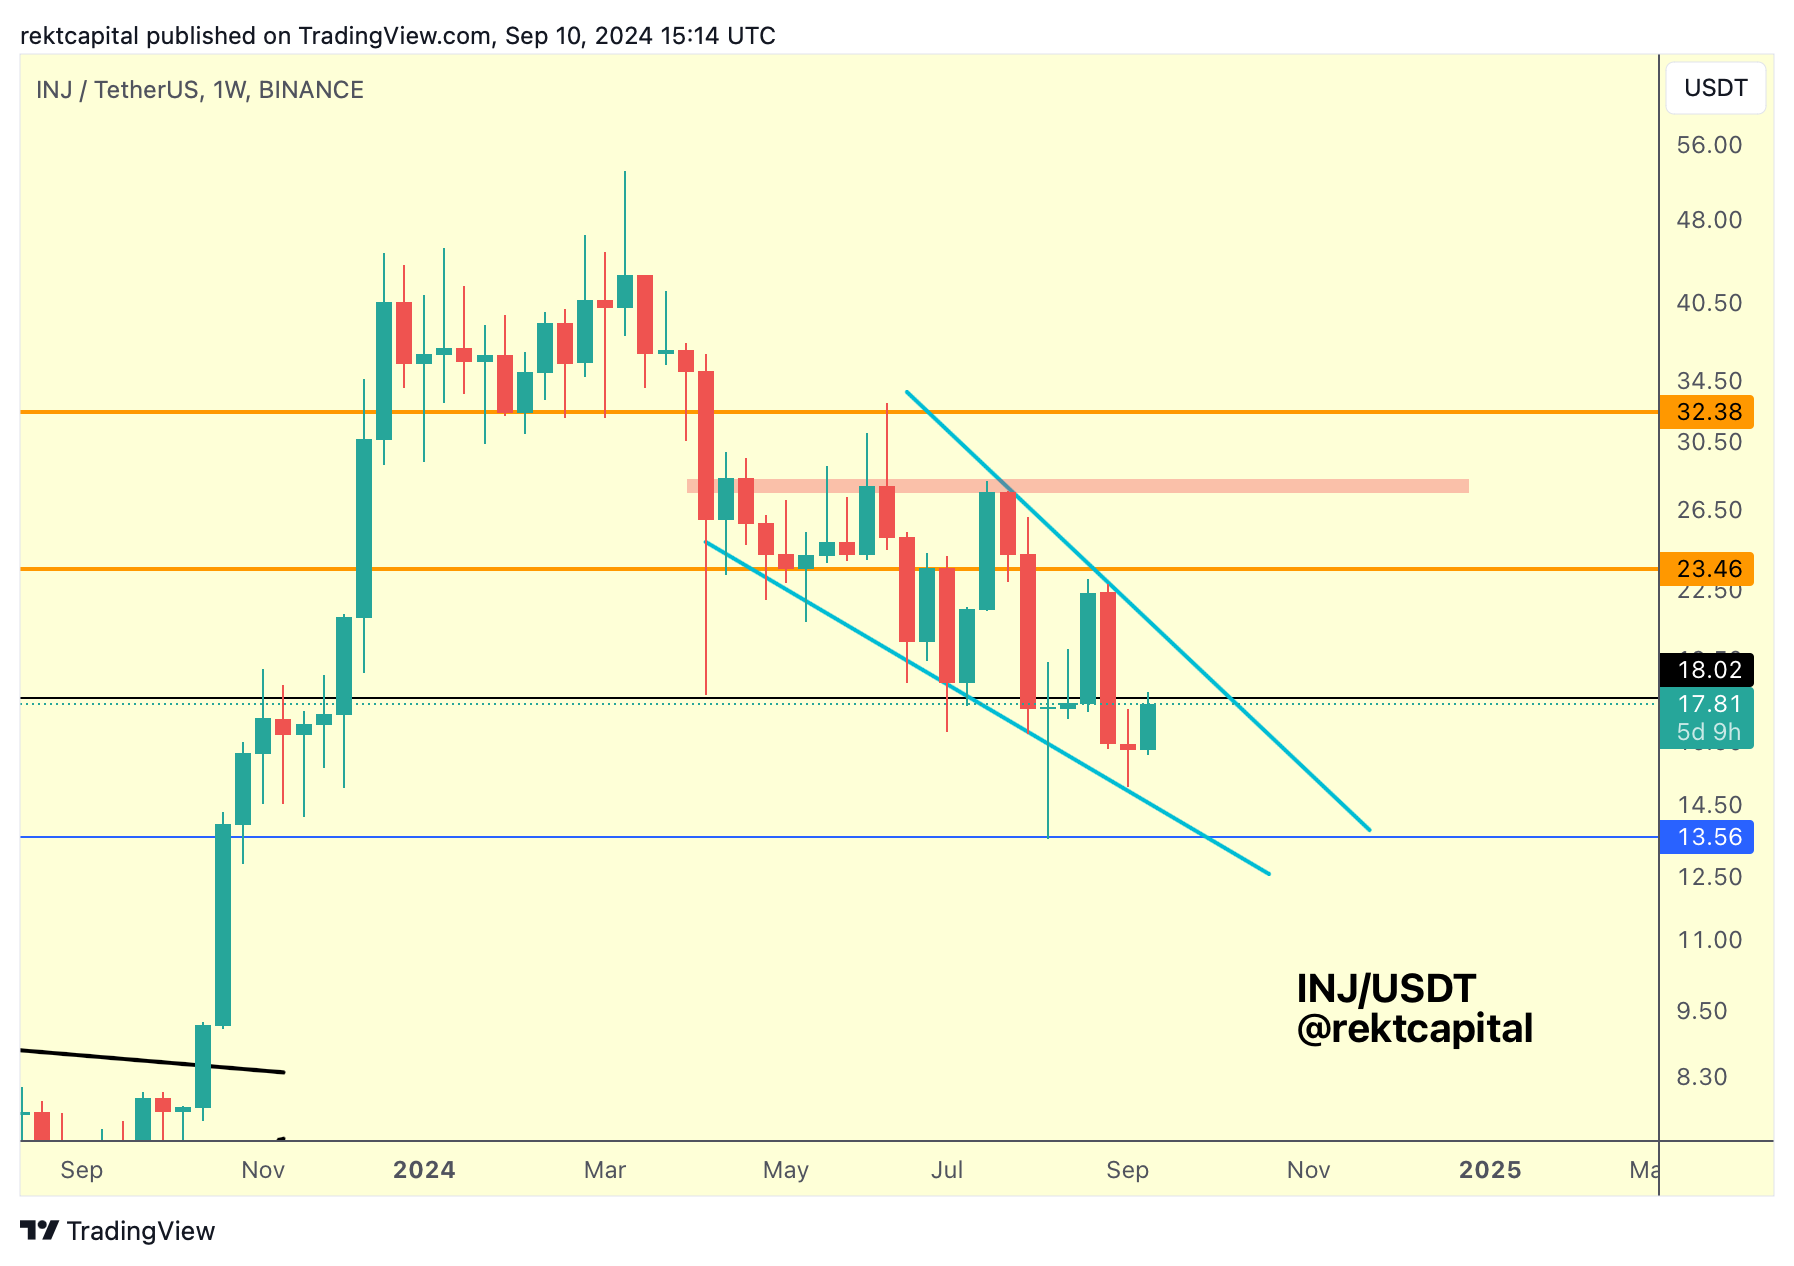
A few weeks back, we spoke about INJ and how it was still consolidating inside its Downtrending Channel (light blue):
Since then, INJ successfully reclaimed the black level of $18.02 to enable a breakout from this Falling Wedge structure:
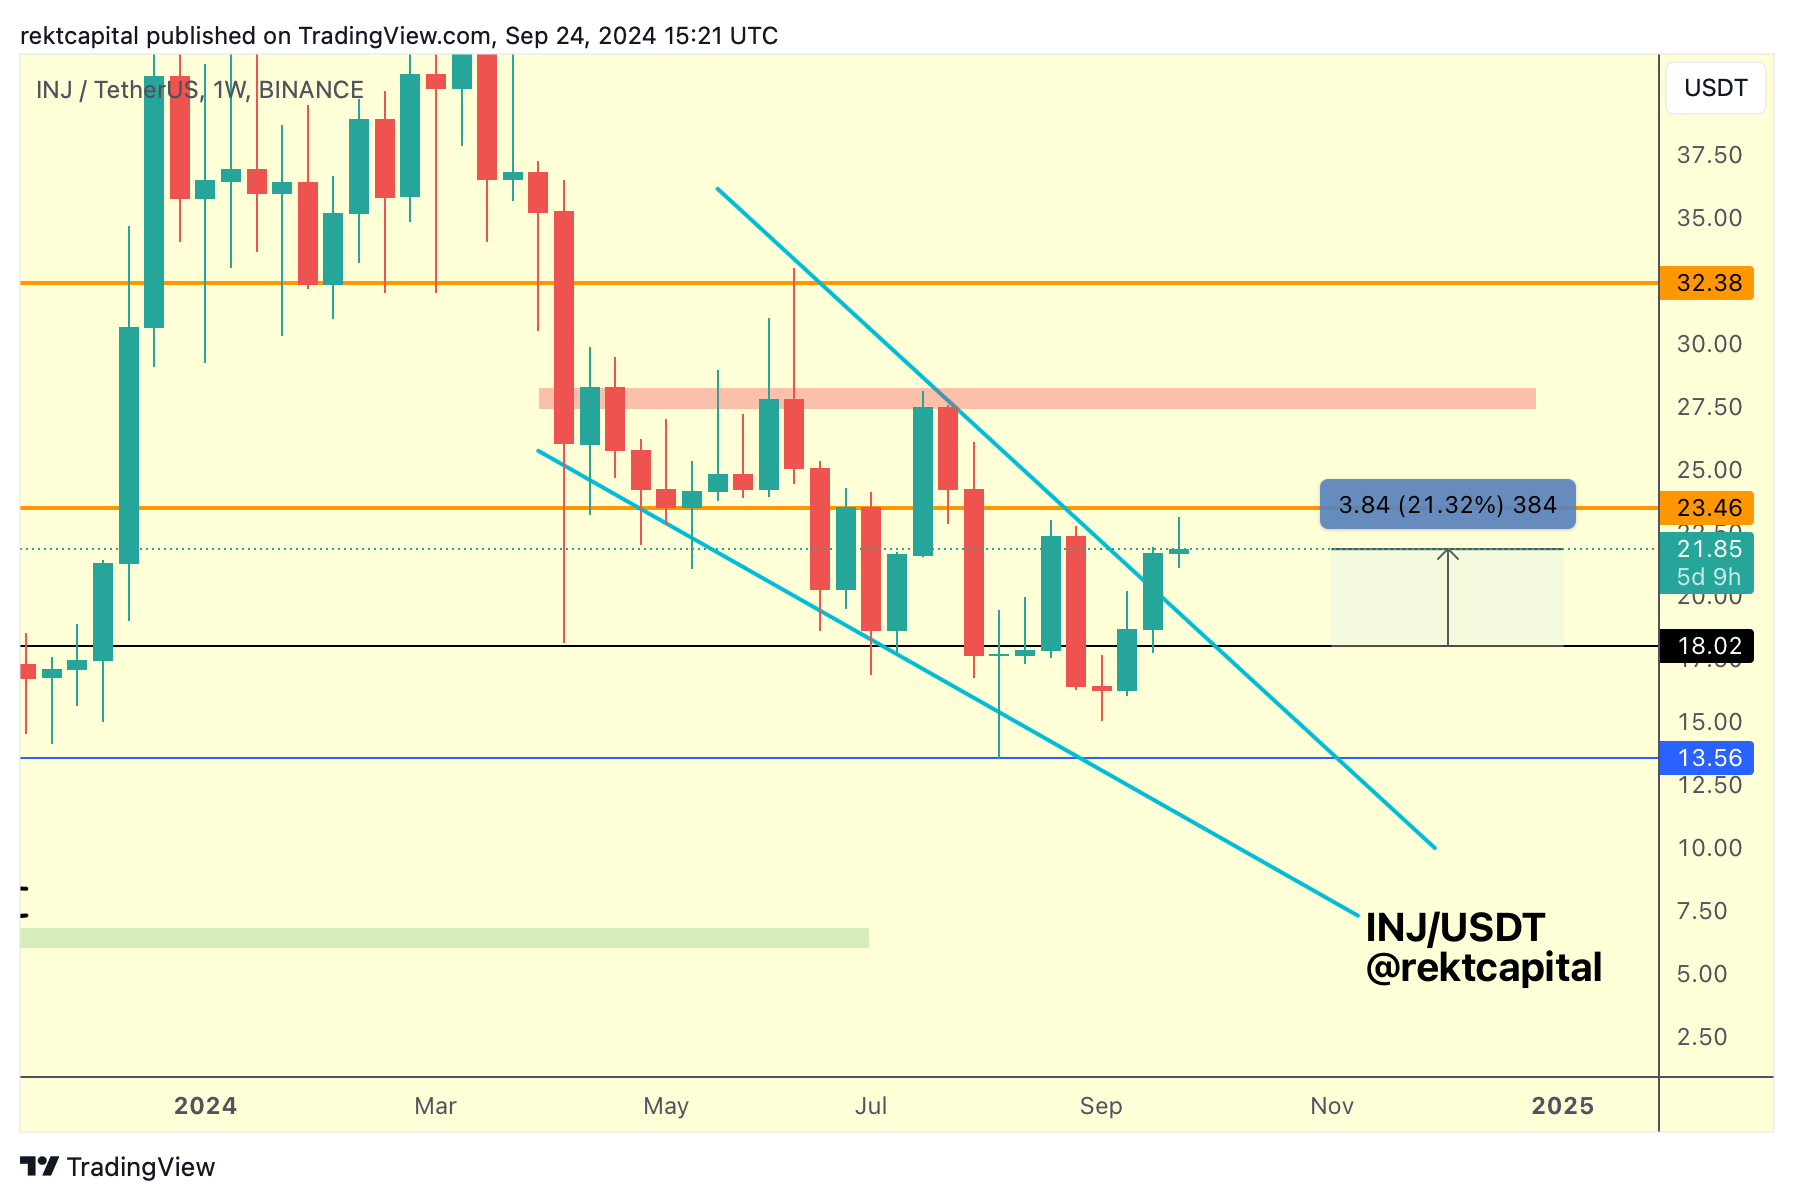
This breakout has resulted in a +21% move to the upside, revising the orange Range High at $23.46.
For INJ to enjoy trend continuation towards the red boxed resistance at around $27.50, it would need to Weekly Close above the orange Range High first.
Until then, INJ will always be potentially positioned for a pullback into the top of the Wedge it had broken out from, if price really needs to go for a post-breakout retest attempt to fully confirm the breakout.
These two blue circles summarise these two key levels:
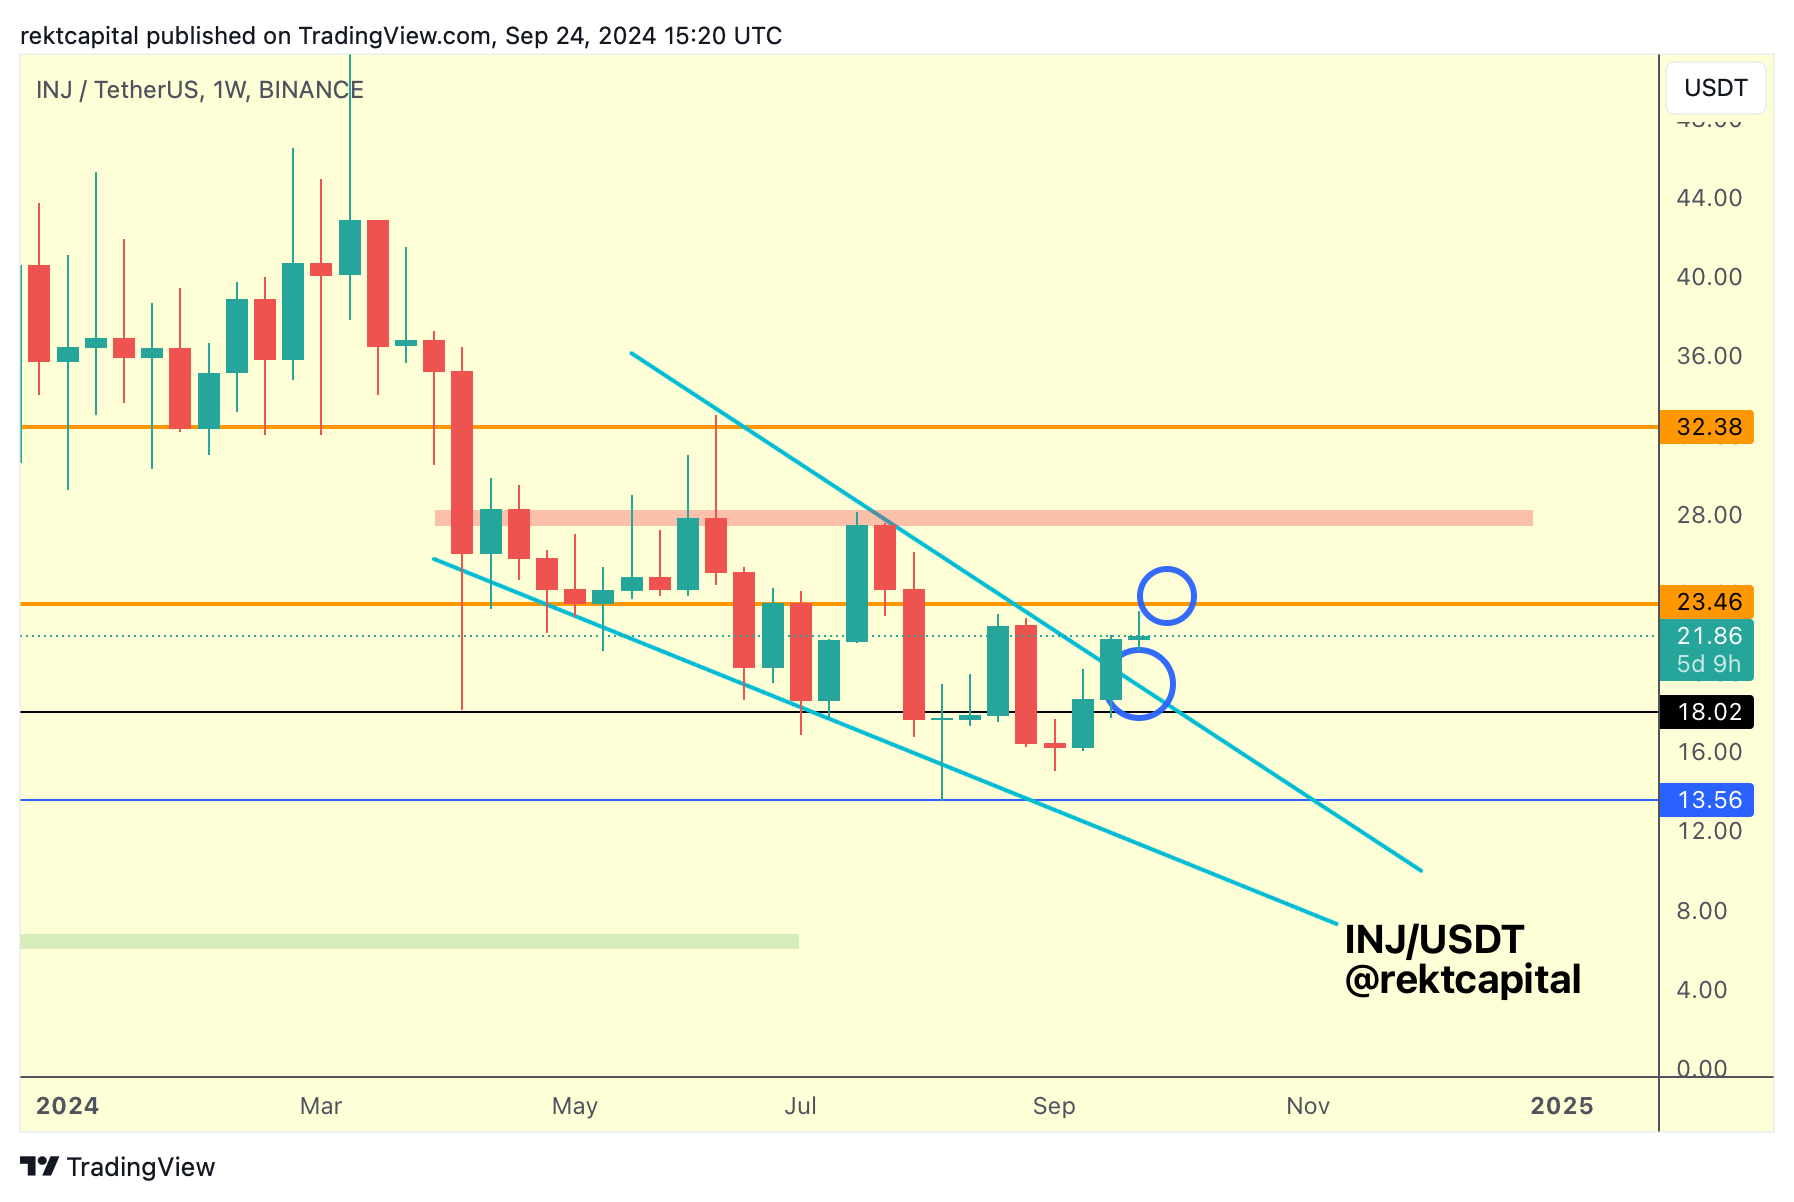
The blue circle at the orange Range High emphasises the need for a Weekly Close above said level to rally higher, whereas the lower blue circle demonstrates the possibility for a post-breakout pullback.
Ultimately, while INJ has broken out from the structure, it still is sandwiched between the $18.02 Range Low (black) and the orange Range High at $23.46, therefore still technically consolidating.
While the breakout from the pattern means that a new uptrend is on the horizon, INJ could potentially spend a little bit of time in this aforementioned re-accumulation range first in preparation for building on its newfound momentum.