Altcoin Market Update #135
Features analysis on Altcoins such as ETH SOL AVAX BNB NEAR TAO VIRTUAL
Hello and welcome back to the Rekt Capital Newsletter
In today’s edition, the following cryptocurrencies will be analysed & discussed:
- Ethereum (ETH)
- Solana (SOL)
- Avalanche (AVAX)
- Binance Coin (BNB)
- Near Protocol (NEAR)
- Bittensor (TAO)
- Virtuals Protocol (VIRTUAL)
But before we dive in, this Friday I’ll chart your Altcoin picks in an exclusive subscriber-only TA newsletter and will cover as many as I can
So if you’d like to have an Altcoin charted, feel free to share max. two TA requests each in the comments below.
I’ll chart the Altcoins that get mentioned and ‘Liked’ the most
Click the button below to leave a comment with your TA request!
Let's dive in to today's Altcoin Market Update.
Ethereum – ETH/USD
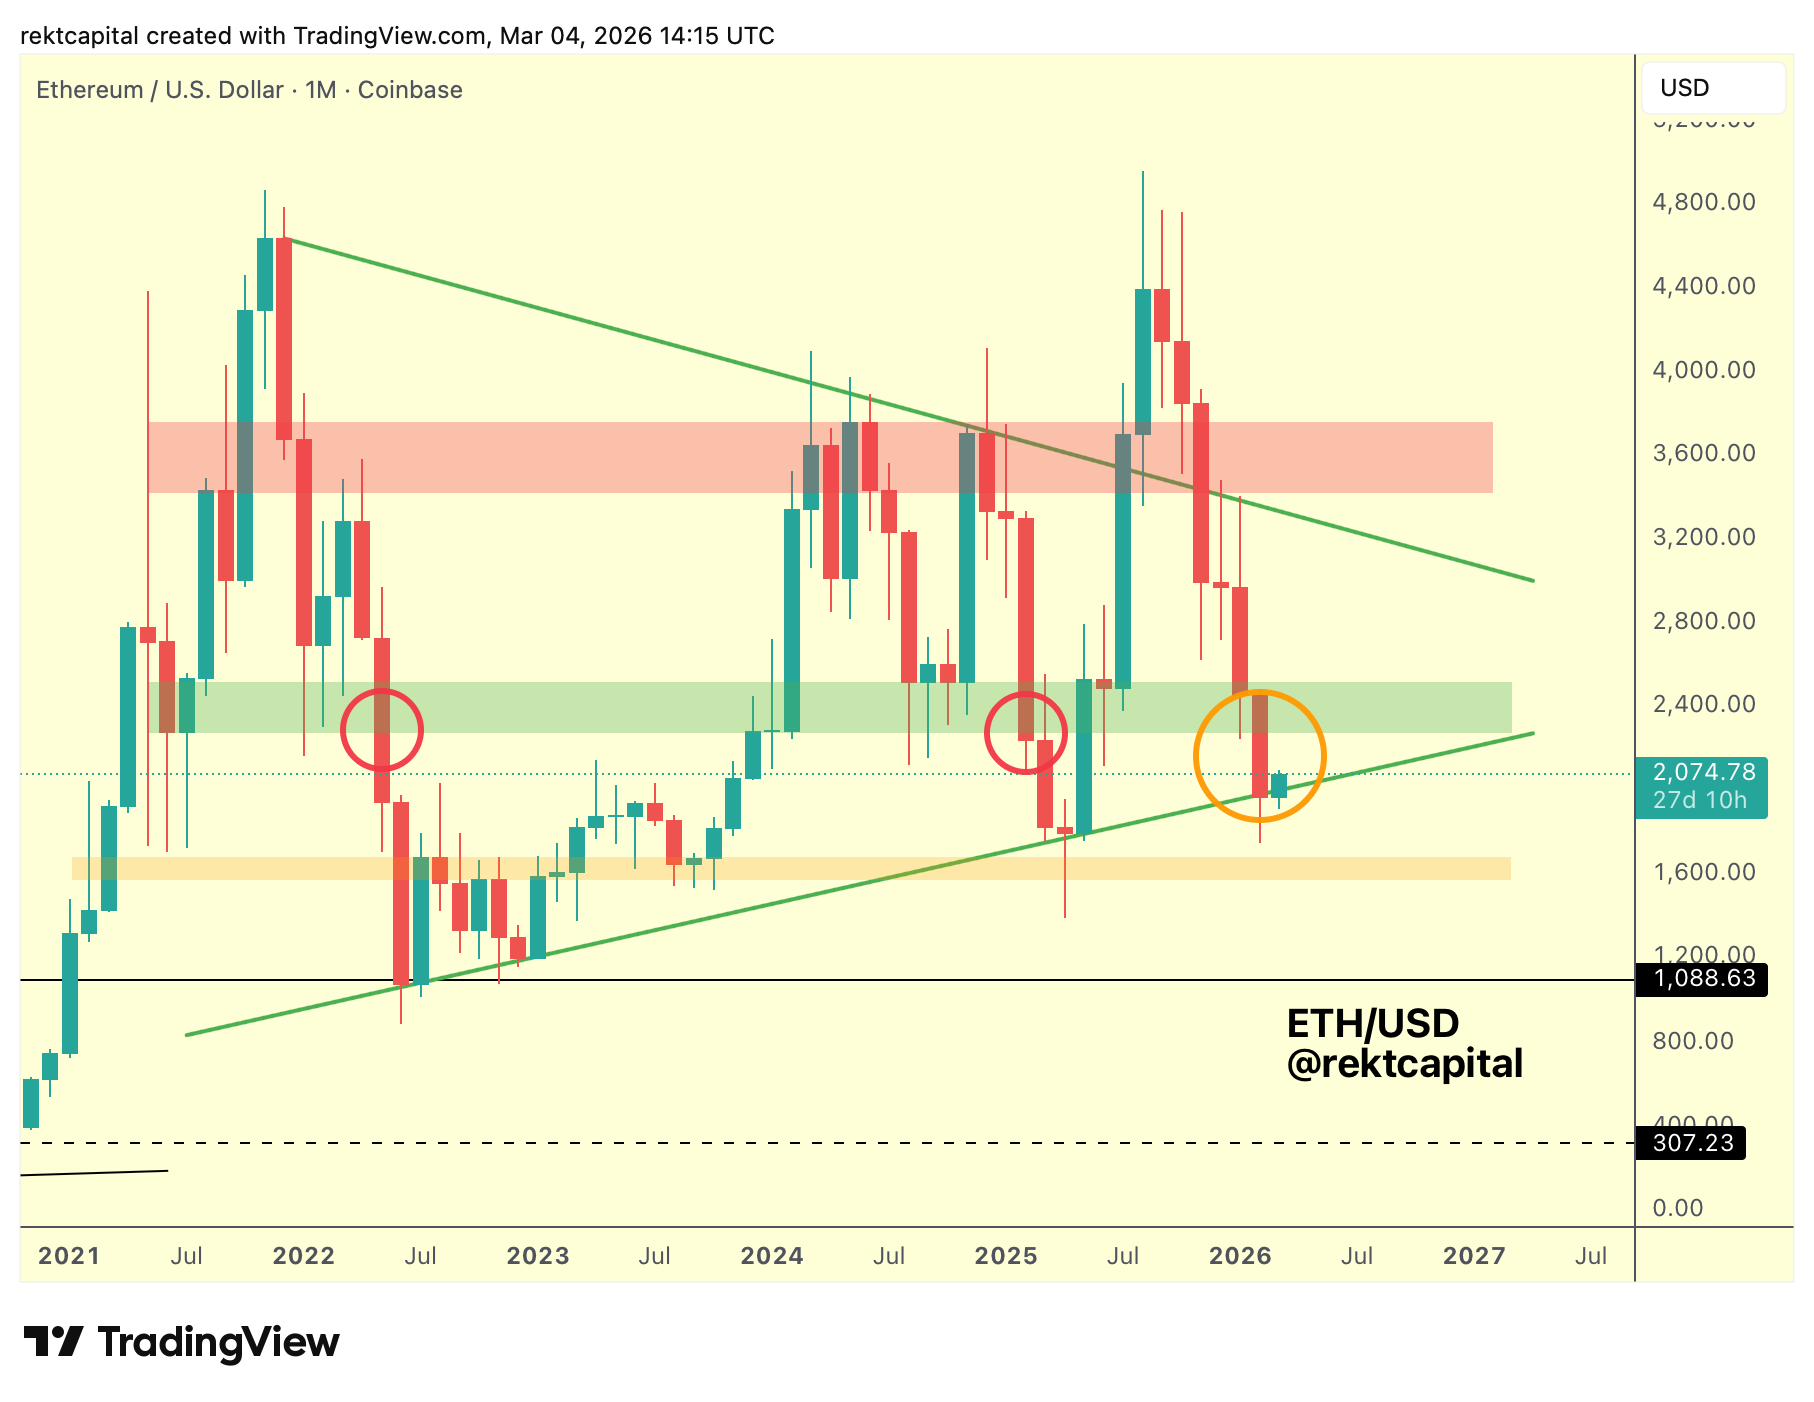
Ethereum has produced a Monthly Close below the multi-year uptrend trendline (green ascending trendline, multi-year macro support).
This places price in a structurally bearish position as the market attempts a bearish retest of that level.
If Ethereum turns this trendline into resistance, that would confirm a breakdown from the macro structure and increase the probability of a deeper move into the orange region (orange horizontal zone, historical demand cluster) below.
Historically, similar behaviour has appeared before.
When Ethereum Monthly Closed beneath the green region (green horizontal zone, historical supply) in 2025, price produced an upside wick into that region before rotating lower and eventually dropping into the orange demand area.
The current situation differs slightly because the recent Monthly Close beneath the green region did not produce a clear upside wick back into that level, meaning the region has not yet been definitively confirmed as resistance.
As a result, the key structural question remains whether the multi-year trendline will transition into resistance or be successfully reclaimed as support.
If Ethereum rejects from the trendline and the current bounce retraces in full, that rejection would signal the trendline dissipating as support and confirm the breakdown scenario.
In that case, price could rotate into the orange region where any rebound may be weaker, forming a lesser rally before additional downside toward the broader cluster between that region and the black trendline. (black ascending diagonal, 2022–2023 macro support).
But this bearish continuation is not confirmed yet.
If Ethereum instead manages to reclaim the trendline as support, the green region overhead could act as a relief cluster where price may rally before the market determines its next directional move.
For now, Ethereum remains at a structural decision point around the multi-year trendline.
Solana – SOL/USDT
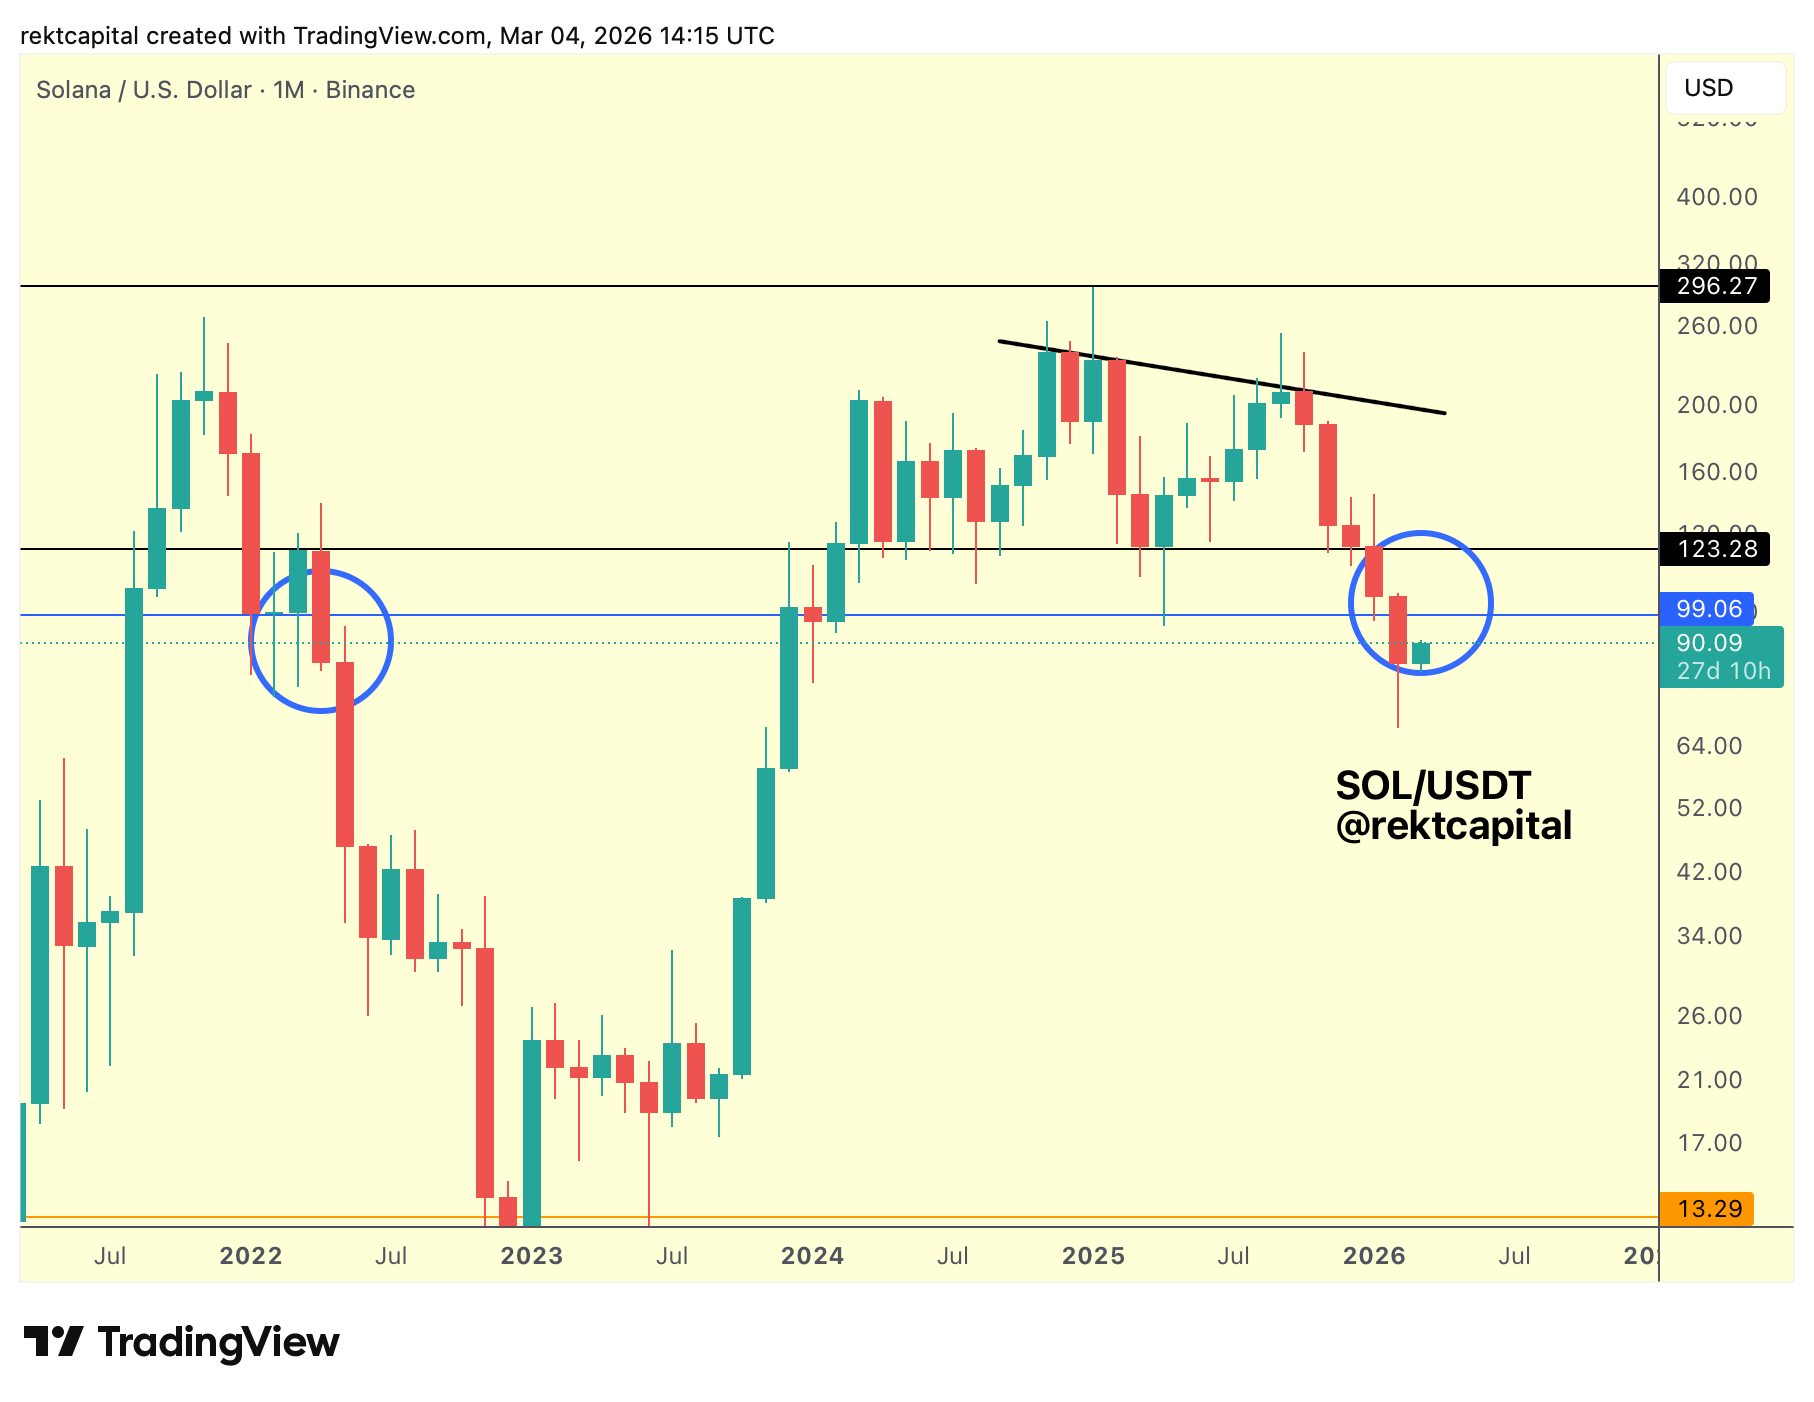
Solana has historically shown a tendency to deviate below the $123.28 level (black horizontal, historical support) whenever that region is lost on the Monthly timeframe.
In 2022, once price lost this level, Solana produced a deviation beneath it while also trading below the $99.06 level (blue horizontal, psychological level) before eventually developing rejection from that region.
The current structure is beginning to resemble that behaviour again.
A Monthly Close below both $123.28 and $99.06 suggests that these levels have been lost as support, but it also opens the door for price to potentially rally back into either level and attempt to turn them into resistance.
In late 2022 Solana produced an upside wick into roughly $100 before rejecting and continuing lower, demonstrating how the psychological level can act as resistance after a breakdown.
If the current bounce develops further, Solana could attempt to tag the $99.06 region and turn that level into resistance in a similar manner.
However, it is also possible that the rebound extends slightly higher, allowing price to test $123.28 as resistance instead.
Which of these scenarios unfolds will likely depend on how weak rebounds remain within the current macro environment, as broader market conditions have begun to resemble early-stage Bear Market behaviour.
If rebounds prove shallow, rejection from the $99.06 region could develop relatively quickly.
But if the market manages to produce a slightly stronger relief rally, Solana may attempt to revisit the $123.28 level before determining whether additional downside continuation is likely.
For now, both $99.06 and $123.28 remain the key levels that could act as resistance should Solana attempt to rally throughout the coming weeks.